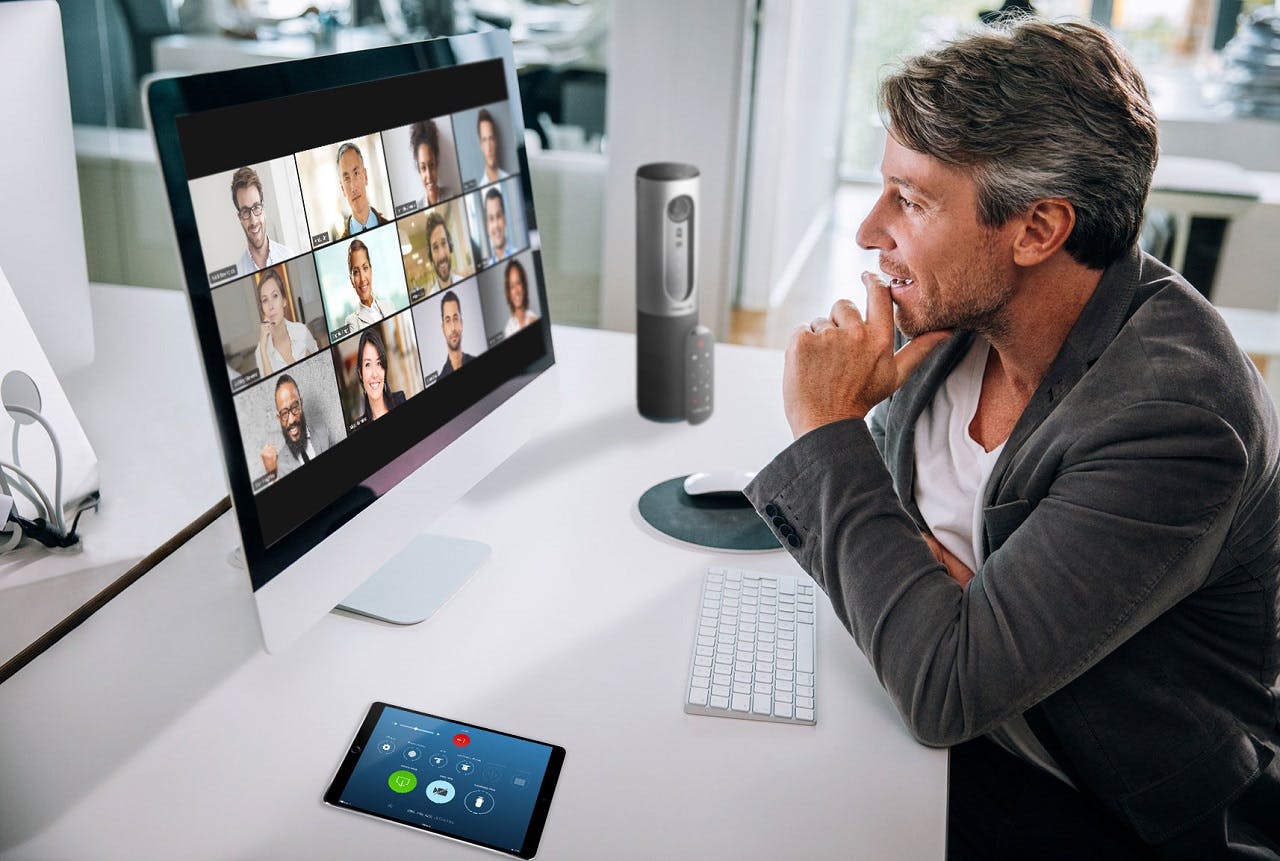
About a week ago, Dan Shvartsman from Seeking Alpha interviewed Knox Ridley and I about the Zoom call we made last Fall, the trade made In January in the low-$60s, and the subsequent trades made in March in the low $100s and mid-$100s on our premium site. We discuss whether the company’s valuation matters now, and how our research site determines if we should hold on or add to the position amidst the rally.
We also discuss the hard questions about Zoom, including the security issues the company faced in April and why removing friction from video conferencing is what led to my high conviction prior to the coronavirus.
The interview touches on the cloud software market as a whole, where I discuss why I’m cautious on Fastly for its edge computing product despite the stock price being neck-to-neck with Zoom Video. I also expand on my strategy for analyzing tech stocks, including why I lead with product first, as well as understanding early adopters and user behavior.
Knox explains his technical strategy regarding Zoom and the importance of letting your winners run. He also discusses other topics, including the effects of the coronavirus, the cloud sector, and also touches on Datadog.
Knox’s strategy is to open trades on breakouts, while maintaining a very tight stop loss. He sets up a 5% to 10% risk stop loss, but does not put trailing stop losses on winning stocks.
Last July, I began covering bitcoin. The premise was based on three phases for widespread adoption: institutional adoption, global economic uncertainty, and mobile payments.
With Square’s cash app reporting fifty percent of its payments being made in bitcoin, or $178 million, it’s time to revisit why bitcoin is a transformative technology that is often misunderstood. Square’s report was for the period between October 1st and December 31st, which represented an increase of 50 percent over the prior two quarters.
Perhaps the more critical point to understand about bitcoin is that its purpose is not to polarize opinions on fiat currency. This is not a political election where you must choose a side. Rather bitcoin solves critical issues with digital trust and the fees associated with financial transactions. Therefore, it can coexist with fiat currency while having a unique purpose.
In January, I covered a string of mergers and acquisitions across fintech, such as Visa-Plaid, Mastercard-Nets & Vocalink, Fidelity-Worldpay and Fiserv-First Data. The problem with these acquisitions is there’s little benefit to customers and merchants. Digitization in finance is built atop age-old infrastructure and ignores the most obvious area in need of disruption: transaction fees.
Peer-to-peer payment apps on the market, such as Venmo, continue to charge merchants 2.9% plus a 30-cent transaction fee. Square charges 2.6% plus 10 cents per transaction. Therefore, the real value to consumers and merchants from fintech has yet to be seen. Last year alone, retailers paid $108 billion in electronic-payment costs — fiat currency can’t solve this issue.
Fiat currency also does not solve security issues as centralized systems do not inherently ensure digital trust. The Association of Certified Fraud Examiners reported a 42% frequency of fraud across small businesses costing an average of 5% of gross revenues. Credit card fraud is at $30 billion per year. Although Mastercard and Visa invest heavily in artificial intelligence for fraud detection, this is not necessary with a decentralized system that uses the network to verify identity.
Apple, Google, Microsoft and Amazon reached market caps of $1 trillion because their products scale to global populations and are required on a daily basis. Bitcoin not only scales to the global population but it also protects their livelihood – a necessity rather than a convenience.
At its current price of $10,000, the market cap of bitcoin is at $250 billion. Meanwhile, Bitcoin offers the most secure network in the world and is capable of reducing fees of $100 billion annually. This is in addition to automating our financial system, which can’t be done without a decentralized blockchain solution. The fact bitcoin hedges against inflation is a bonus, but is not the primary benefit of bitcoin.
Bitcoin V. Baby Boomers
Bitcoin is supported by some of the brightest minds in technology. By far, the most successful investors in technology believe bitcoin is a viable form of currency. Venture capital firms such as Khosla Ventures, Union Square Ventures, Lightspeed, and A16Z have been funding bitcoin projects for some time (circa 2013 and 2014). In an editorial written in 2014, Marc Andreessen put it aptly that there could not be a bigger divide between how technologists feel about bitcoin and how the rest of the world sees bitcoin. He argued that the ongoing movement by researchers and developers to bring this technology to the market will eventually win out over the public’s unwarranted bias.
One of bitcoin’s hurdles is multigenerational adoption. To date, bitcoin is predominantly a retail dominated asset. Charlie Munger and Warren Buffett both criticized bitcoin as worthless. In fact, Buffett went so far as to claim bitcoin is “probably rat poison squared.”
Furthermore, in 2018, Bill Gates spoke about how the anonymity of bitcoin will be used to promote terrorism. This became a reality in 2019 when it was discovered that North Korea partially funded their missile programs by acquiring bitcoins from cyber-attacks they enacted on crypto exchanges.
The issue with listening to Warren Buffet, Charlie Munger and Bill Gates is they are not legendary tech investors. For the most part, Buffet and Munger invest in very large cap tech companies who are well past the stage of incubation. They are looking for safe, value bets with consistent cash flows. Early stage and disruptive tech could not be further from their investment goals.
Despite being a famous tech CEO, Bill Gates is a conservative investor who has done very little in the tech startup world. His top holdings are Berkshire Hathaway, Waste Management, Canadian National Railway Company, Caterpillar and Wal-mart.
Point being, the aforementioned venture capitalists have strong track records in identifying seed stage technology that disrupts industries.
There are a few traditional investors who have begun to embrace bitcoin. Paul Tudor Jones recently announced he has 1% of his fund in bitcoin and will grow to be 2% of his fund. He recently stated bitcoin may be the best performer: “When I think of bitcoin, look at it as one tiny part of a portfolio. It may end up being the best performer of all of them, I kind of think it might be,” he said. “But I’m very conservative. I’m going to keep a tiny percent of my assets in it and that’s it. It has not stood the test of time, for instance, the way gold has.”
Jaimie Dimon of JP Morgan has stated bitcoin “could be internal, could be commercial, it could one day be consumer.” In May, JP Morgan signed its first cryptocurrency exchange customers, Coinbase and Gemini. The bank will provide U.S. users with deposits and withdrawals via wire transfer.
To help institutional adoption, many custody solutions were introduced to the market recently. The word “custody” refers to a third-party provider of storage and security services for cryptocurrencies. In the first five months, six new custodians entered the market while a number of existing crypto custody providers have announced new features.
Vault storage is a popular method which keeps the majority of the crypto in offline storage with a minority in online storage. Custody solutions safeguard cryptocurrency, and go beyond private keys or wallets, which are subject to hacks or the misplacement of hard disk storage. These services are aimed at institutions and hedge funds, and incorporate a combination of storage online for liquidity and storage that is disconnected from the internet.
There has been some M&A in the crypto custodian market, as well, and exchanges such as Coinbase, Gemini and itBit have launched custody solutions. Upcoming modifications to the Glacier Protocol will also strengthen high-security offline storage for bitcoin for storage of over $100,000 (although notably is not for institutional use at this time).
Economic Uncertainty: Look Beyond the United States
In addition to the benefits of decentralization for security purposes and to reduce the intermediary fees involved with transfers, bitcoin is also more attractive than many foreign currencies. For instance, even when Bitcoin lost value from $19,000 to $3,000, it still out-performed the inflation of Venezuela’s currency. On the flip side, when bitcoin rises in value from $5,000 to $11,000, it allows global populations to hold an appreciating asset.
Japan is an excellent case study for an economy that has struggled due to quantitative easing. As of 2018, the Japanese debt-to-GDP ratio is at an all-time high at 254% due to nearly 15 years of quantitative easing. Government debt to GDP in Japan averaged 137.4% from 1980 to 2017. Consequently, Japan is a thriving bitcoin market.
Over 3.5 million people in Japan trade cryptocurrency with the vast majority (84%) between the ages of 20 and 40. The trading volume in Japan rose from $22 million in March of 2014 to $97 billion in March of 2017.
Perhaps more important than any specific geography supporting bitcoin adoption is to consider the Millennial demographic. Bitcoin and cryptocurrencies have been in existence for most of the Millennial generation’s adult life, having launched in 2008, and when this generation ages another decade, crypto and crypto wallets will be frictionless. Edelman Research published a study of 1,000 millennials with over $100,000 in income and found 25% own cryptocurrency.
Paying for daily goods with a mobile wallet, tied to crypto, will become effortless in the years to come. One of the leading startups right now is Flexa’s SPEDN, which is linked to fifteen retailers, such as Whole Foods, Barnes and Noble, Nordstrom, Petco, Ulta Beauty, Lowe’s and Bed, Bath and Beyond. Several other online retailers accept bitcoin, as well, including brands such as Expedia, Hotels.com, Virgin Mobile, AT&T, etcetera.
JP Morgan has also built out its own blockchain settlement service with the dollar-backed JPM Coin. Centralized coins, such as Facebook’s Libra and JPM Coin, sound good in theory but coins do not hedge against inflation and are not scarce assets. They function like cashless digital transactions made through online platforms. AliPay functions similarly (although not encrypted) and was launched in 2004 and now serves 5% of the world’s population.
Starbucks, Apple and Google also allow digital transactions without the need for cash or credit cards. Centralized crypto coins have little benefit over a mobile app payment, and may be more cumbersome as the fiat currencies the crypto is based on will have to be exchanged, whereas with Starbucks, Apple Pay and Google Pay, no conversion to a “crypto coin” has to occur.
Too many critics misunderstand how development around Bitcoin, Ethereum and blockchain protocols improves the fiat system by removing unnecessary costs. Most recently, the Lightning Network has helped mobile payments.
The average cloud software company reported 10% growth during the 2008-2009 recession. Meanwhile, we’ve seen the market react harshly towards companies guiding for 25% growth (such as Elastic). We know the winners from shelter-in-place but we are still sorting out what growth should look like in the middle of the category. My guess is that 25% is going to be higher than average by the time we exit this year.
I spoke about this and other topics this week on a podcast with Simon Erickson from 7 Investing. Simon Erickson is the CEO and Founder of 7 Investing, a company that releases stock tips for long-term investing. The monthly recommendations come from a team of four advisors with a track record of beating the market.
We discussed how cloud software is hot right now but that there are issues boiling beneath the surface. For instance, the upcoming renewal of large annual contracts that may be negotiated down in price or term, which payment model will be more resilient (usage based or per employee), and whether a cloud software company appeals to new subscribers or existing subscribers for upgrades (the latter may be stronger this year). We also discuss how to look for key metrics to help maintain conviction, such as Slack’s engagement 90 minutes per user.
Simon and I cover another topic around IPOs and why a buy and hold investor has different goals than a venture capitalist who is bringing the company public. In many ways, we are in the middle of a grand experiment where VC firms grow the top line at the expense of the bottom line with hopes the revenue growth will drive the public market interest. Over the last ten years, growth hacking has become a popular way of mechanically pumping the numbers through marketing rather than R&D. Uber was a supreme example of this as venture capital dollars were used to subsidize the rides rather than focus on achieving product-market fit, which is often determined by an equilibrium between supply and demand in the pricing.
We also discuss what’s next in tech investing with a discussion on connectivity. In order for most emerging technologies to become a reality, we need a better network layer. I believe we will be lay the groundwork for faster speeds and lower latency this year and next year to prepare for artificial intelligence and machine-to-machine communications. While some will call this 5G, I believe it also includes last mile connectivity and virtualizing infrastructure with software to lower capex.
Lastly, we talk about Roku, a stock that I covered very early after the company IPO’d and well before the market saw the potential. I explain why my conviction on Roku remains steady. Although Roku is an excellent operating system, a full tech stack, and an option for cord cutters, I see the real sticking point being the influx of pay TV advertising dollar over to Connected TV advertising.
0:00 – Introduction: Beth’s “micro trend” investing philosophy 3:00 – Valuation for cloud computing companies 7:56 – Net Retention Rate metrics and Slack 9:28 – Product-Market Fit and Investing Internationally 11:07 – Venture Capital and the Current IPO Market 16:17 – The Importance of Developers: “Bottoms Up” Investing 18:50 – Roku and the Shift to Digital Advertising 24:36 – Trends Investors Should be Watching: Connectivity and Chipmakers
Please Subscribe and Leave a Review for the Podcast Here
This article was originally published on Forbes on May 27, 2020,06:47pm EDTForbes on May 27, 2020,06:47pm EDT
The main risk to cloud software during a less-than-ideal economy is downgrades and churn. Signing new customers can also be a challenge. How a company is faring will often show up in net retention rates. My guess is we will see some cloud software companies remove this metric from their Q2 earnings report or we will see previously strong net retention rates dip below the ideal thresh-hold of 100% to 106%.
Net dollar retention rate is a key metric in software-as-a-service (SaaS) that has generated a lot of buzz over the past ten years or so. This is because it helps to predict cash efficiency for subscription-based models by calculating the inflows of revenue and upgrades minus the outflows of downgrades and churn. The benchmark that SaaS companies are shooting for is between 100%-106%. Exceptional companies report above 120%. Sammy Abdullah did a great write-up of this in Crunchbase.
Key metrics like net dollar retention rate come from venture capital deals where the goal is to exit through the public markets or through an acquisition. This key metric is helpful to consider but it also fizzles out over time. Venture capitalists are less concerned with the long-term growth of a company as they have already exited by the time subscriptions see serious churn.
Box is a great example for this as the company has been on the public market longer than most cloud software companies (although still a relatively short time of five years). Despite having an ideal net retention rate, the company’s revenue growth has declined. Box also had sales and marketing costs at 40-50% of revenue, which I’ll discuss in greater detail in my next article.
2U previously held the record for net retention at 144%. Revenue peaked at 44% year-over-growth in 2019 and now stands at 39.5% year-over-year growth. The stock price has correlated with this growth and the company is trading well beneath all-time highs of $98 with a current price of $35.
Slack has a net retention rate of 143% and Zoom Video has a net retention rate of 140%. These two may be outliers this year as the work-from-home trend will help sustain both existing and new subscriptions.
YCHARTS
Recently I published on whether we would see another dot-com crash considering the high valuations in tech despite a questionable economic backdrop. The main takeaway is that tech has many outliers in both revenue and earnings growth when compared to other industries. However, there is an imbalance in the number of cloud software companies on the market as venture capitalists have pushed for exits in recent years.
The glut in supply will be tested by startup closures and the lack of venture funding in the Series A and Series B stage as the two ecosystems are closely intertwined. This imbalance across the board is more important than focusing on the valuation of any one company.
When I speak of the glut of inventory, I am referencing the three-fold increase in competitors from an average of 2.6 competitors per company five years ago to 9.7 competitors per company today. Companies with more than 250 employees use an average of 124 SaaS applications, while companies with up to 10 employees use an average of 26 SaaS applications.
Cloud software will be more resilient than many other categories. But there will be some cloud software companies that see an impact on one side of the equation or both sides of the equation – this means either fewer new customers new customers or more churn or downgrades in existing customers more churn or downgrades in existing customers or both.both. There are three points where weakness can occur. Notably, companies that have annual recurring revenue will be more protected.
What we know is that the economy is not as strong this year as it has been in previous years. Some will argue the market is not the economy (which is true), however, cloud software can’t stop the spiraling effects of lower IT/cloud spending and tighter budgets that follow a weaker economy. One area that companies might reduce costs is to trim down on the number of cloud software and tools they use. Unemployment could exacerbate this if the subscriptions are paid per employee.
Sign up for I/O Fund's free newsletter with gains of up to 403% – Click hereSign up for I/O Fund's free newsletter with gains of up to 403% – Click hereClick here
Lower net retention rates eventually happen to roughly half of the software companies that are on the market for three years but covid-19 may speed this up or cause churn in otherwise strong subscription models.
Before the coronavirus, I championed cloud software at their low point in September of 2019. It seems like a distant memory now but Zoom, Twilio, Okta and MongoDB were down roughly 30% in a very short time span of one week over no major news or negative catalyst. My article’s subtitle stated, “Investors have dumped cloud stocks, which could prove to be a costly mistake” — this could not have been more accurate as cloud software led the rally off the March lows with some stocks up nearly 200% in one month. I was firm during the value rotation that these stocks would out-perform and I expanded on this as one of my top tech trends in 2020.
Considering we are at all-time highs and many gains have been clocked, I think it’s the perfect time to identify the indicators that might help determine if a company will be resilient post-covid. This was very important when the market showed signs of indiscriminate selling and is also important now when we’ve seen indiscriminate buying.
I consider this rally indiscriminate because many companies have withdrawn guidance. There is less information than usual to determine forward growth and valuations. Yet, we have seen massive upward moves based off very little information. With that said, many investors are feeling quite reassured right now as it’s been hard to not make stellar gains in cloud software no matter what company you picked.
I don't think the broad category of cloud software will end the year as strong as it began the year as the market will begin to see cracks in the three weak points mentioned. There will, of course, be many exceptions – this is commentary on the broader category of cloud software.
Conclusion:
Value investors like to focus on valuations as an indication for a bubble, especially since their objective is to find cheap companies. This works in some industries but it does not work in tech. This is because some of the most expensive tech companies are also the top performers with insatiable addressable markets.
Of course, what you want to avoid (at all costs) is a hypergrowth company that fails to report the expected growth rate. The market is a game of musical chairs, especially now that machines are driving the majority of the market. The only way to win at this game without having a team of Python software developers is to either be “early in and early out” or to be “early in and never get out.”
Paul Tudor Jones is one of many money managers who believe having a great defense is more important than having a great offense. This means you should have a mindset of protecting your money rather than making money. In some cases, net retention rates will become accelerated this year. For those that don’t accelerate, I will be favoring a strong defense.
Next week, I’ll be publishing on why the advent (and now maturing field) of growth marketing may contribute to a few surprise failures across cloud software.
Please note: The I/O Fund conducts research and draws conclusions for the Fund’s positions. We then share that information with our readers. This is not a guarantee of a stock’s performance. Please consult your personal financial advisor before buying any stock in the companies mentioned in this analysis.
This article was originally published on Forbes on Apr 30, 2020,01:41am EDTForbes on Apr 30, 2020,01:41am EDT
Roku has gained up to 600% in less than 3 years since its IPO despite having many objectors along the way. In light of these sizable gains, Roku has seen five significant drawdowns ranging between 41% to 67%. Therefore, when considering if Roku will go boom or bust this year, I believe it will do both.
When I first began bullish coverage on Roku at $30, the company had a misunderstood business model. At the time I pointed out that Roku was an ad platform first and a hardware player second. At the time, the market was backwards-looking as Roku’s device sales made up 59% of total revenue in the six months leading up to its public offering.
Through 2019, its device sales made up only 34% of its revenue, while the remaining majority came from its platform. What investors initially failed to realize was that the hardware player was a means to its high-yielding ad platform. Roku has an added advantage from the data it has on consumers due to owning the hardware and the many content apps that need access to an OTT device.
With this history, my guess is investors will get Roku’s story wrong again this year as Roku must chose between its top line and bottom line. Covid-19 offers an important opportunity for Roku as OTT usage is skyrocketing and the company must expand globally for long-term growth. (I’ve covered extensively why the domestic market is no longer pertinent in my Netflix coverage).
Often times, growth and earnings are at odds with one another as revenue requires sales and marketing (or other investments), which ultimately eat at the bottom line. Or, in Netflix’s case, revenue growth and free cash flow are at odds. Conceptually, most investors know there is a cost to hyper growth, but in practice, it’s hard to see one of your portfolio companies miss those magical analyst estimates.
Despite monetizing through ads rather than subscriptions, Roku’s best role model for becoming a global media company is Netflix. What Netflix has done beautifully is ignore the pressures that comes with being a public company in favor of being a hyper growth company. This included taking on debt and other risks to gain ground. While I’m not suggesting Roku should take on the debt levels that Netflix has, it wouldn’t hurt for Roku to do whatever it takes to solidify itself as the leading global AVOD channel and ad platform this year.
International Expansion
Roku predicts that by 2024 roughly half of all U.S. TV households will have cut the cord or never had traditional pay TV.
Earlier this year, Roku began its expansion into emerging markets by entering Brazil. Strategically, Roku has partnered with the electronics company AOC to launch AOC Roku TV. The AOC TV/Roku platform will feature popular local content from Globoplay. With over 5,000 channels and over 1,000 free channels, Roku should do well in emerging markets. (I’ve also covered this in detail in a previous analysis.)
Furthermore, Roku has announced fifteen TV brands that come integrated with the Roku platform models. These models are available not only in the U.S., but also in the UK, Canada, and Mexico as of 2020. This kind of strategic partnership with TV models will help the company scale globally, which is a critical next step for Roku.
Pandemic Outlook
Roku recently stated that its commission revenue is expected to jump as viewing hours have increased due to COVID-19. However, it will still feel the shock of ad demand drying up.
Oppenheimer analyst Jason Helfstein cut the price target from $165 to $110. He forecasts Q2 ad platform growth to be around 18% YoY from the previous estimate of 62% growth. With that said, AVOD views are expected to grow 50% and streaming hours increase by 22%.
Needham forecast one or two more quarters of ad weakness, with ad growth uncertain in 2021. Analyst Laura Martin, who has a strong track record on this stock, said Roku may be able to withstand the storm with its unique model. “A key thing that differentiates Roku in this environment is that it doesn't set its ad-prices at auction,” Martin said in a Tuesday note. “It uses a direct sales force to set negotiated prices, just like traditional linear-TV. We believe that, even though ad-demand has been falling, Roku is still charging $30 + CPMs, and instead, is cutting the number of ads it runs per hour.”
Sign up for I/O Fund's free newsletter with gains of up to 403% – Click hereSign up for I/O Fund's free newsletter with gains of up to 403% – Click hereClick here
Any weakness in Roku’s price will likely be temporary, considering its financials and positioning. Although you could argue this is the case for many advertising companies, connected TV ads are in a growth trend while mobile is reaching saturation.
Unlike many ad-tech peers, Roku is well diversified. According to emarketer, Roku collects $1 million for letting a service like Disney+ take over the Roku home screen. Other companies like Netflix pay $1 for every Roku sold with a Netflix quick-launch button on them.
For every new market Roku expands into and every unit sold, these numbers will only increase with Roku’s brand and helps diversify the company from varying levels of ad demand.
Recent Financials
The company released a preview of Q1 results on April 13, 2020 and reported revenue in the range of $307 to $317 million. This suggests growth of 51% YoY.
For Roku, it matches the same growth we saw in Q1 of 2019, which shows the continued demand in this growing space. Roku estimates 39.8 million active users as of March 31, 2020, which is a net increase of 3 million since December 31, 2019.
It estimates streaming hours of 13.2 billion, which is a 49% YoY increase.
Gross profits were in the range of $139 to $144 million, which suggests a growth of 40% YoY, while net losses were in the range of $60 – $55 million, compared to a net loss of $9.7 million for the same period last year.
As Roku scales internationally, profitable earnings are not expected within the next year. This is the part that Wall Street can often be uncomfortable with; however, it should be factored in that Roku’s revenue growth is solid. As stated above, it has little competition in the niche area of OTT it dominates with manageable debt.
Technical Analysis
Roku has moved in a clear uptrend off the March lows. It recently hit a wall of resistance, which includes a key level around $125-$120, the 200-Day SMA, as well as a downward sloping trend-line from its recent peaks.
With low participation at current prices, as exhibited in the volume, it will need to find more buyers to break through this region. The MACD shows weakening momentum on the daily chart and the RSI shows that its uptrend has broken, as well. We can expect a pullback in Roku in the coming days/weeks.
The key support level to watch is the $102-$86 region. If this zone is broken, we can expect a retest of the recent lows. However, if it holds, we expect new highs for Roku in the coming months.
This article was originally published on Forbes on Apr 30, 2020,03:15am EDTForbes on Apr 30, 2020,03:15am EDT
On recent earnings calls, Snap and Google have confirmed that record ad demand in January and February was met with a significant pullback in March. While many investors are speculating the bounce back in ad tech will happen as quickly as Q3, the respective companies are declining to comment on forward guidance for the rest of the year. This analysis will look at how this will effect The Trade Desk.
In my recent analysis, I question if the market has priced in the advertising downturn. Notably, Google has plenty of cash to weather a downturn while Snap has turned towards raising debt. Meanwhile, ad exchanges, such as The Trade Desk, are particularly exposed.
Here are a few reasons why I’m pivoting away from the bull thesis for The Trade Desk in 2020 and possibly into 2021.
The Bull Case for The Trade Desk:
To be transparent, I had predicted ad-tech to be one of the best tech trends in 2020. This prediction came true as January and February were record months for ad revenue. However, the story has changed now that large brands are reducing ad spend, or as Google recently said in their earnings report, March “experienced a significant and sudden slowdown in ad revenues.”
The Trade Desk is a “demand-side” or “buy-side’ ad platform which allows advertisers to buy ads in auction-like format through real-time bidding. This is an automated method for buying and selling inventory that eliminates the need to call up an agency or salespeople to place the ad. The official term for this is programmatic, and the trend is popular in ad-tech, with over 50 demand-side platforms that transact/broker programmatically.
By utilizing machines instead of salespeople, the cost of the ads go down and both parties (supply/publishers and demand/advertisers) prefer programmatic due to fewer middlemen and higher returns.
Strong drivers for The Trade Desk include omnichannel capabilities, which is the ability to buy ads across many channels, such as mobile, video, audio, display, social and native. The universal ad ID is another important differentiation as it offers an anonymized ID that helps track users, target audiences and provide attribution. This feature is rare for a third-party ad network and helps The Trade Desk compete with first-party data companies.
Connected TV ads is the segment with the most growth. Winterberry Group research predicts ad spending on addressable TV and OTT will see a 44% boost in 2020, while linear TV barely have a 1.9% increase.
Another major bull case for The Trade Desk is the trailing financials and growth have been solid. The company released its Q4 and 2019 results on February 27th. The total spend reached a record $3.1 billion in 2019, an increase of 33% year-over-year. Total spend in Q4 was $1 billion.
Sign up for I/O Fund's free newsletter with gains of up to 403% – Click hereSign up for I/O Fund's free newsletter with gains of up to 403% – Click hereClick here
Revenue grew 39% to $661 million with Q4 revenue growing 35% year-over-year to $215 million. Net income grew 23% YoY to $108.3 million.
Non-GAAP net income grew 42% and the company reported non-GAAP EPS of $3.69 compared to $2.70 for 2018. Quarterly non-GAAP EPS was $1.49 compared to $1.09 in the year-ago quarter.
Looking forward, The Trade Desk is expecting EPS of $0.45 and revenue of $797 million for the year — although this is likely to come under revision due to covid-19.
The primary reason that The Trade Desk may be more exposed in 2020 is that they are not the publisher of the content where the ads are sold. For instance, Amazon Fire will fill their inventory first from Amazon’s DSP before pulling from the secondary market (or further down the waterfall). As Amazon will likely illustrate, the only real moat that exists in advertising comes from owning the audience as a publisher — or even better — by owning the device.
There is also little loyalty from advertisers who will quickly switch to the next best-performing programmatic DSP. Switching costs for ad exchanges are very low and this creates fickle behavior in times of distress.
According to Interactive Advertising Bureau (IAB), digital ad spend is down 33% and 24% of advertisers are pausing all ad spend for the rest of the year. For the period between March through June 2020, 70% of buyers adjusted or paused their planned ad spend.
The ad industry is highly competitive, and the track record of third-party ad platforms performing well long-term is nearly non-existent following a a few years in the limelight (i.e. Millennial Media and Criteo). These ad exchanges saw how fickle advertisers can be when Google and Facebook expanded their ad platforms in 2012-2014 and the demand quickly shifted towards working directly with the walled gardens.
If you do not recognize these names, it is because Millennial Media’s stock cratered and was bought out by AOL while Criteo has also seen a drastically lower stock price over the past few years. In fact, there are very few cases where ad exchanges have done well for a significant period of time due to a lack of intellectual property, which becomes apparent during transformative shifts.
Most importantly, despite The Trade Desk having solid financials and growth, the company’s valuation is outsized. As of now, forward price to sales is at 21. If/when The Trade Desk lowers its revenue guidance, the P/S will be approximately 25 P/S — or the highest in its history. This is despite having the most uncertainty and the highest risk in the company’s history.
Conclusion:
The stock market may be rallying off Q1 ad-tech performance, yet the earnings calls have been very clear about the steep drop in ad revenue and uncertainty of when a rebound will occur. Facebook called it “facing a period of unprecedented uncertainty.”
One could argue that valuations are forward looking to a rebound in 2021. Yet, the majority of ads are closely tied to consumer spending.
Notably, The Trade Desk has been a recommendation of mine throughout the past and up until this month. The company may become a recommendation again in the future.
This article was originally published on Forbes on Mar 25, 2020,09:10am EDTForbes on Mar 25, 2020,09:10am EDT
Uber burns over $4 billion annually yet the company is stating it will be profitable by the end of 2020.
Further analysis is required to look deeper into whether Uber is able to accomplish what it has promised or if the company is buying time and appealing for a more promising valuation before it has to raise more cash. The latter is something Uber is incredibly skilled at as the company now trades well below its last private valuation of $76 billion with a current market cap of $35 billion.
Despite the coronavirus causing the company to cut back operations nation-wide with declines of up to 80% in ride-sharing volume, Uber is receiving analyst upgrades based on the company’s variable cost structure. These analyst upgrades come despite slowing growth and $7 billion in debt on the balance sheet while being deeply unprofitable with record-setting adjusted net losses of $4 billion in 2019.
The overall financial performance defies the CEO’s statements, which are based on a single non-GAAP reporting measure “Rides Adjusted EBITDA.” This non-GAAP reporting measure is new to Uber as of Q3 2019 and replaces the less favorable contribution margin.
Overview of Uber:
Uber’s revenue in the fourth quarter of 2019 grew 37% to $4.07 billion. However, it reported a net loss of -$1.1 billion compared to a net loss of -$887 million in the same period last year. EPS was negative -$0.49 compared to -$0.52 expected.
Full-year 2019 revenue grew 26% to $14.1 billion and net loss was -$8.5 billion compared to a net profit of $997 million for 2018. Stock-based compensation was $4.6 billion in 2019 for a net loss of $4.1 billion and adjusted EBITDA of negative -$2.73 billion.
Notably, Uber sold some operations in Russia and Asia, which provided one-time income, and caused the company to post the $1 billion in net income in 2018. In 2017, Uber posted similar losses at $4 billion.
Monthly Active Users (MAU) increased 22% to 111 million in the fourth quarter of 2019 helping to boost the company’s revenues. The Uber Eats promotional expenses continue to drag the company’s profits despite being the segment with the most growth.
Earlier this year, the company sold its food-ordering business in India to a local company Zomato in exchange for a stake in the company.
Uber investors are encouraged by the non-GAAP Rides Adjusted EBITDA metric, which breaks out the profitability of Uber’s ridesharing business separate from Uber Eats and other bets, such as autonomous vehicles. Uber reported a 281% increase in Rides Adjusted EBITDA from $195 million to $742 million in Q4 and a 34% increase from $1.54 billion to $2.07 billion in full year 2019. The company’s overall EBITDA margin is -57.58% compared to the sector median of 12.99%.
The company stated on a recent call to investors that they have $10 billion in unrestricted cash. Uber carries long-term debt of $5.7 billion and a capital lease obligation of $1.5 billion, or about $7 billion total in obligations. Despite the combination of steep losses and ample debt, the CEO stated the balance sheet is “incredibly strong” due to the absence of short-term debt.
There is clearly a sharp contrast between the financials and the CEO’s statements, which means Uber has a lot to accomplish this year in the face of coronavirus shutdowns.
Analysis of Adjusted Rides EBITDA:
Uber has been opportunistic in breaking out adjusted EBITDA for rides as a means for reaching profitability. In the 10Q details, Uber does not break out the number of ridesharing trips and monthly active users separately from Uber Eats and Freight although there is a statement in the summary that Gross Bookings grew 20% and Eats grew 73% year-over-year.
Gross Bookings is defined as “the total dollar value” including taxes, tolls, fees and without an adjustment for consumer discounts and refunds. Essentially, Gross Bookings is similar to Ride Revenue, the metric that Lyft reports. Uber’s Gross Bookings growth is actually quite low at 20% compared to Lyft’s Ride Revenue at 52%.
Some of Uber’s weaknesses and risks are known to the market. This is one reason the price-to-sales ratio is very low at 2.3 with a forward price to sales of 1.7. Compare this to other companies that went public last year, such as Zoom Video with price to sales of 53 and a forward price to sales of 39, or Slack with a price to sales of 17 and a forward price to sales of 14.
Uber may look attractive to some investors at this current valuation given the risks. However, this is a company that is far from true profitability across all revenue segments.
Subsidies Inflate Demand
I’ve been critical of the ride-sharing business model since pre-IPO when the media speculated Uber would reach $100 per share.
The problem with the ridesharing business model is that the more money the business makes, the more the business loses. This is reflected in the past three years of financials between 2017-2019. Essentially, Uber and Lyft used private funding to subsidize rideshare demand in the year leading up to their public filings.
In 2017, Reuters published that Uber passengers pay only 41% of the actual cost of their trips, citing research from transportation consultant Hubert Horan. At the time, Reuters warned that this creates an “artificial signal about the size of the market” after Uber had released limited financial data as a private company that showed losses of $708 million per quarter.
The cost of the ride is not high enough to cover the cost of the ride, therefore, we see unusual losses. However, if the companies raise prices, demand will decrease. These companies must chose between subpar growth in order to become profitable or subpar earnings in order to drive demand.
The markets did not reward Uber for driving demand at the expense of its bottom line. Instead, Uber became the biggest IPO loss in history. Uber is attempting a new path, which is to pare back on losses while accepting lower demand and revenue at 20%. This is most evident in the
The problem with this scenario is that the market may not like slowing growth either. In fact, we see “Trips” growing 32% year-over-year, which is much lower than the 100% growth reported in the S-1 Filing when trips had doubled from 5 billion trips in September of 2017 to 10 billion trips in September of 2018. (Revenue should be aligned with number of trips, and also doubled, unless subsidies were very steep.)
It’s also important to note that Uber removed the original non-GAAP measurement “Contribution Profit (Loss)” and replaced it with Adjusted Rides EBITDA. This is because the Contribution Margin was too revealing of Uber’s losses with a declining rate from 14.7% in Q2 2018 to 8.2% in Q2 2019.
In an effort to appear profitable in the ridesharing segment, Uber has stopped reporting on contribution margin. – UBER
Lyft: Pureplay Model
Lyft provides a model for a pureplay ridesharing company with a reported 52% year-on-year increase in its fourth-quarter 2019 revenue to $1.01 billion up from $669 million. This is much higher growth than the 20% Uber reported for its ridesharing segment.
For the full-year 2019, revenues increased 68% year-over-year to $3.6 billion
Net loss increased to $356 million from a net loss of $248.9 million in the same period last year, yet on an adjusted basis, the net loss margin was slightly higher in the current year at 35% compared to 37.2%.
Adjusted EBITDA loss margin improved from 37.5 percent in Q4 2018 to 12.9 percent in Q4 2019. More importantly, Lyft has remained consistent with its non-GAAP metrics and reports a contribution margin of 54% up from 45.5%.
In my opinion, Lyft’s financials are more straight forward in how the ridesharing model can achieve profitability while maintaining enough growth to satisfy tech investors.
Beware of a Changing Story
The last thing to note, which is quite important, is the story for Uber is changing frequently. Uber Eats is driving the growth and is the more stable part of the business in the current coronavirus economy, yet a portion was sold off in India to lower expenses and achieve profitability.
Autonomous vehicles were a major part of Uber’s story due to concerns around drivers who bring never-ending legal battles on the misclassification of employment. In as recent as January, autonomous driving was the most likely path to profitability for Uber. This story has changed entirely in two months’ time, yet it will be quite challenging for Uber to separate autonomous vehicle R&D from its financials.
CEO Dara Khosrowshahi highlights the “variable cost structure” of the business, which translates to not having to pay drivers employment benefits. Notably, the misclassification of employment is receiving renewed criticism with the ride-sharing business shut down from the Coronavirus.
The workforce of 5 million drivers have no unemployment, sick leave or health care. Although company is offering sick pay for drivers who test positive for the coronavirus, this does little for the majority of the drivers who are ordered to stay home to avoid the spread of the virus. Now, the company is now asking the government to offer the drivers benefits while Uber highlights its variable cost structure to investors.
Conclusion
The statement that Uber will be profitable is confusing at best as the company cannot simply separate the ride-sharing segment in order to make this claim. Even if this was possible, the ride-sharing growth is the lowest across all segments at 20% and ignores the catalysts of Uber Eats and the autonomous driving division.
In a recent call, Khosrowshahi stated the company has $10 billion in unrestricted cash, yet the CEO also stated the company could lose up to $6 billion from the Coronavirus quarantines. I believe Uber will need to raise more money in the near future and will do (and say) whatever necessary to raise its market cap before doing so.
Last week, I wrote about how algorithms led to the fastest bear market in history. I explained that what’s driving the speed and severity of the bear market is the escalation of algorithmic trading, which is more prevalent than it was during the Great Recession in 2008.
March 2020 holds the record for how quickly stock prices dropped into a bear market — only 16 days after the S&P 500 Index hit its last closing high Feb. 19. The second-fastest bear market was the notorious 1929 crash that set off the Great Depression, followed by the elevator drop of 1987’s Black Monday.
Americans invested in stocks through 401(k)s and other retirement accounts may be unaware that they are part of a small minority of investors who are in it for the long run. Guy De Blonay, a fund manager at Jupiter Asset Management, said 80% of the stock market was controlled by machines during the selloff in 2018’s fourth quarter. In 2017, analysts at J.P. Morgan said “fundamental discretionary traders” accounted for only 10% of stock trading volume.
The “flash crash” on May 6, 2010, caused the Dow Jones Industrial Average DJIA, -4.44% to drop 998.5 points (about 9%) within minutes, only to recover a large part of the decline later in the day.
According to the Commodity Futures Trading Commission (CFTC), high-frequency trading “did not cause the Flash Crash, but contributed to it by demanding immediacy ahead of other market participants.”
Flash moves of nearly 1,000 points in either direction are now the new normal, with 14 occurring in the past 30 days. Four of those intraday moves were more than 9%. Trading curbs, known as circuit breakers, were hit four times this month.
Furthermore, according to Wells Fargo, robots will replace 200,000 banking jobs over the next 10 years. And Citigroup C, has formed a lab to cross-train traders and developers for machine learning and artificial intelligence.
Perhaps we will get a coronavirus vaccine or antiviral tomorrow, and business will go on as usual. Or, the opposite could happen, and things will get worse. One thing is certain: Until there is regulation, the machines will profit either way.
This article was originally published on Forbes on Mar 25, 2020,10:18am EDT
Cybersecurity stocks were on a roller coaster ride in 2019 months before the coronavirus took hold. Last year saw exhilarating highs and sudden drops in stocks such as Crowdstrike and Zscaler with both losing nearly fifty percent of their market cap from August to October.
These companies post solid revenue growth yet their bottom lines reveal evidence of stiff competition in the very crowded cybersecurity sector.
YCHARTS
Crowded Cybersecurity Space
In 2004, the global cybersecurity market was worth a mere $3.5 billion and grew nearly 35-fold to $120 billion by 2017. As of 2018, there were up to 200 vendors competing in each layer of cybersecurity. Primary stakeholders, such as chief information security officers (CISOs), use as many as 80 security vendors across their teams.
According to Cybersecurity Ventures, global spending on cybersecurity will exceed $1 trillion cumulatively over the five-year period of 2017 to 2021. (The 80-plus vendor per CISO certainly doesn’t hurt).
Where there is 35-fold growth, startups are sure to follow. This growth helps companies out of the IPO gate while sustaining long-term can become challenging in crowded markets.
The recent RSA conference in San Francisco, one of the last to be held before the coronavirus took hold, was a reminder of cybersecurity being a peak saturation with over thirty-six thousand attendees and hundreds of exhibitors – all for a market that is roughly equal to 1/8thof Apple’s market cap (or Google, Amazon and Microsoft’s).
Solid Top Line Growth, High SG&A Costs
In Crowdstrike’s recent earnings report last week, the company reported a fourth-quarter loss of $28.4 million, or 14 cents a share, with an adjusted loss of 2 cents a share when considering stock-based compensation and amortization of acquired assets. Revenue was up an impressive 90% in the fourth quarter at $152.1 million compared to $80.5 million in the year ago quarter. This was well above the forecast of $135.9 million to $138.6 million.
There is no question that Crowdstrike’s top line is investable. Meanwhile, the bottom line may face headwinds. SG&A expenses eat at the company’s operating expenses. Sales and Marketing last year required fifty-five percent of revenue, or $266.6 million of the $481.41 in revenue. Total SG&A expenses were at $355 million, or 73% of total revenue.
Historically, Crowdstrike spent 91% SG&A to revenue in the quarter ending October 2018 and 72% in the quarter ending October 2019.
Fierce competition in a rather small addressable market was one reason I cautioned against buying Crowdstrike at the IPO. The market size for endpoint security was at $6.4 billion in 2018 and will grow to $13.2 billion by 2022, according to Statista.
Compare this to Crowdstrike’s market cap of $11 billion today with a peak market cap of $21 billion in August of 2019. In the S-1 filing, Crowdstrike states the addressable market is $24.6 billion and will reach $29.2 billion, yet this includes modules for categories that cannot stand alone.
Zscaler Inc (NASDAQ: ZS) released its second-quarter fiscal year 2020 results on February 20, 2020. Revenue grew 36% year-over-year, which is slower than the CAGR of 56% from the fiscal year 2016 to the fiscal year 2019. The company’s full-year revenue guidance of $414-417 million, which suggests a year-over-year growth of 37% at the mid-point. This was slightly better than the median analyst estimate of $410.85 million.
Zscaler’s report also shows evidence of a crowded sector that requires outsized sales and marketing expenses of $61 million per quarter, or 61% of revenue, and total SG&A at 90% of revenue.
Cybersecurity Consolidation on the Way
Crowded markets typically evolve into consolidation as startups with more advanced R&D are acquired by larger companies who need to move quickly to protect their moat. Consolidation in the cybersecurity space will make it more challenging for nimble security vendors to compete, especially because large-cap companies with moats can offer a more intrinsic approach to problems.
VMWare’s acquisition of Carbon Black in October of 2019 for $2.1 billion is an example of consolidation. Financial analysts were cautious of the acquisition, stating, “What remains to be seen is whether VMware backed the right horse in this race.” The comment refers to the very crowded space of endpoint security, where Crowdstrike, Cylance, Symantec, McAfee, Sophos, Palo Alto Networks, and FireEye all offer endpoint protection and compete.
VMware’s moat lies in its access to 70 million virtual machines and over half a million customers, which can help Carbon Black scale very quickly. After acquiring endpoint security company Carbon Black, the combined entity is now able to offer a more complete service rather than requiring CISOs to pile up on separate tools for various endpoints.
Sign up for I/O Fund's free newsletter with gains of up to 403% – Click hereSign up for I/O Fund's free newsletter with gains of up to 403% – Click hereClick here
Following the acquisition, VMware reports a new revenue line item in its earnings reports titled “subscription and SaaS revenue” in which Carbon Black’s revenues will partly contribute. This segment reported revenues of $556 million, an increase of 52% year-over-year and faster than the group’s revenue of $3.07 billion, which grew 11% year-over-year for the 4Q of fiscal year 2020.
Akamai is similar to VMWare in that they are expanding from their core products to compete in cybersecurity. Akamai is traditionally a content-delivery network and website-acceleration company. With this level of access to the edge, where most security hacks occur, Akamai has found itself in a serendipitous position to offer competitive security products, such as protection from distributed denial of service (DDoS) and website-application security.
One of the main value propositions Akamai offers is to simply reduce vendor bloat, as the company consolidates content delivery network (CDN) needs with the adjoining website security. Notably, Akamai’s SG&A expenses are 33% of total revenue with sales and marketing at 18% of revenue.
Coronavirus Selloff Will Require Conviction
Splunk and CyberArk had reclaimed 52-week highs in February prior the coronavirus selloff. Despite having a healthy competitive lead in their respective domain, both companies could not stave off the indiscriminate selling.
Founded in 2003 with a public listing in 2012, Splunk is one of the original big data platform companies that came of age at time when big data software had a long runway. The company has since expanded to security to leverage their data software as a way to troubleshoot and scan for breaches.
Splunk Inc announced its 4Q fiscal year 2020 results on March 4, 2020 with total revenues growth of 27% year-over-year to $791 million. Software revenues grew 33% y-o-y to $617 million with average recurring revenue (ARR) up 54% year-over-year.
According to Gartner’s magic quadrant, CyberArk is the leader in privileged access management. The company listed on the public markets over five years ago, posted 90% revenue growth in 2015, and has since stabilized to a consistent 20% revenue growth. CyberArk released its 4Q and full-year 2019 results on February 12, 2020. Revenue for the 4Q rose 19% year-over-year to $129.7 million with the full-year revenue growth of 26% year-over-year to $433.9 million.
Conclusion:
The coronavirus selloff will level the playing field for cybersecurity stocks. Investors will need to evaluate if their investments can overcome the risk that too much supply inherently brings to a marketplace. Expect to see smaller vendors repeatedly challenged by large players who have millions of customers. The word “moat” is popular in the financial industry, but it’s never been more important than in a crowded field such as cybersecurity.
Microsoft is unique from its peers as its cloud services were designed to serve the needs of large companies. This is particularly true with regards to Microsoft’s lead in hybrid cloud, which is attractive to many companies who are adopting cloud infrastructure for the first time, and who desire more flexibility than traditional cloud-only services can offer.
The company’s fiscal Q2 2020 earnings report today prove that Microsoft’s slow and steady focus on the enterprise customers is paying off. Operating income and net income were especially healthy, rising 35% and 38% on a GAAP basis, respectively, from a year earlier. Profits came in at $11.6 billion, and earnings-per-share of $1.51 were up 40%. Analysts polled by FactSet were expecting $1.32 per share on average.
The company is guiding for revenue of $34.1 billion to $34.9 billion in the fiscal third quarter, in-line with analyst estimates of $34.16 billion.
Looking beyond growth, this was also a banner quarter for Microsoft, who secured the Department of Defense’s $10 billion JEDI cloud contract. This contract will cover 1,700 data centers and move 3.4 million end users and 4 million endpoint devices off private servers and onto the cloud. Amazon is contesting the decision.