Skip to content
Logo-main-white.860316a8

I/O Fund

  • Home
  • Free Stock Analysis
  • AI Stocks
  • BEST OF 2025
  • Analysts
  • Nvidia Hub
  • About
    • Case Studies
    • About Us
    • Premium Services
    • Pricing
    • Notable Wins
    • I/O Fund Reviews
    • Media
  • Contact Us

Category: Finance

Verified Returns & Risk Management: A Retail Investor’s Imperative

Posted on March 27, 2024June 30, 2026 by io-fund
Verified Returns & Risk Management: A Retail Investor’s Imperative

Last year was a stellar year for investors – in 2023, the Nasdaq 100 rose 54% for its best annual return since 1999, while the S&P 500 gained 24%. The Magnificent 7 were the de facto leaders of this market rally, with the group’s returns averaging 111% for 2023 and accounting for more than 60% of the S&P 500’s annual gain.

This was the opposite of 2022, the only year in history in which Treasury bonds and the S&P 500 both lost 10%. It was a year so rough that it marked the greatest destruction of wealth in modern history with an estimated $57.8 trillion lost across all asset classes combined.

And while 2023’s Big Tech-driven rally looks superb in headlines, a deeper glance shows this was not always the case – especially when accounting for 2022’s steep losses. In fact, on a 3-year cumulative basis, the indexes’ performances make a strong case for investing in indexes over ETFs.

broad market stocks level % change

Simply put, allocating only to a leading sector, such as cloud in 2020 and 2021, would lead to significant underperformance through 2022 and 2023, when multiples were cut dramatically as budgets were slashed. Semiconductors underperformed in mid to late 2022, but outperformed significantly in mid to late 2023. It’s these disparities in between different sectors of tech that prove the value of active investing versus passive investing.  

Our firm believes that having an actively managed portfolio is where you get the best of both world’s – performance that far exceeds the indexes and ETFs by paying close attention to allocation, (quickly) cutting stocks that do not meet specific criteria, and choosing stocks that have strong, fundamental strength.

The I/O Fund is releasing our official 2023 returns plus our updated cumulative returns next week — so stay tuned to your inbox. Our returns help to prove an actively managed portfolio can exceed all indexes and major ETFs on a cumulative basis (that we are aware of).

However, before we release our returns, we think it’s prudent to discuss the importance of verified returns for retail investors. The I/O Fund goes to great lengths to deliver a rare level of transparency for our Members. This is not about a victory lap; it’s about raising the bar. We do not know of another research site that publishes every single trade in real-time, and then takes this further to have their performance independently verified. We do this because it’s the right thing to do, but there are other reasons putting our best foot forward with verified returns is important for retail investors.

The New Norm of Quant Trading Puts Retail at a Disadvantage

Algorithms account for up to three-quarters of equity trading volume, as hedge funds and investment banks are increasingly turning to algorithms and quant trading systems to outperform benchmarks. Algorithmic trading is one of the primary culprits to the extreme volatility seen in recent years, most notably with the flash crashes and rallies of 2020.

This creates a serious disadvantage for retail investors and those who do not have a team of Python developers to leverage quant systems that trade in the blink of an eye. Ray Dalio, the fund manager for Bridgestone, has openly discussed that the best approach to the modern-day stock market is what he calls “the man and machine.” His firm has 1,500-employees that use computer models to test hypotheses; which is just one of the many advantages hedge funds and institutions have over retailers.

According to Dalio, the ideal is to have an algorithm work alongside a portfolio manager for a customized approach to predicting the markets. Although the I/O Fund does not have a team of Python developers, we partnered with Vincent Duchaine of WealthUmbrella  in 2022 to close the gap between human-driven actions and emotionless machines.

This marked an important turnaround for our firm as we gave up what I would call “retail idealism” which centers around the idea that holding a stock for a long period of time is retail’s only defense. This works during times of economic expansion, but where this can go (horribly) wrong is when a new, more challenging macro changes the outlook for any given company.

For example, in 2022, hundreds of tech stocks finished down 70%, and nearly every tech stock finished down 50%. This includes the indestructible FAANGs, with many falling to trade at historic low valuations. An investor would have to be in denial to focus on the poor performance of an individual company rather than acknowledge something much bigger was going on. 2022 highlighted a crucial yet overlooked point (that we encourage our readers to do): let go of the idea that picking good stocks alone can save a portfolio in the tech industry and to instead fully embrace risk management tools.  

2023 reiterated this point very well – although numerous stocks saw face-ripping rallies, such as Nvidia’s 239% rally and Meta’s 156% gain, only a handful outperformed and ended with positive returns on a 2-year basis from 2022 through 2023. Looking at Meta, despite that 156% rally, it ended just 5.2% higher since the start of 2022. Tesla rallied nearly 102% in 2023, but since the start of 2022, returns were (-29.5%). Alphabet’s 2-year return was (-2.6%), even with its 59% rally in 2023.

Risk Management Tools

In April 2022, the I/O Fund stopped relying on stock picks as the primary, offensive measure because this approach simply wasn’t working with the new macro. After partnering with Wealth Umbrella on an automated hedge, the I/O Fund began to boldly hedge up to 100% of our portfolio, at times, and we still continue this approach today.

We pivoted to playing defense rather than offense. Those who watch team sports will understand this transition well, as the strategy changes from attempting to make money (or make a goal) to a strategy that prevents losses (or prevents a goal).

Unlike many other all-tech portfolios and ETFs, we believe a more active stance is necessary for long-term tech investing. We also believe that the easy years of buy and hold are over, marked by the narrow leadership we saw in 2023 where a small number of stocks drove the rally last year. As a result, we rotate our portfolio frequently, raise cash and actively hedge our portfolio with an automated signal.

Real-time trade alerts are sent to our members the minute we decide to buy, sell, trim or add to a stock. For those who may not be aware, this is extremely challengingextremely challenging to do as it combines the two most advanced forms of portfolio management.

  1. One of the most advanced forms of portfolio management is real-time trade alerts. This places immense pressure on a portfolio manager as the stakes are high to record what you do every second in real-time. To voluntarily choose to have the highest level of accountability in retail is nearly unheard of, yet registered fund managers are required to do this and file their stock trades.
  2. Secondly, hedging up to 100% of a portfolio is also a large psychological hurdle, and traditionally a risky one. Markets spend the vast majority of their history in uptrends, for one. Secondly, the amount you can lose on a short is literally infinite, to where one’s downside risk is capped at 0 on the long side. To overcome these hurdles, we have spent considerable resources developing a “man and machine” signal with the help of Wealth Umbrella that is truly state of the art.

It’s only natural for retail services to want to ease the pressure of having to report in real-time. The stakes are much higher when what you do is recorded the minute the action is taken, but overall, having the highest level of accountability possible has made the I/O Fund much sharper investors.

Logging trades in real-time also places immense pressure on the analysts at the I/O Fund, as well, who are not allowed to simply choose a stock but must also determine the allocation for the stock. After recommending a stock, the analysts must help the portfolio manager actively manage the position, which can change at any time.

There is a reason most services do not provide this level of transparency and activity. The more granularity that is offered, the more skill is required. Also, compare this to social media, where some investors will casually claim trades that were not logged in real-time.

Verified Returns

In addition to a lack of risk management tools, I believe a lack of verified returns in the retail space contributes to the losses this investor type experiences. Smart money is careful about who they consider a good investor — they do not take someone’s word they are a good investor; they make the investors or firms they follow prove it. Every single hedge fund must report their returns, which reduces the chances of posturing.

Retail is not offered these checks and balances, and instead, this investor type follows many influencers and research sites who verbally state their performance without proper verification. Across the board, retail is offered a very low amount of accountability – this includes unverified month-end reviews, a list of stock tickers, unchecked screenshots, or other methods that are easy to manipulate. This widespread acceptance of loosely stating a stock performance is odd, to say the least, considering the finance industry is more inclined than any other industry toward deceptive practices.

How the I/O Fund Sets a High Bar for Accountability

Over the past three years, the I/O Fund has invested over $165,000 into accountability and transparency for our members. When we launched in July of 2019, for the first year or so, we used a forum hosted by Tribe for our trade alerts, but by January of 2021, we had migrated to SMS and email tools that were the least likely to experience an outage for our real-time trade alerts. This costs us $30,000 to $40,000 per year, depending on our trading frequency.

In addition to this, we use an auditor from a large firm in San Francisco to mathematically review and verify the performance of our I/O Fund portfolio trading account and crypto account. The process is quite extensive and it takes up to four months to complete. This costs $4,500 per audit and we’ve completed five audits for a total of $22,500 spent on this process. Accountability is expensive but we feel it’s worth it.

Conclusion

I believe real investors take necessary steps to prove their returns, that they accept the pressure that comes with registering trades in real-time and that they do not expect anyone, under any circumstances, to lower their standards and accept an unverified number regarding portfolio performance. Due diligence on stocks requires scrutiny, and this same level of scrutiny should be applied to the company you keep in the finance industry. 

To put it simply, the I/O Fund was founded to bring the standards that smart money insists on to the retail investment class. We think retail will be empowered to outperform when their standards are higher on who they follow and what research they read, and when they refuse to accept a lower standard on transparency.

The I/O Fund is wrapping up our annual audit for 2023 this week (you can access our previous audits including here, here, here and here). We look forward to adhering to the high standards that retail investors deserve. You can look forward to our 2023 performance being published shortly.

Please note: The I/O Fund conducts research and draws conclusions for the Fund’s positions. We then share that information with our readers. This is not a guarantee of a stock’s performance. Please consult your personal financial advisor before buying any stock in the companies mentioned in this analysis.

Recommended Reading:
  • The Importance of Verified Returns and Risk Management for Retail Investors
  • Official Press Release: I/O Fund’s Cumulative Returns Double the Nasdaq Following a Tough 2022
  • Arm Stock: AI Chip Favorite Is Overpriced
  • Top 3 Ad-Tech Stocks For 2024
Posted in Finance, Financial AnalysisLeave a Comment on Verified Returns & Risk Management: A Retail Investor’s Imperative

Where the I/O Fund Holds Cash When Banks Keeps Failing

Posted on April 20, 2023June 30, 2026 by io-fund
Where the I/O Fund Holds Cash When Banks Keeps Failing

Amidst the growing skepticism in our banking sector, we thought it would be helpful to introduce an alternative way to both protect and diversify one’s assets. The information below discusses a method the I/O Fund uses to hold its cash, which is safer than banks, and yields 4.5% or higher.

The I/O Fund is an actively managed portfolio. We are not financial advisors, rather we discuss openly and in great detail what we are doing with our money through weekly webinars and real-time trade alerts. This has led to 174% better returns compared to Ark and results that are double the Nasdaq in the same time period.

Banks failing presents a new problem for investors, which is where to hold cash. We shared our thoughts on Treasury Direct accounts with our premium members last month, where we explained that opening a TreasuryDirect account allows anyone to directly purchase savings bonds and Treasuries (Notes, Bonds, Bills, TIPS, and FRNs) directly from the U.S. government.

This offers an option that is outside of the banking system, offers a decent yield, and is very liquid. This article is offered as a guide that will walk you through the process of opening a TreasuryDirect account and how it can potentially help secure your cash in these uncertain times.

Below is a brief video clip from our premium webinar. For more detailed information, please reference the article below.

More Concern in the Financial Sector & Why Having a Plan for Cash is Important

The current news cycle and media narrative suggests that it’s just regional banks that are facing challenges due to interest rate risk and depositors withdrawing funds to go to larger "too big to fail" banks. However, taking a closer look at the charts reveals that the situation may be more complex and not limited to just U.S. regional banks.

This is what appears to going on in Financial Sector in the US (XLF), which is comprised of the largest and most recognizable financial institutions in the US.

I/O Fund XLF chart

After breaking down from a bear pennant, we have a clean 5 wave drop from the February high. Until XLF can reclaim the $36 region, which is about 8.5% from current prices, then risk remains high.

International banks like the Royal Bank of Canada ($RY) also are exhibiting similar ugly trends. In fact, warnings are present in most major banks around the world. Here are some quick bullet points:

  • Japanese banks Mitsubishi UFJ Sumitomo and Mitsui Financial are down 15%-17% since March 9th.
  • The Commonwealth Bank of Australia is down ~12% since March 14th, and HSBC in England is down ~14% since late February.
  • Itaú Unibanco, Brazil's top bank, is down ~18% since last November.
  • Deutsche Bank is down another 21% from it January high, while the largest bank in France, BNP Paribas, is down 14% from its February high.

It appears that the risk doesn’t stop at the regional bank level but is international as well. Global banks are facing significant challenges, and it is unlikely the banking problems are over.

I/O Fund Royal Bank of Canada chart

The Royal Bank of Canada ($RY) looks a lot like some of the bigger banks in the US.

An Alternative Solution to Uncertainty: A TreasuryDirect Account for an Extra Layer of Security

To tackle potential issues in the banking sector, we are taking a proactive approach with some of our cash. We are purchasing T-Bills directly from the U.S. government through a TreasuryDirect account, eliminating counter-party risks with banks. If the banking situation deteriorates or becomes systemic, funds in these accounts remain safe and secure.

The Appeal for T-bills vs. Bonds

Investing in four-week T-bills might be the prudent choice in this situation, as they carry no default risk compared to bonds and do not tie up your cash for a long period of time. As an example of what to expect, the four-week Treasury bill rate is around 4.5%, compared to 0.15% last year. This is much higher than the long-term average of 1.22%.

Sign up for I/O Fund's free newsletter with gains of up to 221% – Click hereSign up for I/O Fund's free newsletter with gains of up to 221% – Click hereClick here

It is true that the U.S. government has never defaulted on its federal debt, which includes the umbrella of Treasury bonds, bills, and notes. However, it is also true that countries around the world default on their debt obligations, either partially or entirely, all of the time. We saw Iceland default on their external debt in 2008, and even recently Argentina defaulted on their sovereign debt in 2020 smack dab in the middle of the pandemic. In the event that the U.S. defaults on its debt, it’s speculated that T-bills are safer then bonds because of their shorter-maturity periods, lower interest rate risk, higher liquidity, and general overall market perception.

Opening a TreasuryDirect Account: A Step-by-Step Guide

Here is a link to a video that we gave to our premium subscribers, where I go throguh step-by-step on how to open a TresuryDirect Account.

TreasuryDirect Account

1. Visit the TreasuryDirect website: Navigate to the official TreasuryDirect website (www.treasurydirect.gov) and click on "Open An Account."

2. Choose account type: Select the appropriate account type (individual, entity, or minor) and fill out the online application form: this essentially like a brokerage account with the government, so you will need your Social Security Number (SSN), email address, and bank account details.

3. Create a password and security questions: Choose a strong password and security questions to ensure the security of your account… this account will hold your cash and security should be prioritized just like your bank account ect.

4. Simply review and submit: Double-check the information you filled-out and submit the account application.

5. Check your email for a confirmation message from TreasuryDirect and follow the instructions to verify your account and email address.

6. Access your account: Use your account number, password, and the one-time passcode sent to your email to log in to your TreasuryDirect account.

7. Purchase bonds and T-bills: Once logged in, navigate to the "BuyDirect" tab and select the desired security type (T-bills, notes, bonds, etc.). Follow the on-screen instructions to complete your purchase. 

Lessons from the 2008 Crisis: “History never repeats itself, but it does often rhyme.”

The 2008 financial crisis exposed the banking system's fragile backend to the public in a fast and violent sweep, catching many people unprepared. Most people had no idea what fractional banking was, nor how complex their banks had become. These banks have only grown in size and complexity since.

We rely on banks to store money, but it does come with some risks. When a bank fails, individuals can depend on government-backed insurance (FDIC) to recover their deposits and restore stability in our banking system. However, this process can be lengthy and challenging. As we saw in 2008, no one wants to wait on a Gov’t backed insurance timeline to get money back that they thought was being safely stored in a bank account.

Conclusion:

Considering the current risks within the banking sector, going through the process of opening a TreasuryDirect account offers a safe alternative for people to store their cash in. This guide was written to help you navigate the process of buying Treasury marketable securities and really to show just how simple it is to get started securing your cash with bonds and T-bills. It is important to stay informed and protect what you have worked hard for, we wanted to shine light on something we felt hasn’t gotten enough spotlight in the investment world.

What’s Next:

This Thursday at 4:30 pm Eastern, I will be holding a webinar for premium Tech Insider Network members to discuss how I plan to navigate the broad market, as well as various tech entries including Tesla. We offer trade alerts plus an automated hedging signal. In addition, we are an audited portfolio with 174% better returns than Ark and are results are double the Nasdaq in the same time period.

We identified a strong buy signal in Bitcoin in December, and we also identified Nvidia's (NVDA) bottom in October. Bitcoin is a leading asset YTD in the market, and Nvidia is the leading stock in the S&P 500. We take gains often and we discuss this in our weekly webinars and on our premium site, one of which is scheduled for next Thursday, April 27th.

Recommended Reading:

Bitcoin Vs Banks: Here's Where the Price Goes Next
Banks, Inflation, and One More Low
The Importance of Verified Returns and Risk Management for Retail Investors
Bitcoin is up 40% in 2023, Here’s Where it Goes Next

Posted in Broad Market Today, Finance, Financial Analysis, InflationLeave a Comment on Where the I/O Fund Holds Cash When Banks Keeps Failing

SIVB: Unintended Consequences

Posted on March 17, 2023June 30, 2026 by io-fund

We thought it may be helpful to our readers to share our initial thoughts after the SIVB bailout. As we write this, CSFB has reported material weakness in its financial reporting so we’ll see if this will create further stress on the financial system.  

In response to the SIVB collapse, the Fed had no choice but to take decisive action to further stem deposit outflows and the potential risks to the banking system. The Fed’s response was a comprehensive pledging of cash in exchange for all Treasuries, agency debt and mortgage-backed bonds without any discount being applied to face value. Commentators have described these actions as akin to quantitative easing on demand for the financial system.

Below is a chart of the Fed Funds rate dating back to the 1950s. As recent history shows, the Fed had embarked on a policy of ultra-low interest rates – brought on by the GFC and again by the Covid pandemic – that were unprecedented in scale and duration. This created unintended consequences and fueled asset bubbles and inflationary pressures throughout the economy.

Similarly, as the Fed aggressively raised interest rates in 2022, this has also created unintended consequences. The collapse of SIVB. While SIVB’s demise seems not to pose a systemic financial risk at the moment.  Its overnight collapse is a reminder that the banking sector remains vulnerable to sharply rising funding costs after years of operating in a low rate environment.

SIVB’s demise has been well covered in the financial press, we’ll touch upon some salient details. There were red flags, a couple that were somewhat unique to SIVB.

  • Greg Becker, SIVB’S former CEO, served on the board of the Federal Reserve Bank of San Francisco until the day of the collapse. He had lobbied that that banks of SIVB’s size should not be subject to as much regulation as the mega banks
  • In 2018, a bipartisan bill was passed that exempted banks with $100 billion to $250 billion in assets – Silicon Valley's size – from requirements that included regular examinations of how they would fare in tough economic times, known as 'stress tests.'. The 2018 law also provided the Fed with more discretion in its bank oversight. The central bank subsequently voted to further reduce regulation for banks the size of Silicon Valley. In October 2019, the Fed voted to effectively reduce the capital those banks had to hold in reserve.
  • The bank had grown rapidly. Its assets quadrupled in five years to $209 billion, making it the 16th-largest bank in the country. And roughly 94 percent of its deposits were uninsured because they exceeded the Federal Deposit Insurance Corporation's $250,000 insurance cap. That percentage was the second highest among banks with more than $50 billion in assets, according to ratings agency S&P. Signature had the fourth-highest percentage of uninsured deposits – which uncoincidentally also failed. Signature had large exposure to crypto clients.  
  • According to analysis done by UBS. SIVB had 52% of its deposits from venture capital and private equity related businesses and funds.  First Republic Bank, another California-based lender that dropped more than 60% in pre-market trading on Monday, only 8% of its deposits to those types of clients.

Ultimately SIVB’s risk management, or the lack-thereof, proved it’s undoing. It’s not uncommon for banks to have unrealized losses due to their bond holdings. According to Bloomberg,  US banks had booked $620 billion in unrealized losses on their available-for-sale and held-to-maturity portfolios at the end of last year, according to filings with the FDIC. But SIVB’s investment portfolio had swelled to 57% of its total assets. No other competitor among 74 major US banks had more than 42%. It was this toxic brew of a very large unrealized losses on Treasuries and mortgage bonds combined with a concentrated depositor base that proved fatal.

This was exacerbated by SIVB’s failure to hedge the interest rate risk on these holdings and an upcoming  credit downgrade. Once it was made known to the market that SIVB may raise equity to pre-empt the downgrade, this was the catalyst for deposits to be withdrawn which worsened their credit standing. It became a self-fulling prophecy.

So as technology focused investors, how do we assess the current situation?

Let’s start with the macro. I have written extensively on concerns over the broad market from both a technical and macro perspective. The latter namely due to the Fed’s inability to combat super-core inflation and the over-leveraged consumer. I and the rest of the team have been monitoring for further signs of weakness.

Financial Sector Earnings

Within the overall S&P 500 earnings, it is estimated that Technology contributes the most at about 25%, while the second largest is Financials at 19%. The S&P 500’s decline in the SPX has in part been driven by reductions in earnings for the Technology sector. The SIVB fallout could lead to  a reduction in earnings estimates across the financial sector. These downgrades can be driven by a number of factors such as lending margins being squeezed as cost of bank deposits are still catching up with rate rises that have already happened, higher regulatory costs and higher loan loss provisions, just to name a few. This could be another headwind for S&P 500 earnings in the future.

Banks are a transmission mechanism for the economy. To the extent that is hindered, there will be a negative trickle down effect for the economy that are yet to be seen.  Somewhat ironically, the SIVB collapse may help Fed Chairman Powell’s goal to reduce supercore inflation driven by the sticky services component through aggressive interest rate hikes. Albeit clearly not the way he intended.

Technically, the Financials ETF has broken down.

What will the Fed do in the next meeting?

Given the recent CPI data, the Fed has every justification to continue to raise interest rates, which we discussed here. However, will the SIVB failure give them a reason to pause? The futures market has the odds at a resounding no.

And the reason is that under the headline CPI number, we are seeing the 2nd month in a row of 3 MoM annualized acceleration. If you combine the prior 3 months and annualized them, the number comes out to 4.08%, compared to last month’s reading at 3.4%. Furthermore, energy, goods, core, shelter and services all showed similar accelerations.

How to invest in technology in current environment?

In the public markets, the technology sector was already facing headwinds as higher rates impacted valuation. Meanwhile those with consumer exposed businesses have also had earnings impacted. The SIVB fallout adds additional headwinds. SVB’s demise has revealed the extent of the damage rising interest rates might cause on companies and banks that had grown accustomed to years of cheap money. Startups are especially vulnerable to any systemic drop in confidence, given their reliance on investors’ faith in their long-term potential when profitability might be years away.

Private markets will face a tougher funding environment. There is a talk of ‘day-of-reckoning’ for the private equity/venture capital-funded universe and may force PE funds to mark down private books sooner than they’d like to.

Softbank is a good public and sentiment proxy for the private markets. Before the meltdown, Masayoshi Son’s investment powerhouse — which has poured more than $140 billion into names from WeWork to ByteDance Ltd. and DoorDash Inc. — had already been reeling from the post-pandemic economic downturn.

SoftBank, similarly central to the global VC arena, has lost around 7% or $5 billion of its value since news of SVB’s difficulties emerged. Its credit default swaps are surging for the second straight day, and speculation is growing on what asset sales might be ahead should SoftBank need to help out portfolio companies.

SoftBank sees little impact from SVB’s failure on its portfolio companies, a SoftBank spokesperson said, adding that the company expects no impact on its own finances. Most Vision Fund portfolio companies are cash-rich, the company said during its earnings call last month. However, if we look at the chart, the market disagrees, as it is ~63% off its 2021 high, and only ~32% from testing its COVID low.

Attributes of stocks that we are looking for

This past week, I/O Fund analysts held a webinar that discussed “How to Build a Defensible Tech Portfolio.”  Although macro continues to throw curveballs, we believe a defensible portfolio can help alleviate any concerns.

Defensible means the portfolio should be overweight the bottom line. For tech investors, stocks that do not materially cash burn are ideal right now. Per Silicon Valley Bank’s CEO Gregory Becker: “While VC (venture capital) deployment has tracked our expectations, client cash burn has remained elevated and increased further in February, resulting in lower deposits than forecasted.”

Per the same Reuters report, Silicon Valley Bank is selling assets to position for higher interest rates and faster cash burn: “We are taking these actions because we expect continued higher interest rates, pressured public and private markets, and elevated cash burn levels from our clients.”

Elevated cash burn is something the public markets will be very sensitive toward into the foreseeable future. We have found that expanding operating margins and GAAP profitability was rewarded last year, and we believe this is the best way to position for an unpredictable 2023. At the very least, while the FED raises rates, cash burn will continue and we believe it will surprise investors at times just how cash strapped the tech sector truly is. This is why we have built a defensible tech portfolio, as outlined in this webinar here.

Posted in Finance, Financial Analysis, InflationLeave a Comment on SIVB: Unintended Consequences

SIVB: Unintended Consequences

Posted on March 17, 2023June 30, 2026 by io-fund

We thought it may be helpful to our readers to share our initial thoughts after the SIVB bailout. As we write this, CSFB has reported material weakness in its financial reporting so we’ll see if this will create further stress on the financial system.  

In response to the SIVB collapse, the Fed had no choice but to take decisive action to further stem deposit outflows and the potential risks to the banking system. The Fed’s response was a comprehensive pledging of cash in exchange for all Treasuries, agency debt and mortgage-backed bonds without any discount being applied to face value. Commentators have described these actions as akin to quantitative easing on demand for the financial system.

Below is a chart of the Fed Funds rate dating back to the 1950s. As recent history shows, the Fed had embarked on a policy of ultra-low interest rates – brought on by the GFC and again by the Covid pandemic – that were unprecedented in scale and duration. This created unintended consequences and fueled asset bubbles and inflationary pressures throughout the economy.

Similarly, as the Fed aggressively raised interest rates in 2022, this has also created unintended consequences. The collapse of SIVB. While SIVB’s demise seems not to pose a systemic financial risk at the moment.  Its overnight collapse is a reminder that the banking sector remains vulnerable to sharply rising funding costs after years of operating in a low rate environment.

SIVB’s demise has been well covered in the financial press, we’ll touch upon some salient details. There were red flags, a couple that were somewhat unique to SIVB.

  • Greg Becker, SIVB’S former CEO, served on the board of the Federal Reserve Bank of San Francisco until the day of the collapse. He had lobbied that that banks of SIVB’s size should not be subject to as much regulation as the mega banks
  • In 2018, a bipartisan bill was passed that exempted banks with $100 billion to $250 billion in assets – Silicon Valley's size – from requirements that included regular examinations of how they would fare in tough economic times, known as 'stress tests.'. The 2018 law also provided the Fed with more discretion in its bank oversight. The central bank subsequently voted to further reduce regulation for banks the size of Silicon Valley. In October 2019, the Fed voted to effectively reduce the capital those banks had to hold in reserve.
  • The bank had grown rapidly. Its assets quadrupled in five years to $209 billion, making it the 16th-largest bank in the country. And roughly 94 percent of its deposits were uninsured because they exceeded the Federal Deposit Insurance Corporation's $250,000 insurance cap. That percentage was the second highest among banks with more than $50 billion in assets, according to ratings agency S&P. Signature had the fourth-highest percentage of uninsured deposits – which uncoincidentally also failed. Signature had large exposure to crypto clients.  
  • According to analysis done by UBS. SIVB had 52% of its deposits from venture capital and private equity related businesses and funds.  First Republic Bank, another California-based lender that dropped more than 60% in pre-market trading on Monday, only 8% of its deposits to those types of clients.

Ultimately SIVB’s risk management, or the lack-thereof, proved it’s undoing. It’s not uncommon for banks to have unrealized losses due to their bond holdings. According to Bloomberg,  US banks had booked $620 billion in unrealized losses on their available-for-sale and held-to-maturity portfolios at the end of last year, according to filings with the FDIC. But SIVB’s investment portfolio had swelled to 57% of its total assets. No other competitor among 74 major US banks had more than 42%. It was this toxic brew of a very large unrealized losses on Treasuries and mortgage bonds combined with a concentrated depositor base that proved fatal.

This was exacerbated by SIVB’s failure to hedge the interest rate risk on these holdings and an upcoming  credit downgrade. Once it was made known to the market that SIVB may raise equity to pre-empt the downgrade, this was the catalyst for deposits to be withdrawn which worsened their credit standing. It became a self-fulling prophecy.

So as technology focused investors, how do we assess the current situation?

Let’s start with the macro. I have written extensively on concerns over the broad market from both a technical and macro perspective. The latter namely due to the Fed’s inability to combat super-core inflation and the over-leveraged consumer. I and the rest of the team have been monitoring for further signs of weakness.

Financial Sector Earnings

Within the overall S&P 500 earnings, it is estimated that Technology contributes the most at about 25%, while the second largest is Financials at 19%. The S&P 500’s decline in the SPX has in part been driven by reductions in earnings for the Technology sector. The SIVB fallout could lead to  a reduction in earnings estimates across the financial sector. These downgrades can be driven by a number of factors such as lending margins being squeezed as cost of bank deposits are still catching up with rate rises that have already happened, higher regulatory costs and higher loan loss provisions, just to name a few. This could be another headwind for S&P 500 earnings in the future.

Banks are a transmission mechanism for the economy. To the extent that is hindered, there will be a negative trickle down effect for the economy that are yet to be seen.  Somewhat ironically, the SIVB collapse may help Fed Chairman Powell’s goal to reduce supercore inflation driven by the sticky services component through aggressive interest rate hikes. Albeit clearly not the way he intended.

Technically, the Financials ETF has broken down.

What will the Fed do in the next meeting?

Given the recent CPI data, the Fed has every justification to continue to raise interest rates, which we discussed here. However, will the SIVB failure give them a reason to pause? The futures market has the odds at a resounding no.

And the reason is that under the headline CPI number, we are seeing the 2nd month in a row of 3 MoM annualized acceleration. If you combine the prior 3 months and annualized them, the number comes out to 4.08%, compared to last month’s reading at 3.4%. Furthermore, energy, goods, core, shelter and services all showed similar accelerations.

How to invest in technology in current environment?

In the public markets, the technology sector was already facing headwinds as higher rates impacted valuation. Meanwhile those with consumer exposed businesses have also had earnings impacted. The SIVB fallout adds additional headwinds. SVB’s demise has revealed the extent of the damage rising interest rates might cause on companies and banks that had grown accustomed to years of cheap money. Startups are especially vulnerable to any systemic drop in confidence, given their reliance on investors’ faith in their long-term potential when profitability might be years away.

Private markets will face a tougher funding environment. There is a talk of ‘day-of-reckoning’ for the private equity/venture capital-funded universe and may force PE funds to mark down private books sooner than they’d like to.

Softbank is a good public and sentiment proxy for the private markets. Before the meltdown, Masayoshi Son’s investment powerhouse — which has poured more than $140 billion into names from WeWork to ByteDance Ltd. and DoorDash Inc. — had already been reeling from the post-pandemic economic downturn.

SoftBank, similarly central to the global VC arena, has lost around 7% or $5 billion of its value since news of SVB’s difficulties emerged. Its credit default swaps are surging for the second straight day, and speculation is growing on what asset sales might be ahead should SoftBank need to help out portfolio companies.

SoftBank sees little impact from SVB’s failure on its portfolio companies, a SoftBank spokesperson said, adding that the company expects no impact on its own finances. Most Vision Fund portfolio companies are cash-rich, the company said during its earnings call last month. However, if we look at the chart, the market disagrees, as it is ~63% off its 2021 high, and only ~32% from testing its COVID low.

Attributes of stocks that we are looking for

This past week, I/O Fund analysts held a webinar that discussed “How to Build a Defensible Tech Portfolio.”  Although macro continues to throw curveballs, we believe a defensible portfolio can help alleviate any concerns.

Defensible means the portfolio should be overweight the bottom line. For tech investors, stocks that do not materially cash burn are ideal right now. Per Silicon Valley Bank’s CEO Gregory Becker: “While VC (venture capital) deployment has tracked our expectations, client cash burn has remained elevated and increased further in February, resulting in lower deposits than forecasted.”

Per the same Reuters report, Silicon Valley Bank is selling assets to position for higher interest rates and faster cash burn: “We are taking these actions because we expect continued higher interest rates, pressured public and private markets, and elevated cash burn levels from our clients.”

Elevated cash burn is something the public markets will be very sensitive toward into the foreseeable future. We have found that expanding operating margins and GAAP profitability was rewarded last year, and we believe this is the best way to position for an unpredictable 2023. At the very least, while the FED raises rates, cash burn will continue and we believe it will surprise investors at times just how cash strapped the tech sector truly is. This is why we have built a defensible tech portfolio, as outlined in this webinar here.

Posted in Finance, Financial Analysis, InflationLeave a Comment on SIVB: Unintended Consequences

The Importance of Verified Returns and Risk Management for Retail Investors

Posted on March 12, 2023June 30, 2026 by io-fund
The Importance of Verified Returns and Risk Management for Retail Investors

2022 was rough — so rough it marks the greatest destruction of wealth in modern history with an estimated $57.8 trillion lost across all asset classes combined.

We’ve been accustomed to believe the inverse correlation to equities and bonds is universal. Since 1998, this relationship has held true, offering investors safety in bear markets with a rotation into bonds. This was not the case in 2022, as heightened inflation brought on a bear market in both asset classes.

According to a write-up by the Syz Group, 2022 smashed many records, including the only year in history in which both the S&P500 and the US 10-year Treasury bonds were down more than 10% each.

Drawdown in total market capitalization graph

Certainly, if smart money struggled this much then so did retail investors. In fact, retail investors typically take the brunt of the losses in the stock market. According to a professor at the University of Oxford, “retail investors will always lose money because they lack the ‘education’ whereas financial professionals are well informed – that’s what they do.”

That’s a hard pill to swallow as retail investor communities swelled to a size not previously seen prior to Covid. Retail investors previously made up 10% to 15% of the market and now make up 25% of the market, according to Bloomberg Intelligence.

Note: For a Limited Time, I/O FundNote: For a Limited Time, I/O Fund is offering a $99/year Premium Newsletter plan that provides one actionable stock tip per month and analysis from a top performing, audited team. Click here for more detailsis offering a $99/year Premium Newsletter plan that provides one actionable stock tip per month and analysis from a top performing, audited team. Click here for more details

This means the retail community was growing at the exact point in history that this investor type was most likely to get hurt in late 2021 and throughout 2022. According to Goldman Sachs, “retail net selling activity has accelerated over the past six months. In aggregate, selling over the past eleven months has completely reversed all the net buying in single stocks from 2019 to 2021.”

S&P500 and NDX 100 stocks sold from 2019-2021

According to Goldman Sachs, retail investors have sold 1.5 times the amount accumulated in NDX 100 stocks, which indicates not only a complete reversal, but a complete reversal coupled with a steep loss.

Volatility is Driven by Machines

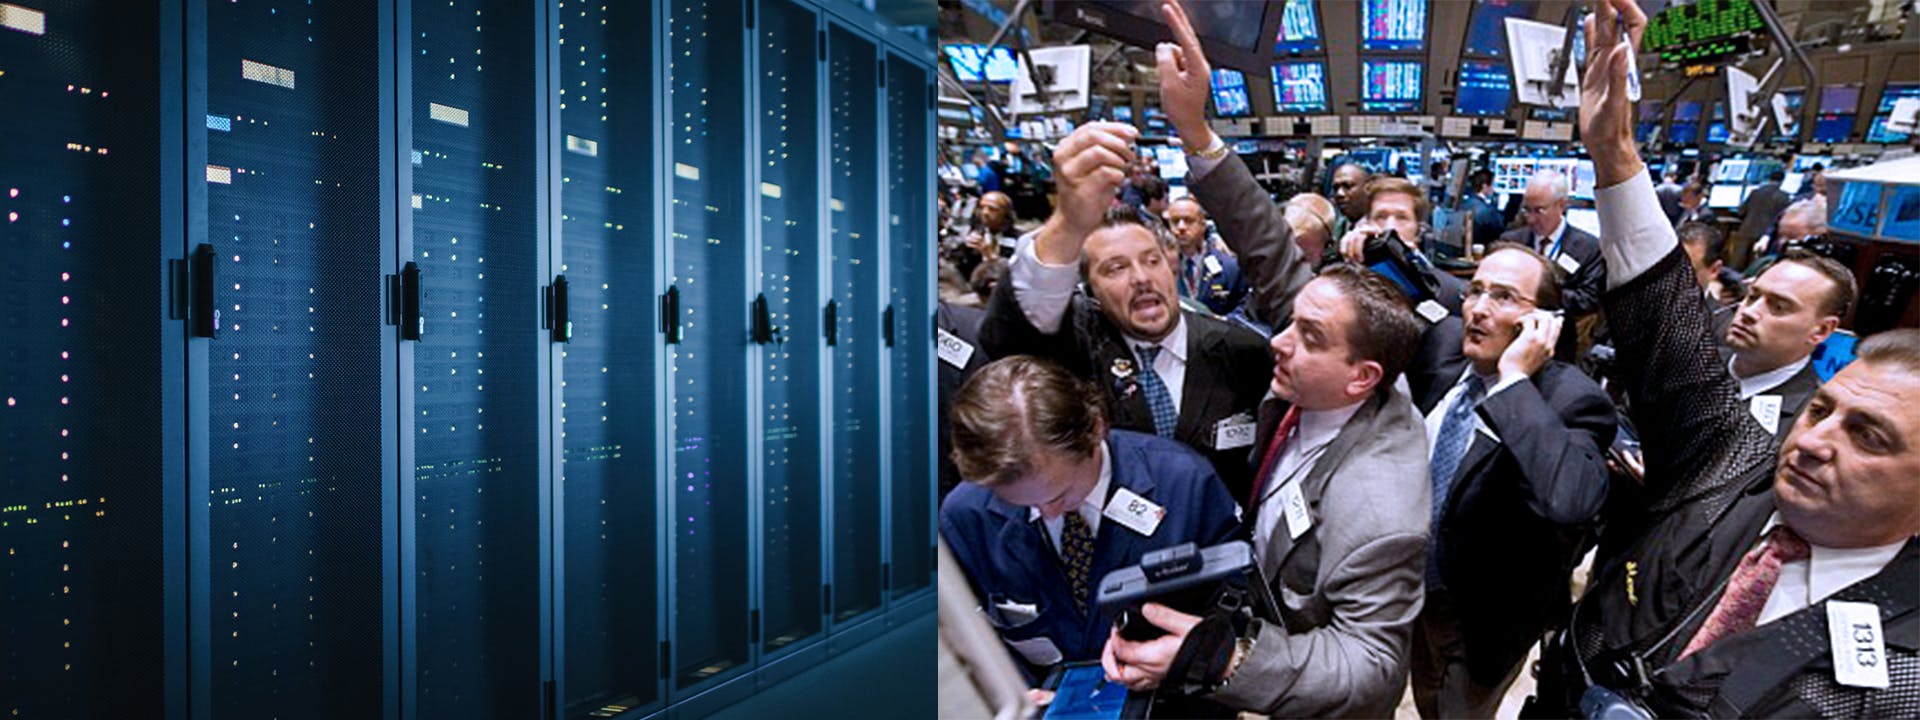
One of the primary culprits to the extreme volatility seen in recent years is caused by algorithms. Most newer investors envision a stock trading floor where market makers assist in trading stocks. The reality could not be further from the truth. In fact, those pictures of stock traders on the New York Stock Exchange floor are entirely for appearances. To truly envision how the stock market works, a more accurate picture would be of a colocation data center stacked with servers.

Data center and NYSE traders

It’s true that quantitative easing caused too much liquidity, and in response, there was a knee-jerk reaction to quantitative tightening. However, it’s important to remember that machines were breaking records in both directions at the height of QE, as well. 

Here’s an excerpt from an editorial I wrote in 2020 when the market was seeing a record number of  limit up and limit down days:

“Nearly a decade ago, there was a flash crash that occurred on May 6, 2010. This “flash crash” caused the Dow Jones to drop 998.5 points (about 9%) within minutes, only to recover a large part of the crash later in the day. According to the Commodity Futures Trading Commission (CFTC), high frequency trading “did not cause the Flash Crash, but contributed to it by demanding immediacy ahead of other market participants.”

Flash crashes and flash rallies of 1000 points are now the new normal with sixteen occurring since March 1st. Four of these historical daily gains were above 9%. Trading curbs, known has circuit breakers, were hit four times last month.”

The editorial also discussed the prevalence of a “man plus machine” approach or woman plus machine:

“During the Q4 2018 sell-off, Guy De Blonay, a fund manager at Jupiter Asset Management stated 80% of the stock market is controlled by machines. In 2017, JP Morgan stated that “fundamental discretionary traders” accounted for only 10 percent of stock trading volume.

Billionaire Steven A Cohen’s hedge fund had to focus more on quant trading in 2017 when it lost money in most of its traditional trading strategies in that year, while its quant investors made money. For example, Steven Cohen’s $12-billion hedge fund, Point 72 Asset Management, is moving about half of its portfolio managers to a “man plus machine” approach.

According to Wells Fargo, robots will replace 200,000 banking jobs over the next 10 years. Citigroup has formed a lab to cross-train traders and developers for machine learning and artificial intelligence. The programming language, Python, is especially in high demand at leading banks, such as JP Morgan and Goldman Sachs.”

This creates a serious disadvantage for retail investors and those who do not have a team of Python developers to leverage quant systems that trade in a blink of an eye. Ray Dalio, the fund manager for Bridgestone, has openly discussed that the best approach to the modern-day stock market is what he calls “the man and machine.” His firm has 1,500-employees that use computer models to test hypotheses; which is just one of the many advantages hedge funds and institutions have over retailers.

According to Dalio, the ideal is to have an algorithm work alongside a portfolio manager for a customized approach to predicting the markets. Although the I/O Fund does not have a team of Python developers, this year we partnered with Vincent Duchaine of WealthUmbrella  in order to close the gap between human-driven actions and emotionless machines. This marked an important turnaround for our firm as we gave up what I would call “retail idealism” which centers around the idea that holding a stock for a long period of time is retail’s only defense. This works during times of economic expansion, but where this can go (horribly) wrong is when a new, more challenging macro can change the outlook for any given company.

Note: For a Limited Time, I/O FundNote: For a Limited Time, I/O Fund is offering a $99/year Premium Newsletter plan that provides one actionable stock tip per month and analysis from a top performing, audited team. Click here for more detailsis offering a $99/year Premium Newsletter plan that provides one actionable stock tip per month and analysis from a top performing, audited team. Click here for more details

For example, the cloud sector is a favorite among retail investors yet has not been through a period of quantitative tightening. Most cloud companies were founded in 2010 or later, when funding was easy to secure. It did not matter if these companies were cash efficient or not, as the past decade has been marked with cheap money with over a decade of the Fed Funds rate at or near zero.

For our premium members, I wrote an earnings report in August on two stocks that were brutally beaten up entitled “It’s the Economy Stupid.” The analysis asked an important question: are these stocks down as a result of poor management, something unique in their financial profile — or because a weak economy is simply too hard to contend with?

Although retail investors were busy pointing fingers at specific stocks, if it was the latter, then all consumer stocks would eventually be affected. Fast-forward, and hundreds of tech stocks finished down 70%, and nearly every tech stock finished down 50%. This includes the indestructible FAANGs, with many trading at historic low valuations. In 2022, an investor would have to be in denial to focus on the poor performance of an individual company rather than acknowledge something much bigger was going on.

The point was to encourage our readers to let go of the idea that picking good stocks could save a portfolio in the tech industry and to instead fully embrace risk management tools.

Risk Management Tools

In April of 2022, the I/O Fund stopped relying on stock picks as the primary, offensive measure because this approach simply was not working in the new macro. After partnering with Wealth Umbrella on an automated hedge, the I/O Fund began to boldly hedge up to 100% of our portfolio, at times.

We pivoted to playing defense rather than offense. Those who watch team sports will understand this transition well, as the strategy changes from attempting to make money (or make a goal) to a strategy that prevents losses (or prevents a goal).

The first four to five months weighed on our returns, yet our portfolio performance in 2022 stands apart from all-tech portfolios that only played offense. In addition to being evident in our soon-to-be published performance results, we also believe the positive effects of this pivot toward playing defense will be seen throughout 2023 and onward. 

Unlike many other all-tech portfolios and ETFs, we believe a more active stance is necessary for long-term tech investing. We also believe that the easy years of buy and hold are over, marked by the great growth cycle post-GFC, and that a more active approach will be necessary to survive, and even profit. As a result, we rotate our portfolio frequently, raise cash and actively hedge our portfolio with an automated signal.

In addition to hedging, real-time trade alerts are sent to our members the minute the hedge is on, or is turned off, or when the allocation changes in terms of percentages, such as 25% of our portfolio value, to 50% of our portfolio value, to 75% and so on.

Please reference “The Best of I/O Fund’s Newsletter in 2022” for More Information on Analysis the I/O Fund published last year relating to Technicals and the hedge and a few fundamental calls, as well.

For those who may not be aware, this is extremely challengingextremely challenging to do as it combines the two most advanced forms of portfolio management.

  1. One of the most advanced forms of portfolio management is real-time trade alerts. This places immense pressure on a portfolio manager as the stakes are high to record what you do every second in real-time. To voluntarily choose to have the highest level of accountability in retail is nearly unheard of, yet registered fund managers are required to do this and file their stock trades.
  2. Secondly, hedging up to 100% of a portfolio is also a large psychological hurdle, and  traditionally a risky one. Markets spend the vast majority of their history in uptrends, for one. Secondly, the amount you can lose on a short is literally infinite, to where one’s downside risk is capped at 0 on the long side. To overcome these hurdles, we have spent considerable resources developing a “man and machine” signal with the help of Wealth Umbrella that is truly state of the art.

It’s only natural for retail services to want to ease the pressure of having to report in real-time. The stakes are much higher when what you do is recorded the minute the action is taken, but overall, having the highest level of accountability possible has made the I/O Fund much sharper investors.

Logging trades in real-time also places immense pressure on the analysts at the I/O Fund, as well, who are not allowed to simply choose a stock but must also determine the allocation for the stock. After recommending a stock, the analysts must help the portfolio manager actively manage the position, which can change at any time.

There is a reason most services do provide this level of transparency and activity. The more granularity that is offered, the more skill is required. Also, compare this to social media, where some investors will casually claim trades that were not logged in real-time.

Verified Returns

In addition to a lack of risk management tools, I believe a lack of verified returns in the retail space contributes to the losses this investor type experiences. Smart money is careful about who they consider a good investor — they do not take someone’s word they are a good investor; they make the investors or firms they follow prove it. Every single hedge fund has to report their returns, which reduces the chances of posturing.

Retail is not offered these checks and balances, and instead, this investor type follows many influencers and research sites who verbally state their performance without proper verification. Across the board, retail is offered a very low amount of accountability – this includes unverified month-end reviews, a list of stock tickers, unchecked screenshots, or other methods that are easy to manipulate. This widespread acceptance of loosely stating a stock performance is odd, to say the least, considering the finance industry is more inclined than any other industry toward deceptive practices.

How the I/O Fund Sets a High Bar for Accountability

Over the past three years, the I/O Fund has invested over $130,000 into accountability and transparency for our Members. When we launched in July of 2019, for the first year or so, we used a forum hosted by Tribe for our trade alerts, but by January of 2021, we had migrated to SMS and email tools that were the least likely to experience an outage for our real-time trade alerts. This costs us $40,000 per year.

In addition to this, we use an auditor from a large firm in San Francisco to mathematically review and verify the performance of our I/O Fund portfolio trading account and crypto account. The process is quite extensive and it takes up to four months to complete. This costs $4,500 per audit and we’ve completed four audits for a total of $18,000 spent on this process.

Note: For a Limited Time, I/O Fund is offering a $99/year Premium Newsletter plan that provides one actionable stock tip per month and analysis from a top performing, audited team. Click here for more detailsNote: For a Limited Time, I/O Fund is offering a $99/year Premium Newsletter plan that provides one actionable stock tip per month and analysis from a top performing, audited team. Click here for more details

Here are some things we could have done with $130,000 instead of being the only retail site to provide checks and balances to this extent:

  • Bought two Tesla Model Y SUVs and painted them with our logo (or even three Model Ys with the new tax credit)
  • Traveled the world for a year, all expenses paid, and instead, sent our members a picture from a Gondola in Venice
  • Bought a small yacht and sailed the beautiful Bay, and sent our members kitesurfing pictures

Joking aside, accountability is expensive but we feel it’s worth it.

Conclusion

I believe real investors take necessary steps to prove their returns, that they accept the pressure that comes with registering trades in real-time and that they do not expect anyone, under any circumstances, to lower their standards and accept an unverified number in regard to portfolio performance. Due diligence on stocks requires scrutiny, and this same level of scrutiny should be applied to the company you keep in the finance industry. 

To put it simply, the I/O Fund was founded to bring the standards that smart money insists on to the retail investment class. We think retail will be empowered to outperform when their standards are higher on who they follow and what research they read, and when they refuse to accept a lower standard on transparency.

The I/O Fund is wrapping up our annual audit in the month of March, which is a month earlier than our audits were published in the past (you can access our previous audits including here and here and here). We look forward to adhering to the high standards that retail investors deserve. You can look forward to our 2022 performance being published by the end of this month.

Note: For a Limited Time, I/O FundNote: For a Limited Time, I/O Fund is offering a $99/year Premium Newsletter plan that provides one actionable stock tip per month and analysis from a top performing, audited team. Click here for more detailsis offering a $99/year Premium Newsletter plan that provides one actionable stock tip per month and analysis from a top performing, audited team. Click here for more details

The I/O Fund is a publishing company. The analysis, strategies, reports, activity and all other features of our service is provided for informational and educational purposes only, and should not be construed as personalized investment advice. Hedging is an advanced method of trading stocks, sudden losses can occur, and hedging should only be pursued under the supervision of your personal financial advisor.

Posted in Finance, Financial AnalysisLeave a Comment on The Importance of Verified Returns and Risk Management for Retail Investors

Broad Market Update: The FED versus Inflation

Posted on September 30, 2022June 30, 2026 by io-fund
Broad Market Update: The FED versus Inflation

Given the extreme FED action this year that has gnarled the stock market, I think it’s important for investors to look at how we got here to draw conclusions on what may be coming down the line. For brevity, we begin the discussion dating back one year.

In September of 2021, the FOMC decided to keep the Fed Funds rate at 0% and continue their asset purchasing at a regular interval, maintaining a loose policy as a result of the COVID panic. They reiterated rapid growth of the economy into 2022, while most members saw no need for a rate hike in 2022. Some members disagreed that a new tightening cycle would need to be started in 2022, but it was believed that it could be at a slow and tapered pace.

Interestingly, real-time market data related to inflation was flashing signs that inflation was becoming a concern. Here are some examples of data points that contradicted the FOMC’s policy decision at the time:

  • The NAHB Index, which tracks the sentiment within the home builder’s sector, saw a 160% increase from the COVID low into the September meeting.
  • The Case-Shiller Home Price Index was showing a ~25% increase in nation-wide home prices. It further showed the highest YoY reading in its history in July with a greater than 20% increase.
  • The Bloomberg Commodity Index was up 64% since the COVID low into that September, 2021 meeting. This was the highest reading since July of 2015, and also marked one of the steepest increases in terms of rate of change in the Index’s history.
  • Crude oil was up 47% in 2021, going into the meeting. It was also well above the pre-COVID levels.
  • The M2 Money Supply was up around 35% since the COVID low going into the September meeting. The M2 layer of the money supply measures the amount of liquid cash in the system, and historically accounts for inflation within an economy.
  • The S&P 500 was up over 100% from the COVID low going into late September of 2021.

Even the monthly CPI data, which has a built-in lag to some of its metrics, was suggesting inflation was becoming a problem. In February of 2021, the YoY CPI print came in at 1.62%; one month later, it read 2.62%. In September of 2021, it was at 5.3%.

So, what happened, and how could a team of the brightest PHDs, Bankers and Financiers that makes up the Federal Open Market Committee (popularly known as the FED) miss the inflation signals and raise rates so late in the cycle?

The standard policy for central banks is that at the first sign of inflation, they begin a slow and steady pace of rate hikes. For example, in 2004, the FED began their tightening cycle once the YoY CPI print exceeded 3%; in 1999, they began to slowly tighten once it moved above 2%. Even the current Fed Chair, Jerome Powell, started hiking rates in 2017 with inflation around 1%.

In our August webinar, ”This is Still a Warning Sign,” we warned that market risk was high, and that a sharp pullback was ahead. I also mentioned the market was setting up for a reversal going into the CPI print in September, here. Follow me on YouTube here or sign up for the I/O Fund free newsletter to be emailed the weekly webinar.In our August webinar, ”This is Still a Warning Sign,” we warned that market risk was high, and that a sharp pullback was ahead. I also mentioned the market was setting up for a reversal going into the CPI print in September, here. Follow me on YouTube here or sign up for the I/O Fund free newsletter to be emailed the weekly webinar.This is Still a Warning Sign,” we warned that market risk was high, and that a sharp pullback was ahead. I also mentioned the market was setting up for a reversal going into the CPI print in September, here. Follow me on YouTube here or sign up for the I/O Fund free newsletter to be emailed the weekly webinar.

Despite the numerous market indicators pointing towards growing inflation pressures in September of 2021, the FOMC ignored the signs, and instead continue to press their loose monetary policies. They ultimately waited a year after inflation showed up to begin addressing it, putting them much farther behind the curve than investors are used to.

Just over one month after the September 2021 meeting, the FOMC was forced to reverse course. Marking the second sudden policy shift in Jerome Powell’s tenure. As we now know, inflation was not transitory, forcing the FOMC to embark on the steepest rate hike campaign since Paul Volker raised the Fed Funds rate to 20% from a 3-year average of 11.2%.

Rather than engineer a soft landing, the FED did the opposite by raising rates a year too late. What resulted was an aggressive increase and the worst stock market on record in nearly 50 years.

One year later – Inflation is Down, the FED is Up

Fast Forward one year into the recent September, 2022, FOMC meeting, and the same indicators were clearly showing a notable reduction with inflation…

1) Commodities have collapsed, and continue to push lower. Copper prices are down ~30% from their high, while lumber prices have fallen back to pre-COVID levels. Most importantly, Crude Oil is about 16% below its pre-Russia/Ukraine war level, as gas prices declined every day? for 98 consecutive days.

Crude Oil TradingView Chart

2)  Sales of existing homes in August declined 19.9% from August 2021. Furthermore, the Case-Shiller home Price Index showed the largest MoM decline in home prices since 2011.

Case-Shiller Composite 20 Home Price Index MoM Chart

3) The National Association of Home Builders (NAHB) Index fell for 9 consecutive months and is now below the 50. Anything below 50 is a contraction. The president of the NAHB, Jerry Howard, went as far to state that “we’ve given birth to a housing recession.”we’ve given birth to a housing recession.”

The last time we saw the NAHB Index below 50 was briefly around the COVID low and then again in 2014. In fact, the last 9 months saw the 3rd steepest % decline in the NAHB Index since 1990.

United States NAHB Housing Market Index TradingView Chart

4) The M2 money supply is one of the most important indicators of inflation, and is the layer of the money supply that tracks liquid money in bank deposits, CDs, Mutual Funds, etc. In other words, the money that is ready to be used in an economy. After seeing a 35% increase post-COVID, since February of 2022, the M2 money supply has been negative to flat.

Ultimately, inflation is a monetary phenomenon. The more money in the system chasing the same goods, inherently means goods will increase in price. Following the M2 money supply is the most effective way to track if inflation is growing or shrinking.

S&P GSCI Enhanced Commodity (^SECA) Level Chart

The list can be extended into Producer Price Indexes and Manufacturing Costs consistently surprising to the downside. Inflation data does not have a lag built into its calculations, and looks at real-time market information, is signaling a noticeable change in trend with inflation pressures. Yet, just like in 2021, the FOMC appears to have a disconnect between inflation and its policy, except in the opposite direction.

The market was expecting a 0.75% rate hike this round, which it got. What it was not expecting was for the FOMC to raise its target rate, extend the duration for rate cuts, and claim that inflation is still out of control. They further spooked the market by stating that more pain would be needed to bring inflation back to its 2% target. This was backed by lowering their economic growth forecasts for this year, down to 0.2% from 1.7% in 2022, and 1.2% from 1.7% for 2023.

This meeting caught the market by surprise, triggering a sell-off that has pushed the S&P 500 to new lows in just under 2 weeks. I provide weekly webinars that discuss what I/O Fund is buying and selling. We also have a proprietary hedging signal that we monitor in real-time. Following the free analysis, Why The Next 2 Weeks Could Determine The Rest Of 2022 Why The Next 2 Weeks Could Determine The Rest Of 2022 we hedged going into the CPI number for a nice gain in a tough market. That analysis dated September 8th stated:

“Historically, this grid tends to accompany the C wave down in a bear market. However, in 2022, the market exhibited a sell-now-and-ask-questions-later mentality, as we saw the S&P 500 decline by 24% and the NASDAQ-100 decline 34% over a 5.5 month period. These are rare moves, and one has to wonder if the worst is priced in – including the global slowdown in growth? I do believe it’s cavalier to assume that at this point, and prefer to let the broad market prove it to me over the coming month. We will remain cautious until then, and respect the Big Risk-Off grid that we are now in.

If we have, in fact, found a meaningful low, we would not only need to see the S&P 500 give us that 5th wave up, but we would also need to see rates, the USD and oil move down or sideways. Bull markets do not happen in vacuums and tend to be supported by various markets firing in unison. As of today, this confluence of inter-market dynamics is not supporting a direct uptrend in equities.”

Just like in the September of 2021 meeting, the FED appears to be ignoring market signals about inflation. By ignoring the real-time market data regarding inflation, the markets will once again force their hand, as it always does. The only question remains is what will have to break before they flinch? As stated, we believe it is prudent to wait for the clear reversal before getting too aggressive in equities. This is why our service has hedged the majority of September with real-time trade alerts sent to our Members.

SPX Levels to Watch

The S&P 500 is tracing out what appears to be a 3-wave pattern down from the August high. This is important, because it is not suggesting an immediate breakdown from current levels. Instead, we are seeing extreme oversold conditions that tend to lead to a short-term bounce, at minimum.

S&P 500 tracing out what appears to be a 3-wave pattern

If the coming bounce can break above 3800, then a major low is likely developing. However, once SPX pushes into 3730, the risk will be elevated, as the above structure does not look complete until we get at least into the 3550 range.

To further support a bounce, today we saw the broad market make a new low; however, it did so with notable divergences. For one, the VIX did not make a new high, which tends to precede a turn. The market also went down with less stocks making new lows than last week’s low. This was met with the Advance Decline line also not making a new low with price. These are common signs we see prior to a turn.

On the I/O Fund premium site, I provide weekly webinars that discuss what the I/O Fund is buying and selling. We also have a proprietary hedging signal that we monitor in real-time. Following the analysis I provided for free on YouTube last month “This is Still a Warning Sign” and also in this article “Why the Next Two Weeks Could Determine 2022” we hedged going into the CPI number for a nice gain in a tough market and have had a hedge in place most of September.On the I/O Fund premium site, I provide weekly webinars that discuss what the I/O Fund is buying and selling. We also have a proprietary hedging signal that we monitor in real-time. Following the analysis I provided for free on YouTube last month “This is Still a Warning Sign” and also in this article “Why the Next Two Weeks Could Determine 2022” we hedged going into the CPI number for a nice gain in a tough market and have had a hedge in place most of September.I/O Fund premium site, I provide weekly webinars that discuss what the I/O Fund is buying and selling. We also have a proprietary hedging signal that we monitor in real-time. Following the analysis I provided for free on YouTube last month “This is Still a Warning Sign” and also in this article “Why the Next Two Weeks Could Determine 2022” we hedged going into the CPI number for a nice gain in a tough market and have had a hedge in place most of September.

The next premium webinar will be on Thursday, October 6th at 4:00 pm Eastern where I will discuss how I plan to trade the broad market signals discussed in this article plus new information on an important time factor in mid-October which I believe is lining up with the Q3 earnings season. Learn more about Premium I/O Fund Services here.The next premium webinar will be on Thursday, October 6th at 4:00 pm Eastern where I will discuss how I plan to trade the broad market signals discussed in this article plus new information on an important time factor in mid-October which I believe is lining up with the Q3 earnings season. Learn more about Premium I/O Fund Services here.Premium I/O Fund Services here.

Please note: The I/O Fund conducts research and draws conclusions for the Fund’s positions. We then share that information with our readers. This is not a guarantee of a stock’s performance. Please consult your personal financial advisor before buying any stock in the companies mentioned in this analysis.

Posted in Broad Market Today, Consumer, Finance, Inflation, Market TrendsLeave a Comment on Broad Market Update: The FED versus Inflation

DLocal: Strong Growth, Premium Valuation

Posted on June 17, 2022June 30, 2026 by io-fund
DLocal: Strong Growth, Premium Valuation

Fintech companies are disrupting the global economy with new and innovative products. Technological advancements have led to considerable investments in this sector and traditional finance companies have not been able to efficiently cater to changing business needs. Of the recent fintech quarterly earnings, D-Local stood out for its strong bottom line. The company’s cloud-based payment platform is popular in the emerging markets of Latin America, including Brazil, Argentina, Mexico, Colombia, Uruguay, and Chile. It allows international enterprises to operate in the emerging markets by using the company’s payment platform to receive and make payments, and comply with local regulations, taxes, foreign exchange, and fraud management. The payment service is used by companies such as Amazon, Microsoft, Didi, Mailchimp, Wix, Shopify, Wikimedia, etc.

DLocal released its Q1 2022 results last month. The company’s revenues grew by 117% year-over-year to $87.5 million. It beat the Wall Street revenue estimates by 5.9%. The company also reported a 30% net profit margin in the recent quarter. The solid top-line growth, earnings beat, and good profits sent the stock soaring 15% the following day of the announcement of the results.

Below, we discuss the market opportunity, the company’s background and a full financial picture on this hot fintech stock.

Market Opportunity

According to Vantage Market Research, the fintech market is expected to reach $332.5 billion by 2028 from $112.5 billion in 2021, growing at a compound annual growth rate (CAGR) of 20% from 2022 to 2028.

KPMG published a Pulse of Fintech H2’21 report suggests that the investment in the fintech sector was strong in 2021, and the trend is expected to continue in 2022. According to the report, the global fintech investment reached $210 billion in 2021. The payments category drew a record in venture capital funding. The report also highlights the record investment in emerging markets like Latin America and Africa.

Mike Louw, Partner, Head of M&A KPMG South Africa, said, “The northern hemisphere is a crowded marketplace and multiples are at an all-time high. This makes Africa an attractive alternative. Global PE firms and investors are seeing the opportunity. It’s put the continent on the fintech map.”

Ricardo Anhesini, Head of Financial Services, LATAM KPMG Brazil said, “The growth of fintech in Latin America is a classic example of ‘leapfrogging’ — fintechs have leveraged the need for financial inclusion amongst large swathes of the population to move straight to a new generation of services.”

Company Overview and product niche

The company was founded in 2016 in Uruguay. The shares were listed on the Nasdaq stock exchange in June 2021. Through its single API, technology platform, and a single contract, the company helps global enterprise merchants to be paid (pay-in) and make payments (pay-out) in the countries it operates. The company’s cloud-based platform can make cross borders and local payments in 37 countries while enabling global merchants to connect to over 700 local payment methods.

The company’s Marketplace payments solutions allow its sellers to receive payments in the local payment methods through credit or debit cards, bank transfers, and cash. The company makes it easier for global enterprises to operate in the region by partnering with a local payment platform by saving the hassle of complex regulations and solving difficulties that arise due to the lack of efficient banking facilities in these countries.

The company’s tie-up with alternative payment methods (APM) providers plays a role in the unbanked population. In Brazil alone, there were 34 million unbanked adults, according to a study by Instituto Locomotiva conducted in January 2021.

The company also cited in the F-1 the research from Americas Market Intelligence (AMI). In Brazil, domestic credit cards constituted 55% of the total e-commerce payment volumes, followed by alternative payment methods at 21%, cash at 14%, and the rest 10% of international credit cards. It highlights why the company has been popular in emerging markets and can easily bridge a gap in places with a high percentage of cash transactions and consumers using local payment providers.

Sign up for I/O Fund's free newsletter with gains of up to 403% – Click hereSign up for I/O Fund's free newsletter with gains of up to 403% – Click hereClick here

For example, one of Brazil’s popular alternative payment methods is Boleto Bancario. Boleto means a ticket with a due date and the amount to be paid. Previously, it was only cash, and now the payment can also be made through bank accounts or in various branches, post offices, and ATMs to use the goods and services. Boleto payments were typically confirmed in 2-3 days, however, this time is reduced to a few minutes through the company’s API’s. This shows how the company’s tie-ups with APM providers are successful.

The company has been a boon to global enterprises by solving the problem of dealing with tough regulations, tax complications, and fraud detection. The emerging markets are witnessing rapid e-commerce growth. Due to the under penetration of the digital economy, emerging markets are the hot spot for fintech companies.

Pay-In

The company’s pay-in solution helps merchants to offer services and receive payments in various payment methods like international and local cards, bank transfers, cash, and other alternative payment methods. Examples include: Microsoft sells its products in Nigeria and can accept payments from local payment providers. Due to the company’s single API they can easily expand to all countries where DLocal operates.

Pay-Out

The company’s pay-out solution facilities global companies to make payments in the countries in which DLocal operates. The company ensures that the payments are to the registered bank accounts of the users in accordance to the regulatory requirements. For example, Ride-hailing companies can make secure payments to their drivers in the emerging markets through the DLocal platform.

Marketplaces

Marketplaces allow sellers to sell internationally and receive money in their local currency. For example, in many cases, international sellers will not be able to sell in emerging markets since they will not have local bank accounts to collect payments. In this case, the marketplace onboards the sellers as they need to comply with local regulations and DLocal will facilitate receiving the payment in the local country and then send money to the international sellers.

Financials

The company has delivered strong top-line growth with good profit margins. In the recent Q1 2022 results, revenue grew by 117% YoY to $87.5 million. It was the fifth consecutive quarter of triple-digit growth. While the triple-digit growth rate is not sustainable into the future, Wall Street analysts still expect strong revenue growth to continue as they forecast revenue to grow 74% in the next quarter, followed by 58% in Q3 and 59% in Q4.

For the full year 2021, revenue grew by 134% YoY to $244 million. Wall Street analysts expect revenue to grow 73% YoY to $422 million in 2022 and 52% YoY to $640 million in 2023.

Source: YCharts

The company earns revenues from fees charged to the merchants for payment processing services. The company’s total payment value (TPV) accelerated by 127% to $2.1 billion. The take rate was 4.2% in Q1 2022 quarter compared to 4.1% in Q4 2021 and 4.3% in Q1 2021. The formula for take rate is revenues/ total payment volume.

The company’s business is not dependent on a single industry and has a diversified base of more than ten business verticals. The company is also geographically diversified to over 37 countries which is positive.

The LatAm region revenue grew by 116% YoY to $78 million and accounted for 89% of the Q1 2022 revenue. The Asia Africa region’s revenue grew by 127% YoY to $10 million and accounted for the remaining 11%. The company expects the revenue share from Asia and the African region to gradually increase over a period of time as the company cross-sells to merchants that originally began their relationships in the Latin American area.

The company has been able to grow its revenues with its existing customers, which is demonstrated by the strong net retention rates (NRR). The NRR in the Q1 2022 was 190% compared to 198% in Q4 2021. The high NRR is not sustainable, and the management expects the NRR to be over 150% for the full year of 2022, which is still good.

Sign up for I/O Fund's free newsletter with gains of up to 403% – Click hereSign up for I/O Fund's free newsletter with gains of up to 403% – Click hereClick here

Sebastian Kanovich, CEO of the company said in the recent earnings call, “So we built the whole platform in local on the premise that it's one API, one contract and one platform for everything we do. So it's extremely simple for merchants to expand with us. That's the key driver behind our NRR. Merchants start with us in one geography, and they continue to move into other products and geographies without any friction. That's why you see us continue expanding geographically. We want to make sure we have more attachment.”

The company’s gross profits grew by 87% YoY to $43.6 million, with a gross profit margin of 49.8%. The company’s CFO, Diego Canay, said in the earnings call, “We continue to expand our gross profit and EBITDA. Starting with our gross profit, as we have mentioned in the past, our commercial focus is to increase our gross profit dollars per merchant. As a result, our gross profit continues to grow at a healthy rate.”

The company’s CEO also echoed a similar tone. He said, “When we ask our commercial teams and the way we incentivize them, it's purely on gross profit dollars to make sure that we are adding more dollars to [our] P&L.”

Source: YCharts

The company’s net profit came in at $26.3 million compared to $16.9 million for the same period last year. The net profit margin was 30% in Q1 2022, which is at the same level as the H2 2021 and lower than the 42% in Q1 2021.

The adjusted EBITDA margin was 38% in Q1 2022 compared to 38% in Q4 2021 and 44% in Q1 2021. The adjusted EBITDA margin was partly lower due to the higher share-based compensation in the recent quarter. However, the management is guiding an above 35% EBITDA margin for the full year, which is positive.

Risks:

The company’s revenue growth is slowing down from the triple-digit growth in the past five quarters is a risk to consider. The company’s costs have increased due to the return of in-person marketing and travel expenses.  Also, the stock is currently trading at a forward P/S ratio of 17. The high valuations are another risk to consider with rising interest rates and macro uncertainty.

Our firm tends to be wary of IPOs in general and we covered the risks associated to IPOs last year here. We are particularly sensitive to companies that go public with very high growth rates that decelerate quickly, in this case, DLocal will have decelerated by nearly 50% from 186% in Fiscal Q2 to 74%.

Conclusion

The company has demonstrated strong revenue growth with good profits. It has developed a niche in the fast-growing emerging markets. However, considering the current macro uncertainty and the risks mentioned above, we are not interested to buying the stock at the current levels.

Please note: The I/O Fund conducts research and draws conclusions for the company’s portfolio. We then share that information with our readers and offer real-time trade notifications. This is not a guarantee of a stock’s performance and it is not financial advice. Please consult your personal financial advisor before buying any stock in the companies mentioned in this analysis. Beth Kindig and the I/O Fund do not own DLocal at time of writing and have no plans to enter the stock in the next 72 hours.

Posted in Finance, FinTech, SoftwareLeave a Comment on DLocal: Strong Growth, Premium Valuation

I/O Fund’s Fintech Q4 2021 Earnings Overview

Posted on February 11, 2022June 30, 2026 by io-fund
I/O Fund’s Fintech Q4 2021 Earnings Overview

Fintech companies aim to disrupt traditional finance and with our worlds increasingly going digital, it makes sense that traditional finance is also moving online. There are multiple different innovations that have taken place, from digital payments to using A.I. to better price credit risk.

We are in the middle of the Q4 fintech earnings period, and there have been a handful of fintech companies that have reported already, most notably PayPal. PayPal disappointed when its guide came in below expectations. The company cited weakness in lower income cohorts, and explained on its Q4 conference call that while spending was strong during the Q4 holiday season, it has since stagnated in 2022. This led the company to reduce its guide that it had originally issued in November.

This negative commentary was offset by Bill.com, which reported strong Q4 results, driven by strength in small and medium businesses. Bill.com reported its fourth consecutive quarter of accelerating topline growth, which suggests that SMB are performing strongly.

In the discussion that follows, I give an overview of the fintech space and outline key metrics that investors should be aware of heading into Q4 earnings.

Fintech: Top 10 EV/FWD Revenue Multiples

Below we ranked fintech stocks based on their EV/NTM sales multiples. Bill.com (BILL) ranks the highest, as the company has reported a series of strong results in recent quarters. For instance, sales have accelerated for four consecutive quarters, even after adjusting for acquisitions. As mentioned above, the company has done well with its primary cohort of small-medium businesses, suggesting that business activity continues to be robust beyond enterprises.

Global payment processors Visa (V) and Mastercard (MA) also sport premium multiples, likely due to their payment duopoly. However, it is noteworthy that Visa and Mastercard underperformed in 2021, as investors may be wary that the pair will be able to keep their relatively high fees. For example, Amazon has stopped accepting Visa credit cards in the U.K. over a dispute over payment fees. Amazon controls over 40% of e-commerce, so the ecommerce giant may be able to pressure the duopoly to reduce fees. 

Fintech: Top 10 Three-month Forward YoY Growth Rates

Below is a chart of fintech stocks that are expected to grow sales the fastest in the upcoming quarter. Looking forward, Upstart (UPST) is expected to grow sales 203% YoY in Q4, which is well above peers but slightly slower than its Q3 growth rate of 262%.  Upstart’s growth has benefitted from bank partnerships, which utilize Upstart’s AI-driven lending platform to originate loans. The company primarily originates personal and auto loans, which have seen strong growth in recent months. The New York Federal Reserve recently released its quarterly report on household debt and credit, which highlighted that Auto loans and personal loans were both up $15 billion sequentially and that delinquencies had also declined across the different loan categories, highlighting the favorable macro environment for Upstart.

Sign up for I/O Fund's free newsletter with gains of up to 1100% – Click hereSign up for I/O Fund's free newsletter with gains of up to 1100% – Click hereClick here

Coinbase (COIN) is also expected to grow over 200% in the upcoming quarter, as trading volume on the cryptocurrency exchange has exploded this year, with trading volumes up over 600% YoY to $327 billion in Q3 2021. Management guided for higher trading volumes in Q4 relative to Q3, driven by higher levels of volatility. Also noteworthy is Voyager (VYGVF), a cryptocurrency trading platform that is expected to grow sales over 3,000% YoY in the upcoming quarter. Voyager was excluded in the below chart for presentation reasons, because sales are growing off of a low base. However, sales are expected to grow 50% sequentially, highlighting the overall strength in cryptocurrency demand.

Top 10 Weekly Share Price Movements

Below is a table of the weekly change in share price for our universe of fintech stocks (as of 2/08). As mentioned above, Bill.com recently reported results and organic sales accelerated for the fourth consecutive quarter, leading to a rebound in its share price. However, Bill.com’s share price is still down year to date. In fact, most fintech stocks are down YTD, with the exception of Visa and Mastercard. Investors likely sold fast growing fintech companies in favor of ‘safer’ blue chip fintech stocks such as Visa and Mastercard. Nonetheless, fintech has started to rebound over the last week and Q4 earnings may be a further catalyst for a rebound in valuations.

Top 10 Changes in sales growth estimates – last 90 days

The table below ranks fintech stocks by their topline revisions over the last 90 days. An increase in topline revisions signals that the Street believes that the company will grow faster than initially believed, which can result in outperformance. Block Inc. (SQ) has had large revisions, in part due to its recent acquisition of BNPL platform Afterpay. Bill.com’s (BILL) guidance came in above expectations, leading to a higher sales estimate. It is noteworthy that Bill.com’s peer, Intuit (INTU), has also had its topline estimate increased by 5% over the last three-months. The QuickBooks software provider is likely benefitting from similar tailwinds as Bill.com, as SMB have performed well over the last few quarters.

Update on EV/Fwd revenue multiples:

Overall stats:

  • Overall fintech forward median:                4x
  • Top 5 fintech forward median:                   15x
  • Overall fintech forward average:               6x

EV/FWD SALES:

As shown below, the median and average fintech EV/NTM sales multiple had been relatively static throughout 2021 but has since compressed meaningful in 2022. Valuations are now below levels they were in 2020. The market may be fearing that consumer spending will decline due to a lack of stimulus and a slowing economy. With Q4 earnings on the horizon, new information could lead to a “risk-on” environment in fintech and a rebound in valuations.  

Top 5 EV/FWD SALES:

In the chart below, we can more clearly see the large dispersion in fintech valuations, as the top 5 premium valued fintech stocks have had their EV/Fwd sales multiples trend up throughout 2021 with a peak in October, followed by a general sell-off heading into 2022. Both the top 5 valued fintech stocks and the median sold off, which suggests that the sell-off was broad based and related to changing sentiment.

 EV TO FWD Sales Growth Buckets:

We can further dissect the change in fintech valuations by breaking up the group into high growth (>30%), mid growth (>15% and <30%) and low growth (<15%). The below chart shows the historical valuations for stocks in various growth buckets. Each growth bucket has had their valuations compress since November; however, the high-growth and low-growth buckets have underperformed the mid-growth bucket. The market is likely fleeing to ‘blue-chip’ fintech stocks until it receives more information on the general health of the consumer.  

Top EV TO FWD SALES:

The below chart provides a more holistic view of fintech valuations heading into Q4 earnings, sorted by EV to NTM revenue multiples. There is a wide disparity in valuations, with companies grouped closer to the tails rather than the median. As mentioned above, Bill.com (BILL) has a premium valuation and has already reported Q4 results, which surprised to the upside. PayPal (PYPL) has fallen below the median fintech valuation based on NTM sales after its Q4 results disappointed, as management explained that spending on its platform had slowed after the holiday shopping season. 

Growth adjusted EV/Fwd Revenue (EV/Fwd Rev/Fwd Growth)

The last chart is based on EV to FWD sales but also takes into account forward growth expectations. By scaling valuation relative to forward growth, we can more clearly see which companies are cheapest relative to forward growth. Companies with negative growth expectations are excluded from the below chart. A low value in the below chart means that a company is cheap relative to growth. It is interesting to note that PayPal (PYPL) rises to a relative premium valuation after considering its forward growth. On the other hand, DLocal (DLO) falls closer to the median valuation once we consider its 112% expected growth rate heading into Q4 earnings.

Finally, the last table we will be discussing includes aggregate fintech operating metrics. The below table illustrates the median topline growth, margins and FCF generation for the fintech industry. The median growth rate was 60%, and the market expects the median fintech stock to grow sales by 42% YoY next quarter. Median gross margins were 54% and the median free cash flow margin was 9%.

As shown above, the overall fintech space appears to be healthy, with high growth rates and strong margins. This provides support for a rebound in valuations heading into Q4 earnings. The I/O fund will be watching this industry closely heading into Q4 earnings. Find out what the Street is saying about fintech stocks headed into Q4 earnings in our I/O Fund’s preview of 7 Fintech stocks for Q4 Earnings.

The I/O Fund is a team of analysts that share their research publicly as they build a portfolio of 30 stocks. Our team has record results for a retail Fund and we also have four-digit gains on some of our free newsletter coverage. You can learn more about our premium service by clicking here or sign up for our free newsletter here.by clicking here or sign up for our free newsletter here.

Disclaimer: This is not financial advice. Please consult with your financial advisor in regards to any stocks you buy.

Posted in Finance, Financial Analysis, FinTechLeave a Comment on I/O Fund’s Fintech Q4 2021 Earnings Overview

I/O Fund’s preview of 7 Fintech stocks for Q4 Earnings

Posted on February 11, 2022June 30, 2026 by io-fund
I/O Fund’s preview of 7 Fintech stocks for Q4 Earnings

Fintech companies are disrupting the global economy with their innovative products. The global growth is expected to continue despite medium-term challenges like higher interest rates and Covid-19. We believe that the recent sell-off once again provides opportunities to pick stocks for the long term.

PayPal released its results earlier this month. Q4 revenue grew by 13% to $6.9 billion and beat estimates marginally by $30 million. The soft revenue guidance of 6% growth in Q1 disappointed investors. On the other hand, Dutch payment processor Adyen reported strong results as its 2H revenue grew by 47% to €556.5 million and EBITDA (Earnings before Interest, Tax, Depreciation, and Amortization) grew by 51% to €357.3 million.

In this earnings preview, we cover Upstart, Block, Coinbase, Sea Limited, MercadoLibre, Remitly, and DLocal. To understand valuations across the Fintech companies and how the sector is positioned moving into earnings, please refer to our analysis, “I/O Fund’s Fintech Q4 Earnings Overview.”

Upstart – Earnings on February 15th

Source: YCharts, Earnings Reports, and I/O Fund

The company’s revenue grew by 250% in Q3 and the analysts estimate revenue to grow 203% YoY to $262.85 million. Upstart has gained popularity due to its Artificial Intelligence lending platform, which saves time in loan processing. The management believes that the auto lending market is at least six times the personal loan market size and that customers pay higher interest rates for car loans. Last year, it bought Prodigy Software, an automotive retail software provider, which further helped the company focus on the auto loan market.

Atlantic analyst Simon Clinch has a price target of $170. He has an overweight rating on the stock as he believes that there is upside potential to EBITDA from the auto segment.

Piper Sandler analyst Arvind Ramnani has lowered the price target for the company to $223 from $300. He reset the price target in the vertical software and fintech stocks following the correction in the tech sector.             

Block (Square) Inc – Earnings on February 24th

Source: YCharts, Earnings Reports, and I/O Fund

The company’s revenue grew 27% YoY to $3.84 billion. Analysts expect revenue to grow 28% to $4.05 billion. The company missed analysts’ revenue estimates by 14% and adjusted EPS by 3% in the last quarter.

It has completed the acquisition of Afterpay recently and has integrated Afterpay’s Buy Now Pay Later (BNPL) functionality to Square Online sellers in the U.S. and Australia. According to Grand View Research, the BNPL market is expected to reach $20.4 billion by 2028, growing at a compound annual growth rate of 22% from 2021 to 2028.

J.P. Morgan analyst Tien-tsin-Huang is optimistic about the deal and expects it to boost its gross profits. He also believes, "positive catalysts de-risking the hard/soft landing concern for stand-alone Cash App growth deceleration near-term."

Barclays analyst Ramsey El-Assal has lowered the firm's price target to $205 from $300. He has kept an Overweight rating on the shares. In his view, “While app download and usage data point to continued strength at Cash App and Square, the company continues to lap very tough COVID-related comps.” He also expects investor focus to be on the reacceleration of Cash App, the Afterpay acquisition, and Block's crypto initiatives.

Please note that the I/O Fund may or may not agree with the above financial analysts, yet we objectively report what the Street is saying. You may view our previous analysis of the company below:

Our lead analyst Beth Kindig had discussed two years back about the company’s high charges that would come under pressure from the blockchain in the long-term. Recently, she also discussed that the company’s name change from Square to Block was a defensive move rather than coming out of its strength.

Coinbase Global Inc – Earnings on February 24th

Source: YCharts, Earnings Reports, and I/O Fund

The company’s revenue grew by 316% to $1.31 billion in Q3. For Q4, analysts expect revenue to grow 235% to $1.96 billion. Due to better trading activity in October, the management believes that the retail Monthly Transacting Users (MTUs) will be higher in Q4 than Q3. For the month of October, it was 11.7 million.

Bank of America analyst Jason Kupferberg has upgraded the company from a neutral to buy rating. He is optimistic about the company launching the NFT trading platform, as it was diversifying its revenue sources to rely less on cryptocurrency trading.

Sign up for I/O Fund's free newsletter with gains of up to 1100% – Click hereSign up for I/O Fund's free newsletter with gains of up to 1100% – Click hereClick here

Mizuho analyst Dan Dolev believes that the zero-commission business model adopted by Robinhood is better than the fee-based model adopted by Coinbase. In his words, "If you think about three years from now, everything that's fee-based right now, like crypto trading, is going to be free."

You may view our previous analysis of the company below. We had also discussed Coinbase reporting lower revenue in Q3.

Crypto Trading Apps Coinbase and Robinhood Will Decline in Q3 — but by How Much?

Why We’re Skipping Coinbase and Prefer Voyager Digital: Overview of Crypto Trading

Sea Limited – Tentative Earnings Date is 25th February

Source: Seeking Alpha, Earnings Reports, and I/O Fund

Sea Limited operates in three segments: digital entertainment, e-commerce, and digital payments & financial services. The company's revenue grew 122% in Q3 and the analysts expect revenue to grow 92% to $3.0 billion in Q4. The company derives its significant revenue from South East Asia, and more recently, it has been focussing on Latin America.

Barclays analyst Jiong Shao lowered the firm's price target to $218 from $427 and has kept an Overweight rating. He believes, “The post-COVID economic reopening is having a negative impact on both the company's gaming and e-commerce business as consumers spend less time online.”

Goldman Sachs analyst Miang Chuen Koh has removed the stock from the Goldman’s Conviction List. "While Sea (SE) remains on a growth path, with an expanding ecommerce footprint and its multiple studios finalizing games to be released in the next few quarters," the analyst cautions that the slower economic growth will limit the growth of its three business lines.

You may view our previous analysis of the company below.

Q1 Earnings Analysis for Etsy, Square, and Palantir

Momentum List: September 2020

MercadoLibre Inc – Tentative Earnings Date is March 01st

Source: YCharts, Earnings Reports, and I/O Fund

The company’s revenues grew 67% in Q3 and the analysts expect Q4 revenue to grow 53% to $2.03 billion. MercadoLibre has been popularly known as the Amazon of Latin America. The company is benefitting from the region’s strong e-commerce and fintech growth. The stock rose about 450% in the past five years. MELI’s quarterly active users showed strong growth in Q3, growing 50% YoY to 78.7 million and unique Fintech users grew by 13% to 31.6 million.

Source: YCharts

Stifel analyst Scott Devitt lowered the price target on the company to $1,600 from $2,200 and has kept the Buy rating. He forecast GMV growth of 26% to $7.71 billion and revenue estimate of $2.09 billion for the next quarter, slightly ahead of consensus. However, as the comparable valuation multiples of the company's publicly traded peers have declined, he has lowered his price target.

Jefferies analyst John Colantuoni has downgraded the company to Hold from Buy with a price target of $1,250, down from $2,000. He makes a note that the heightened macro uncertainty in Brazil, which represents 60% of the company's revenue, could hold back MercadoLibre's near-term valuation. He believes that the company is in an ideal position to benefit over the long-term from attractive secular shifts in e-commerce and payments across Latin America and expects the stock to trade at the low end of its historical trading range until macro uncertainty subsides.

Remitly Global Inc – Earnings Date not released yet

Source: YCharts, Earnings Report, and I/O Fund

Global remittance provider Remitly’s Q3 revenue grew by 69%. It was the first earnings report since it became a public company in September 2021. The full lock-up expiry is expected next month. Active customers were up 51% and the average revenue per active customer was up 12% YoY to $47.34. Adjusted EBITDA came at $0.3 million compared to $0.6 million in the same period last year. The analysts expect revenue to grow 57% to $125.36 million in Q4. The management expects full-year revenue to grow about 74% YoY in the range of $445 million to $450 million.

JMP Securities analyst David Scharf has lowered the company’s price target to $40 from $52 and has kept the Outperform rating. The analyst remains positive on Remitly’s leadership position as a mobile-first, all-digital network serving a large and expanding total addressable market and believes that its secular tailwinds will continue. However, he cautions that the shares might be volatile in the near term due to the negative market sentiment.

DLocal Ltd – Tentative Earnings Date is February 28th

Source: YCharts, Earnings Report, and I/O Fund

The company’s revenue grew by 123% in Q3 and the analysts expect revenue to grow 115% to $74.52 million. The total payment value (TPV) increased by 217% in Q3 to $1.8 billion. The net revenue retention rate was 185%. The management expects NRR in the range of 150% to 160% in the medium term and to come down to about 120% to 130% in the long term.

Goldman Sachs analyst Tito Labarta has upgraded the company to Buy from Neutral and has a price target of $55. He believes that “The company should experience relatively minor impacts from higher interest rates considering that it has no debt on its balance sheet and does not focus on the pre-payment of receivables.”

The I/O Fund is a team of analysts who share their research publicly as they build a portfolio of 20 stocks. Our team has record results for a retail Fund and we also have four-digit gains on some of our free newsletter coverage. You can learn more about our premium service by clicking here or sign up for our free newsletter here.by clicking here or sign up for our free newsletter here.

Disclaimer: This is not financial advice. Please consult with your financial advisor in regards to any stocks you buy.

Posted in Finance, Financial Analysis, FinTechLeave a Comment on I/O Fund’s preview of 7 Fintech stocks for Q4 Earnings

1-Year and YTD Audited Returns for 2021

Posted on October 26, 2021June 30, 2026 by io-fund

The market certainly has a way of instilling humility. As the I/O Fund was logging on to the Performance Webinar to present industry-leading returns (and to declare that a Retail Fund was kicking Wall Street butt!), we were simultaneously experiencing our largest AH drop following an earnings report on Snap.

We already had slides prepared to discuss what losses mean for portfolio returns. The first point we had planned to discuss is that all portfolios with sizable returns have losses. Part of our service is to show you that we hold through losses OR we cut them if the story isn’t playing out as we had predicted. We are not only a site that celebrates the wins, but we also show you how we handle our losses.

When we compare our results to institutions who also specialize in tech, we see that the I/O Fund is able to hang with Ark Innovation in the good years and then handily beat Ark Innovation in the drawdowns (at least so far). We have healthy respect for Ark and we certainly admire the bold move ARKK made in highly-shorted Tesla. Morgan Stanley’s Inception Fund has better returns than Ark this year due to their bold move going into Gamestop. This leading fund is now neck-and-neck with I/O Fund.

The I/O Fund’s bold move was placing blockchain assets, such as Bitcoin, Chainlink and Ethereum, into a stock portfolio with a leading allocation (approx. 10%/5%/5%) and then weathering the extreme volatility by adding near bottoms and trimming near tops. We began the process of taking gains in crypto from February through early May. We then began to buy again in the $42,000 – $31,000 region. Blockchain has always had a place in our long-term buy and hold portfolio and we didn’t budge on this even with large drawdowns of 40-50% whether it was 2019, 2020 or 2021.

The semis have held up our portfolio well compared to other high-growth portfolios. Datadog and Asana were also impressive choices. We still have some high fliers that we are hoping end the year strong. These were mentioned in the LTBH Top 10, such as Xpeng, Fubo and Magnite. If two out of three rally, we will be doing well. Our momentum portfolio is finding its wings again with nice gains in Affirm and also AEHR. These last two came in Q3 and are not reflected in the performance below.

We think this proves our fluency with tech and our ability to broadly form a winning portfolio. The issue with most tech ETFs is they are sector-specific whereas blending many tech trends into one portfolio is more advanced and can offer higher returns.

View our Performance Review Webinar here.

Performance Review:

We launched our fund on May 9th, 2020 and our first performance was calculated between May 9th and December 31st of 2020 with returns of 115.5%.

We have two performance letters for you:

Our 1-year returns from May 9th through May 9th were 236%. Please note in the letter below, the accountant preferred to stop the 1-year performance at Friday May 7th, which designates the weekend when the market is closed. It doesn’t make sense to count gains in crypto which is open May 8 and May 9th 2021 but not count stocks. Therefore, performance for our portfolio ended on Friday May 7th since May 9th was a Sunday.

We also did a YTD from January 1st, 2021 through July 31st, 2021 to help provide some color as to how we are performing in a more challenging year for tech stocks. We are hanging with Morgan Stanley right now for top tech fund.

Please note, although we are sharing our performance with you as a courtesy, we own the report and we do not give consent for you to share this publicly. Although we will discuss our final number from time to time, the terms in which we do this are determined by our agreement with the accountant. It’s against trademark and other laws to advertise another firm’s name, such as an accounting firm.

We also don’t share the dollar value in our portfolio, so this has been omitted from the report. However, the performance numbers we show below are a direct screenshot of the report.

For comparison purposes, we do not calculate Total Returns on our account. Rather, this is a performance audit. Total Returns on Ark Innovation may slightly differ due to dividends or management fees being factored in. In the table below, we show you an apples-to-apples on our performance relative to other Funds with no additional income factored in.

The performance reviews take two to three months to complete. Therefore, we are showing you YTD through July 31st and our year-end performance for 2021 will likely come out in March, etcetera.

1-Year Performance:


YTD Performance:


How the I/O Fund Compares:

For comparison purposes, we do not calculate Total Returns on our account. As stated, Total Returns on Ark Innovation may slightly differ due to dividends or management fees being factored in. In the table below, we show you an apples-to-apples on our performance relative to other Funds with no additional income factored in other than stock performance.

“No great thing is accomplished alone.”

We want to stop and thank our Members for believing in a small team of Retailers. When we launched our retail fund, we were admittedly quite nervous as we are all trained to believe that “smart money” knows more than Retail. However, we wanted to set out and test this by forming a small team of experts who care very much about their chosen specialty. As my intro stated, the market knows how to keep you humble, and thus, we will continually strive to improve.

What’s Next for our Website:

  • We are going to split off Knox’s service to help separate fundamentals from technicals. There will be a Fundamentals chat room and a Technicals chat room on the forum. New prices will go into effect around the first of the year with anyone who subscribed 2019-2021 being locked in at the current rate. In addition to not mixing styles, the new price will also help cover costs for our real-time trade notifications.
  • We plan to launch a Beginners service to help make investing accessible to more people at a low price (5 stocks for a flat fee, something like that).
  • We launched YO/LO Fund. Please make sure to read through our Blockchain is Going to Eat the Internet report and we encourage you to keep an open mind as we find a few winners in this space.
  • We plan to release community moderation where 10 downvotes will cause a post to disappear so hang in there with moderation issues as this will roll out before the end of the year.
  • We think Q4 will be strong and are positioned accordingly. This could change as the market changes frequently. We will let you know if that’s the case.
Posted in Finance, Financial AnalysisLeave a Comment on 1-Year and YTD Audited Returns for 2021

Posts navigation

Older posts

Recent Posts

  • The IPO Glut of 2020: Why Valuations Have Gone Too Far
  • Zoom Discusses Two Important Catalysts In Q1 Earnings
  • Three Risk Management Tools the I/O Fund Offers
  • Micron Is Up 900%. Here’s Why the AI Memory Trade May Still Have Room to Run
  • Credo: Reliability Leader Aggressively Moves into Optics

Recent Comments

No comments to show.

Archives

  • June 2026
  • May 2026
  • April 2026
  • March 2026
  • February 2026
  • January 2026
  • December 2025
  • November 2025
  • October 2025
  • September 2025
  • August 2025
  • July 2025
  • June 2025
  • May 2025
  • April 2025
  • March 2025
  • February 2025
  • January 2025
  • December 2024
  • November 2024
  • October 2024
  • September 2024
  • August 2024
  • July 2024
  • June 2024
  • May 2024
  • April 2024
  • March 2024
  • February 2024
  • January 2024
  • December 2023
  • November 2023
  • October 2023
  • September 2023
  • August 2023
  • July 2023
  • June 2023
  • May 2023
  • April 2023
  • March 2023
  • February 2023
  • January 2023
  • December 2022
  • November 2022
  • October 2022
  • September 2022
  • August 2022
  • July 2022
  • June 2022
  • May 2022
  • April 2022
  • March 2022
  • February 2022
  • January 2022
  • December 2021
  • November 2021
  • October 2021
  • September 2021
  • August 2021
  • July 2021
  • June 2021
  • May 2021
  • April 2021
  • March 2021
  • February 2021
  • January 2021
  • December 2020
  • November 2020
  • October 2020
  • September 2020
  • August 2020
  • July 2020
  • June 2020
  • May 2020
  • April 2020
  • March 2020
  • February 2020
  • January 2020
  • December 2019
  • November 2019
  • October 2019
  • September 2019
  • August 2019
  • July 2019
  • June 2019
  • May 2019
  • April 2019
  • March 2019
  • February 2019
  • January 2019
  • December 2018
  • November 2018
  • October 2018
  • September 2018
  • August 2018
  • July 2018
  • June 2018
  • May 2018
  • April 2018
  • February 2018
  • January 2018

Categories

  • 5G
  • About
  • Accounting Tips
  • AdTech
  • Ai Platforms
  • Ai Platforms
  • Ai Platforms
  • Ai Platforms
  • Ai Platforms
  • Ai Platforms
  • Ai Platforms
  • Ai Platforms
  • Ai Platforms
  • Ai Platforms
  • Ai Platforms
  • Ai Platforms
  • Ai Platforms
  • Ai Platforms
  • Ai Platforms
  • Ai Platforms
  • AI Stocks
  • AI Stocks
  • Analysts
  • Application Monitoring
  • Application Monitoring
  • Applications
  • Applications
  • Applications
  • Applications
  • Applications
  • Applications
  • Applications
  • AR
  • Audit Reports
  • Autonomous Vehicles
  • Autonomous Vehicles
  • Autonomous Vehicles
  • Autonomous Vehicles
  • Autonomous Vehicles
  • Autonomous Vehicles
  • Autonomous Vehicles
  • Avod
  • Avod
  • Battery Charging
  • Bear Market
  • Bitcoin
  • Bitcoin
  • Bitcoin
  • Bitcoin
  • Bitcoin
  • Bitcoin
  • Bitcoin
  • Blockchain
  • Blockchain
  • Blockchain
  • Blockchain
  • Blockchain
  • Blockchain
  • Blockchain
  • Broad Market Today
  • Bull Market
  • Bull Market
  • Chainlink
  • Chainlink
  • Chainlink
  • Chainlink
  • China Stocks
  • Cloud
  • Cloud Infrastructure
  • Cloud Infrastructure
  • Cloud Infrastructure
  • Cloud Infrastructure
  • Cloud Infrastructure
  • Cloud Infrastructure
  • Cloud Infrastructure
  • Cloud Platforms
  • Cloud Platforms
  • Cloud Software
  • Cloud Software
  • Cloud Software
  • Cloud Software
  • Cloud Software
  • Cloud Software
  • Cloud Technology
  • Company
  • Company
  • Console Gaming
  • Console Gaming
  • Console Gaming
  • Consumer
  • Consumer
  • Consumer
  • Consumer
  • Consumer
  • Consumer
  • Consumer
  • Consumer
  • Consumer
  • Consumer
  • Consumer
  • Consumer
  • Consumer
  • Consumer
  • Consumer Tech
  • Corrections
  • Crypto Investment
  • Ctv
  • Ctv
  • Ctv
  • Ctv
  • Ctv
  • Ctv
  • Ctv
  • Ctv
  • Ctv
  • Ctv
  • Cybersecurity
  • Cybersecurity
  • Cybersecurity
  • Cybersecurity
  • Cybersecurity
  • Cybersecurity
  • Cybersecurity
  • Cybersecurity
  • Cybersecurity
  • Cybersecurity
  • Cybersecurity
  • Cybersecurity
  • Data
  • Data Analytics
  • Data Analytics
  • Data Analytics
  • Data Center
  • Data Center
  • Data Center
  • Data Center
  • Data Center
  • Data Center
  • Data Center
  • Data Center
  • Data Center
  • Data Center
  • Data Center
  • Data Center
  • Data Center
  • Data Center
  • Data Center
  • Data Center and Processing
  • Data Warehousing
  • Data Warehousing
  • Data Warehousing
  • Data Warehousing
  • Databases
  • Databases
  • Databases
  • Databases
  • Dating
  • Defi
  • Digital Ads
  • Digital Ads
  • Digital Ads
  • Digital Ads
  • Digital Ads
  • Digital Ads
  • Digital Ads
  • Digital Ads
  • Digital Ads
  • Digital Ads
  • Digital Ads
  • Digital Ads
  • Digital Ads
  • Digital Ads
  • E-Commerce
  • Earning Updates
  • Earning Updates
  • Earning Updates
  • Earning Updates
  • Earning Updates
  • Earnings Report
  • Earnings Report
  • Earnings Report
  • Earnings Report
  • Earnings Report
  • Earnings Report
  • Earnings Report
  • Earnings Report
  • ECommerce
  • Electric Vehicles
  • Electric Vehicles
  • Electric Vehicles
  • Electric Vehicles
  • Electric Vehicles
  • Electric Vehicles
  • Electric Vehicles
  • Energy Stocks
  • Enterprise
  • Enterprise
  • Enterprise
  • Enterprise
  • Enterprise
  • Enterprise
  • Enterprise
  • Enterprise
  • Enterprise
  • Ethereum
  • Events1
  • Events1
  • Exchange
  • Faq
  • Finance
  • Financial Analysis
  • Financial Analysis
  • Financial Analysis
  • Financial Analysis
  • Financial Analysis
  • Financial Analysis
  • Financial Analysis
  • Financial Analysis
  • Financial Analysis
  • Financial Analysis
  • Financial Analysis
  • Financial Analysis
  • Financial Markets
  • FinTech
  • Fundamental Analysis
  • Gambling
  • Gaming
  • Genomics
  • Glossary
  • Green Energy
  • Growth Stocks
  • Growth Stocks
  • Growth Stocks
  • Headsets
  • Headsets
  • Health Tech
  • Hydrogen
  • Identity
  • Identity
  • Identity
  • Inflation
  • Inflation
  • Inflation
  • Internet of Things
  • Interviews
  • Interviews
  • Interviews
  • Interviews
  • Investing
  • Investing
  • Ltbh
  • Ltbh
  • Ltbh
  • Ltbh
  • Ltbh
  • Macro Trends
  • Macro Trends
  • Market Trends
  • Market Trends
  • Market Trends
  • Market Trends
  • Market Trends
  • Market Trends
  • Market Trends
  • Market Updates
  • Market Updates
  • Market Updates
  • Market Updates
  • Market Updates
  • Market Updates
  • Market Updates
  • Market Updates
  • Market Updates
  • Market Updates
  • Media
  • Membership
  • Mining
  • Mobile
  • Mobile
  • Mobile
  • Mobile
  • Mobile Gaming
  • Mobile Gaming
  • Mobile Gaming
  • Multimedia
  • Music Streaming
  • NVDA | NVIDIA Corporation
  • Performance Updates
  • Pin Content
  • Podcasts
  • Podcasts
  • Podcasts
  • Portfolio
  • Premium Research
  • Press Releases
  • Press Releases
  • Productivity
  • Productivity
  • Productivity
  • Productivity
  • Productivity
  • Productivity
  • Productivity
  • Reports and Whitepapers
  • Research Services Preview
  • Resources
  • Resources
  • Semiconductor Stocks
  • Semiconductors
  • Semiconductors
  • Semiconductors
  • Semiconductors
  • Semiconductors
  • Semiconductors
  • Semiconductors
  • Semiconductors
  • Semiconductors
  • Semiconductors
  • Semiconductors
  • Semiconductors
  • Semiconductors
  • Social Media
  • Social Media
  • Social Media
  • Social Media
  • Social Media
  • Social Media
  • Social Media
  • Software
  • Software
  • Software
  • Software
  • Software
  • Software
  • Software
  • Software
  • Software
  • Software
  • Software
  • Software
  • Software
  • Software
  • Software
  • Solar
  • Solar
  • Stock Analysis PDFs
  • Stock Updates
  • Stock Updates (Blogs)
  • Supplychain
  • Supplychain
  • Supplychain
  • Supplychain
  • Supplychain
  • Supplychain
  • Svod
  • Svod
  • Svod
  • Svod
  • Svod
  • Svod
  • Tech Podcast
  • Tech Stock News
  • Tech Stock News
  • Tech Stock News
  • Tech Stock News
  • Tech Stock News
  • Tech Stocks
  • Tech Stocks
  • Tech Stocks
  • Tech Stocks
  • Tech Stocks
  • Tech Stocks
  • Tech Stocks
  • Tech Stocks
  • Tech Stocks
  • Tech Stocks
  • Tech Stocks
  • Tech Stocks
  • Tech Stocks
  • Tech Stocks
  • Technical Analysis
  • Telehealth
  • Telehealth
  • Telehealth
  • Telehealth
  • Testing Equipment
  • Testing Equipment
  • Top Tech Stock News
  • Travel
  • Trends Report
  • Tutorials
  • Uncategorized
  • Updates
  • Updates
  • Updates
  • Video
  • Video
  • Video
  • Video
  • Video Footage
  • VR
  • Webinar Alerts
  • Webinar Alerts
  • Webinars
Proudly powered by WordPress | Theme: iofund by iofund.co.uk.