Skip to content
Logo-main-white.860316a8

I/O Fund

  • Home
  • Free Stock Analysis
  • AI Stocks
  • BEST OF 2025
  • Analysts
  • Nvidia Hub
  • About
    • Case Studies
    • About Us
    • Premium Services
    • Pricing
    • Notable Wins
    • I/O Fund Reviews
    • Media
  • Contact Us

Month: June 2025

Cloudflare: Entering Act 3 to Become a Leader in AI Inference at the Edge

Posted on June 27, 2025June 30, 2026 by io-fund

Two years ago in the analysis Cloudflare: Bringing AI Inference to the Edge, we discussed in a deep dive on the stock why “Act 3 and the Workers platform is where the most explosive moment could occur” for Cloudflare while stating:  

“[…] what’s crazy is that Cloudflare rolls out features that exceed hyperscaler performance at minimal cost. It is this combination of competing with the hyperscalers, delivering app performance at faster speeds — while keeping prices low — that is unique to Cloudflare.” 

Act 3 refers to the Workers platform, which is the company’s attempt to compete with hyperscalers – but most importantly, it sets up the company well for AI inference at the edge.  

Cloudflare executes runtime for an application close to the user combined with removing cold starts by running isolates that create an advantage at the edge. This is distinct from pushing compute from a centralized data center to the edge. It’s also distinct from containerized processes that require cold starts. Cloudflare also offers R2 object storage, which helps developers eliminate unnecessary fees on cloud storage. This is used by AI startups to help arbitrage the lowest GPU cost to train their models. 

When it comes to AI inference-driven revenue, it’s still relatively early in the growth curve. Hyperscalers and model providers only recently began to disclose rapid AI token growth over the last three to four months. However, Q1’s earnings report shows signs of surging AI inference demand filtering into Cloudflare’s platform. For example, Q1 witnessed nearly 4,000% YoY growth in Workers AI inference requests, and more than 1,200% YoY growth in AI Gateway requests.  

These growth numbers are off a small base (which is true for all inference statistics for now), yet when you take a company with product-market like Cloudflare and combine it with a massive trend on the verge of taking off – what you get is an irresistible stock that the I/O Fund has a high probability of entering and holding for an extended period of time. 

Connecting the Dots: 

As discussed in the product deep dive two years ago, Cloudflare’s core products as a CDN and best-of-breed leader in cloud-based security and application security including Zero Trust may not seem connected its future as an AI inference leader, but they are intricately connected. You can read more on the background of the points below and Cloudflare’s core products here.  

Cloudflare references its business units as “Acts” – Act 1, Act 2 and Act 3. The company defines Act 1 as application security, Act 2 as Zero Trust and Act 3 as the Workers Platform. For our purposes as stock investors, it’s Act 3 we are most interested in. The analysis below makes it abundantly clear as to why Act 3 and the Workers platform is where the most explosive moment could occur. 

Cloudflare has a few distinct advantages as the platform of choice for AI developers. Here’s a summary: 

  • Does not rely on Big 3 infrastructure and can drive down costs 
  • Is faster on performance because of its position at the edge; this lowers costs and latency for AI inference and keeps data as close to the user as possible 
  • Geographically equipped to handle compliance issues that will inevitably result from using training data for inference.  
  • The company has moved diligently into compute, storage and application services. Combined with its global network, this positions the company for AI inference as-a-service. There is no other company doing both edge network plus compute and storage except the hyperscalers. However, in some cases such as serverless, Cloudflare exceeds the performance of the hyperscalers. 
  • CDN as a core product and security as a seamless upgrade shows the importance of being a middleman, helping to position Cloudflare to innovate around Serverless in ways that outperform even AWS.    
  • Training models is prohibitively expensive by requiring upfront costs, Nvidia GPUs are hard to obtain, and AI development is not democratized for developers with proprietary, blackbox APIs that run counter to an open-source movement (GPT-4 versus Llama). Cloudflare aims to solve these problems by allowing popular models to run closer to the user, which is the next logical step for AI. 

Ultimately, the bigger and the faster a network is, the more it’s capable of providing “as a service.” AI can create a fortuitous moment for Cloudflare because the company is both positioned to offer AI inference-as-a-service yet also solves important pain points for developers. 

Workers AI Built for High-Speed AI Inference at the Edge 

Cloudflare’s Anycast network routes traffic to the most available data centers, and can spread traffic across the entire network, improving resiliency during surges and minimizing latency. Cloudflare said in Q1 that the network now spans over 13,000 major service providers in 500 locations across 400 cities in more than 100 countries. By routing requests to the edge, Cloudflare is less than 50 milliseconds away from 99.9% of Internet traffic and 95% of the Internet-connected population.  

Cloudflare recently revealed at Morgan Stanley’s Tech, Media and Technology (TMT) Conference in March 2025 that when it first developed its Workers platform nearly eight years ago, it had no idea it would foresee what AI agents would become. The platform was originally born with the idea of creating a new way to deploy code at the edge, or as Cloudflare puts it, the “Goldilocks zone of high compute performance with low latency” as close to devices as possible.  

Workers has a unique platform architecture: it eliminates cold starts by running close to GPUs instead of in a container or virtual machine, executing code the second it is received. It also uses isolates, which run 100x faster than node processes and consume significantly less memory without requiring separate resource allocation. Essentially, developers pay for Javascript runtime once and can then run “limitless” scripts across hundreds or thousands of isolates, all without additional overhead costs.  

It is this unique isolate-based architecture, with ultra-low latency and an ability to execute thousands of requests concurrently at minimal cost, that provides Cloudflare an advantage for AI inference. What Cloudflare offers is exactly what AI inference needs – exceptionally fast performance with no lag at the edge, as that is where the data is located. 

Cloudflare is working to significantly expand GPU accessibility across its global network to serve growing inference demand, having GPUs across 190 cities worldwide as of March 2025. Cloudflare had doubled its GPU capacity in one year with more powerful GPUs as of September 2024, and is aiming to double its capacity again in 2025.

Source: Cloudflare 

Cloudflare is also expanding support for increasingly large models, such as Meta’s Llama 3.1 family, and a broader range of models with its ‘Run Any’ support feature (this is limited however to models compatible with its GPU fleet and inference stack).  

Cloudflare’s vector database Vectorize aids in the full-stack AI app development process by storing and remembering previous inputs. Vectorize can now support indexes with up to 5 million vectors, up 25x from 200,000 previously. Median query latency has been reduced nearly 18x from 549 milliseconds to 31 milliseconds. This allows AI apps to search and recall relevant data quickly while keeping costs lower.  

By expanding access to larger models and larger context windows at faster speeds, AI apps built on Workers AI now can handle increasingly complex tasks with greater efficiency at similar or lower costs. Put together, Cloudflare says that Workers platform can end up ~3x cheaper per CPU-cycle versus competing platforms like AWS’ Lambda, at $0.50 per million requests versus $1.84 on Lambda. As developers now begin to increasingly use Cloudflare and Workers for AI API requests, they benefit directly from these lower overhead costs in addition to higher performance and lower latency offered by the global network.  

These key advantages are helping Cloudflare land and expand enterprise customers with AI in mind. CFO Thomas Seifert explained that customers migrating to Workers can see cost or performance improvements of ~300% in the migration. It was this exact reason that drove its largest deal on record in Q1, a $130 million five-year deal with an existing customer, primarily for Workers. Cloudflare said this customer was deeply engaged with a hyperscaler who was confident in winning the deal, but the customer “made the decision to switch to Cloudflare when they saw our better performance, lower development costs and more modern platforms.” 

AI Gateway: Additional Benefit for Enterprise AI 

It is also no surprise that Cloudflare is becoming a platform of-choice for AI providers, with 80% of the leading AI companies as customers of Cloudflare. Yet it has one new, underdiscussed product that could help pave the way for broader enterprise AI adoption: AI Gateway. 

Although AI Gateway was launched more than a year ago, Cloudflare has been especially quiet about the new offering. Q1 saw the first mention of growth for the product, while management said at Morgan Stanley’s TMT that it was its largest new feature that “might not have gotten enough attention yet from a Wall Street perspective.” As of October 2024, Gateway had proxied over 2 billion requests in just one year.  

Gateway is a centralized AI ops platform for Workers AI. It acts as a control center for AI applications running on Cloudflare with multi-vendor observability and analytics, sitting between customer applications and AI APIs they make requests to. 

Source: Cloudflare 

With Gateway, customers have detailed insights into traffic patterns, such as the amount of requests, token usage, and costs over time. Customers can limit requests to help control costs, while custom response caching allows Cloudflare to make repeat requests, saving costs and lowering latency by serving from the cache and bypassing the original API. Gateway pairs natively with Workers AI and Vectorize to help developers build full-stack AI products within the platform.  

Cloudflare noted that it has plans to expand features to include dynamic model routing with A/B testing, usage alerts, advanced caching and more. However, its future vision for Gateway embeds more data security tools to ease enterprise adoption and smooth other privacy concerns, a major hurdle to adoption at the moment. 

Cloudflare says that in the future, its goal for AI Gateway is to transform it into a product that helps enterprises monitor how employees utilize AI. With Gateway, enterprises could route all API requests to AI providers through Cloudflare’s platform first, letting organizations log user requests, set access policies and rate limiting, and implement data loss prevention strategies. Cloudflare says that if an employee accidentally pastes sensitive data into ChatGPT, enterprises could redact that or block the request entirely, preventing it from reaching AI providers and thus into the public domain.  

The end goal with Gateway is to create a platform that lets enterprises tap into efficiencies that AI unlocks while providing a high level of data security and privacy. This is a key concern – a Deloitte survey from late 2024 found that nearly 75% of tech professionals listed data privacy as a top three concern from genAI use in the enterprise. Around 40% had listed data privacy as the number one concern, up from 25% in 2023. A survey from Reveal in June 2025 also found that while 73% of tech leaders prioritize expanding AI use this year, 78% listed data privacy as their top concern.  

For enterprises utilizing AI, costs trump all, as even small changes in token/API costs at high usage, such as hundreds of thousands of API calls daily, could quickly drive usage costs higher and adversely impact margins. Cloudflare’s focus on providing high visibility into AI usage, while simultaneously boosting data privacy and minimizing costs and latency provides an additional benefit when it comes to inference and AI application deployment.  

Workers Shows Hints of Rapid AI Momentum 

Cloudflare’s Workers platform is seeing considerable AI-driven momentum, both in active developers growth and now AI inference requests. Active developers first reached 1 million in November 2022, nearly tripling YoY. By April 2024, or approximately two quarters after the launch of Workers AI, active developers had doubled to more than 2 million.  

Though Cloudflare did not provide an update in Q1 or at TMT, active Workers developers crossed 3 million at the end of 2024, marking a 50% YoY increase. Overall, this represents nearly 9x growth in just over three years.  

Source: Cloudflare 

Additionally, Cloudflare noted that Act 2 and Act 3 products – Zero Trust and Workers – contributed significantly to its strong ACV growth in Q1. Net-new ACV recorded its highest YoY growth in three years last quarter, with products from the two acts driving two-thirds of that. 

We recently covered Workers developer growth and other strong key metrics in our free newsletter from February, Encouraging Growth in Key Metrics Drives 60% Gain YTD for Cloudflare Stock. 

When it comes to AI inference-driven revenue, Cloudflare has not offered any insights, as it’s still relatively early in the growth curve. Hyperscalers and model providers only recently began to disclose rapid AI token growth over the last three to four months. However, Q1’s earnings report did show some hints of surging AI inference demand filtering over to Cloudflare’s platform. 

Q1 witnessed nearly 4,000% YoY growth in Workers AI inference requests, and more than 1,200% YoY growth in AI Gateway requests. This builds upon Q4’s first large inference customer win of approx. $7 million. While growth is likely off a rather small base considering the relative newness of both platforms, it is a solid indicator of accelerating inference demand.  

Capex is a bit more unusual metric to point to in support of strong inference-driven growth, but Big Tech has been straightforward in saying that AI capex is correlated with demand, and higher demand necessitates higher capex. Cloudflare’s network capex has accelerated sharply, up from 6% of revenue in Q2 to 15% of revenue by Q4 and now 17% of revenue in Q1. This quick increase in capex suggests that Cloudflare is rapidly ramping up GPU and hardware purchases to meet heightened AI demand signals. 

Quarterly Growth Projected to be Flat Through 2025 

Cloudflare reported a 2% beat in Q1 with revenue increasing 26.5% YoY to $479.1 million. This growth was attributed to the strength of Cloudflare’s largest >$1M and >$5M ARR customer cohorts, which saw record customer additions in the quarter. 

By geography: 

  • US revenue rose 20% YoY to $234.9 million, or 49% of revenue. Any deceleration here as a core revenue generator could present a headwind to growth reaccelerating. 
  • EMEA revenue rose 27% YoY to $133.9 million, or 28% of revenue. 
  • APAC revenue rose 54% YoY to $73.4 million, or 15% of revenue. Cloudflare says key go-to-market strategies are producing robust growth in the region. 

Looking ahead to Q2, Cloudflare guided for 24.8% YoY growth to $500 million to $501 million in revenue, representing a 1.7 point sequential deceleration. Analysts are much more optimistic on the quarter, projecting growth above the top end of the range at $501.8 million, or up 25.1% YoY.  

Through the rest of fiscal 2025, growth is expected to be essentially flat around 25% YoY. However, management expressed confidence in driving a reacceleration through 2025, opening the door for potential upward surprises driven by AI inference. While flat growth does not usually stand out, each of the prior two fiscal years saw a notable deceleration in growth from Q1 to Q4 at ~4 points, with FY25 possibly set to break this trend.  

It's also important to note that estimates for both Q3 and Q4 been revised slightly lower over the past three months, with Q3’s estimate down (0.6%) and Q4’s down (1.0%). This represents a decline of around $3.5 to $6 million for each quarter, or 0.5 to 1.3 percentage points shaved off of growth.  

FY25 Guide Maintained at 25.3% YoY 

For FY25, Cloudflare opted to maintain its initial revenue guidance of $2.09 to $2.094 billion, corresponding to 25.3% YoY growth at midpoint. Analyst estimates call for flat growth over the next few quarters but a slightly stronger second half of the year, with QoQ growth of 8% for Q3 and 7.5% for Q4 even after some negative revisions.  

However, by maintaining guidance despite the $10M beat in Q1, Cloudflare is essentially saying Q2 could be softer than expected. With that said, Cloudflare tends to be conservative during macro events such as what we saw in April, and thus it could also be a non-issue.  

Although we are seeing a 1 to 2 point acceleration in the fiscal year consensus estimates, the hint that there could be an acceleration is what helps Cloudflare stand apart from peers since more cloud companies are decelerating sharply below 20% growth. 

For example, Snowflake’s revenue growth is forecast to decelerate from 29.2% last year to 24.7% in 2025 and below 23% next year. Datadog's revenue is forecast to decelerate from 26.1% last year to sub-19% by 2026, while MongoDB’s revenue decelerated from 31% in 2023 to a projected 13.9% this year. 

Key Metrics Support Growth Acceleration  

Cloudflare’s underlying key metrics are supportive of revenue growth accelerating. In the most recent quarter, the company reported accelerating paid customer growth and billings, stabilizing DBNRR, and record large customer additions. 

In Q1, paid customer growth accelerated 2 points sequentially to over 27% YoY, with Cloudflare reporting 250,819 paid customers. Growth has doubled from 13% two years ago, an impressive acceleration given the scale is now reaching a quarter-million paid customers.  

Cloudflare also noted it had driven record customer additions in its >$1M and >$5M ARR cohorts in Q1, with growth in both metrics up 48% and 54% YoY, respectively. 

Billings growth also accelerated 1 point to 32.8% YoY in Q1, recovering from the 20% range in 2024. Billings activity likely benefitted from QoQ improvements in sales cycles as noted in Q1, as well as stronger deal activity and larger contracts.  

Cloudflare’s DBNRR stabilized at 111%, though it has yet to see a strong acceleration like Palantir. Compared to last year, DBNRR is 4 points lower. Management did note that “churn rates improved in the quarter,” while they saw stabilization in customer businesses after April’s bout of volatility alongside reduced pricing pressures from competitors. These factors should provide more headroom for DBNRR to expand again as AI consumption increases. 

RPO also reaccelerated in Q1 to nearly 39% YoY to $1.86 billion, though there has been consistent quarterly variability in growth over the last two years. Current RPO accounted for 66% of total RPO, down from 70% in Q4. 

Margins Show NET Regressing from Path to GAAP Profitability  

Margins are the one real blemish for Cloudflare, as the company has regressed on its path to reach GAAP profitability in Q1. Gross margins have been compressing slightly, due to an increase in paid versus free traffic, while operating margins slipped sequentially in Q1. 

GAAP gross margin was 75.9% in Q1, down 0.5 points sequentially and 1.6 points YoY. Adjusted gross margin was 77.1%, down 0.5 points sequentially and 2.4 points YoY. Cloudflare said the softness was due to a significant increase in paid vs. free traffic which led to a “higher allocation of expenses to cost-of-goods-sold from sales and marketing,” similar to Q4. 

GAAP operating margin was (11.1%) in Q1, down 3.6 points sequentially and a setback from three consecutive quarters of progress towards profitability in the (7%) to (8%) range. Adjusted operating margin was 11.7%, marginally above guidance for 11.6% and down 2.9 points sequentially. For Q2, Cloudflare guided for adjusted operating margin to improve one point to 12.6%. 

As seen below, there exists a wide, nearly 23 point gap between GAAP and operating margins. This is driven primarily by high SBC at ~20% of revenue, and it highlights that either SBC would need to move much lower, or costs much lower, in order to drive Cloudflare to a sustainable path to GAAP profitability. For example, Q1’s sales & marketing expense was 38% of revenue, 10 points above Cloudflare’s long-term model of 27% to 29% of revenue. 

GAAP net margin was (8.0%) in Q1, a rather substantial decline from (2.8%) last quarter, driven by the QoQ decline in operating margin. Adjusted net margin was 12.2%, the lowest reported level since Q2 2023. 

EPS Growth Minimal in FY25 

Cloudflare reported adjusted EPS in line with estimates at $0.16 in Q1, for flat YoY growth. Q2 is expected to see adjusted EPS decline mid-single digits YoY, with the full-year on track for just mid-single digit growth with an acceleration expected in Q4. 

For Q2, Cloudflare guided for adjusted EPS of $0.18, down from $0.20 in the year ago quarter. Adjusted EPS growth is expected to resume in 2H, with EPS seen exiting the year at $0.23, up 22.6% YoY.  

For FY25, Cloudflare maintained its guidance for $0.79 to $0.80, corresponding to growth of approximately 6% YoY. For FY26, analysts are projecting EPS growth to accelerate sharply to 30.3% YoY to $1.04, which likely would require solid improvement in adjusted margins given the topline acceleration is minimal. 

Cash Flows & New Debt Raise 

Operating cash flow continues to improve, touching a 30% margin in Q1, though free cash flows remain pressured by heightened network capex at 17% of revenue. Cloudflare also raised a substantial amount of capital on June 13, an interesting move given the company still has nearly $2 billion in cash on hand. 

  • Operating cash flow rose more than 98% YoY to $145.8 million, for a 30% margin. This marked a substantial 11 point improvement from a 19% margin a year ago and a 2 point sequential improvement. 
  • However, free cash flow rose 48.6% YoY to $52.6 million, for an 11% margin, up only 2 points YoY. This was driven by heightened network capex in the quarter at 17% of revenue, increasing from 15% of revenue in Q4 and more than double last year’s 8% of revenue.  
  • For FY25, Cloudflare maintained guidance for network capex to be 12-13% of revenue with some quarterly variability, which may allow FCF margin to expand throughout the year as it suggests capex spend will normalize at a lower level.  
  • Cash and investments totaled $1.92 billion, while Cloudflare reported $1.29 billion in convertible debt still outstanding, due in 2026.  
  • On June 13, Cloudflare announced it priced $1.75 billion in 0% convertible notes due 2030. Cloudflare said the conversion price is ~$247.67, and the capital will go towards general corporate purposes, including working capital, network capex, M&A or paying outstanding debt.  

Valuation is the Primary Drawback 

The primary drawback to Cloudflare’s AI inference opportunity at the moment is its valuation. Key metrics and comments of 12x to 40x growth in AI inference requests support revenue reaccelerating, but it is hard to justify a rapid repricing from a 16x forward revenue multiple in April until there is tangible evidence of the topline accelerating. 

Cloudflare is trading at a hefty 30x forward revenue multiple, second only to Palantir’s 85x multiple. This represents Cloudflare’s most expensive valuation on a forward revenue basis since 2022, and far above historical resistance at around 22x. 

Source: YCharts 

While Cloudflare may have a clearer AI inference opportunity than other best-of-breed cloud stocks such as Snowflake and DataDog, it is trading at a significant premium to both. At 30x, Cloudflare is near a 100% premium to SNOW and a 115% premium to DDOG, despite all three are reporting revenue growth in the 25% to 27% range for the most recent quarter. 

Source: YCharts 

On a forward PE basis, Cloudflare is valued just 5% shy of Palantir, at nearly 228x forward EPS. Cloudflare is nearly 20% more expensive than SNOW at 192x forward PE, and far above DataDog’s 76x multiple. Cloudflare also has the second lowest adjusted EPS growth this year, at 6% versus 42% for Palantir, 33% for Snowflake, and (7%) for DataDog. 

Conclusion 

Cloudflare is uniquely positioned to capture AI inference at the edge, and we are seeing more signs of surging AI inference demand from hyperscalers. Cloudflare has been relatively quiet about AI inference-driven growth until Q1 when it dropped 12x growth in AI Gateway requests and 40x growth Workers AI inference requests. 

The takeoff in AI inference is expected to drive an inflection in Cloudflare’s growth, with revenue expected to begin a prolonged acceleration through FY27, starting in the back half of 2025. However, Cloudflare’s valuation presents a real drawback after a rapid rerating higher, considering the acceleration has not yet tangibly materialized and margins regressed from a path to profitability.  

For stock setups, including potential entry prices, consider upgrading to our Advanced tier with real-time trade alerts and weekly webinars held on Thursdays at 4:30 p.m. EST. To receive $100 off our Advanced tier, use code ADVANCED100 or click here and email your request to upgrade.ADVANCED100 or click here and email your request to upgrade.

Damien Robbins, Equity Analyst at I/O Fund, contributed to this analysis

Please note: The I/O Fund conducts research and draws conclusions for the Fund’s positions. We then share that information with our readers. This is not a guarantee of a stock’s performance. Please consult your personal financial advisor before buying any stock in the companies mentioned in this analysis.

Recommended Reading:
  • Can AMD’s MI350X and MI355X GPUs Close the Gap with Nvidia?
  • This AI Stock is Set to Surge from Inference Demand — Broadcom
  • Palantir Stock: Strong Sequential Growth and Strong Underlying Key Metrics
  • Taiwan Semiconductor: Building a Moat under Geopolitical Tensions
Posted in Cloud Software, CybersecurityLeave a Comment on Cloudflare: Entering Act 3 to Become a Leader in AI Inference at the Edge

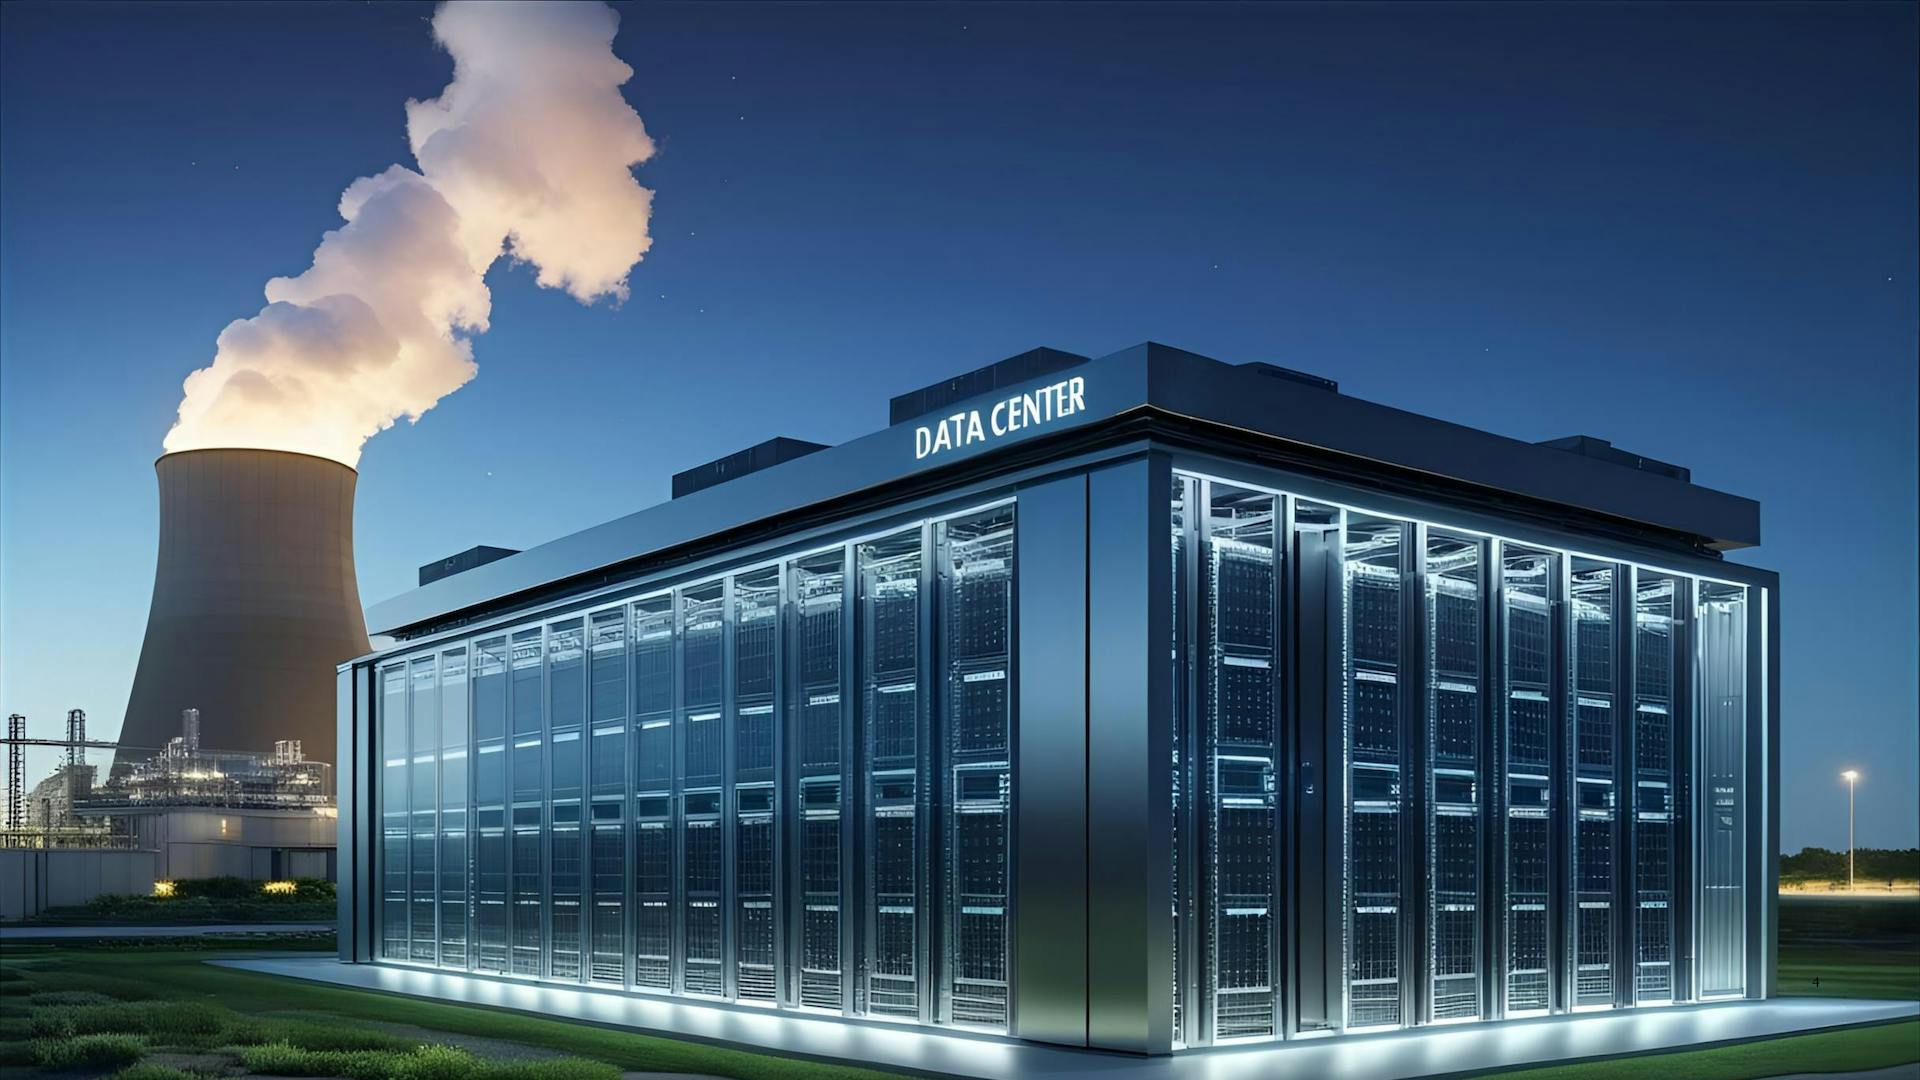
Nuclear Power Emerging as a Clean AI Data Center Energy Source

Posted on June 27, 2025June 30, 2026 by io-fund
Nuclear Power Emerging as a Clean AI Data Center Energy Source

Nuclear energy is emerging as a cleaner solution to power future AI data centers, which require constant, clean, and reliable baseload electricity to meet around-the-clock AI demand. Over the past year, interest in nuclear has accelerated, with Big Tech signing multiple nuclear power purchase agreements while US policy aims for accelerated development of the industry. 

Inference is expected to be a primary factor in surging power demand in AI data centers. Power demand for inference tasks is projected to increase at a 122% CAGR through 2028, as providers work to serve billions of requests and process hundreds of trillions of tokens. Big Tech is already showing signs of explosive inference growth with token generation up 5x to 9x YoY.  

As AI data centers push for scalable, clean energy sources, nuclear energy is receiving renewed attention despite having higher costs and some of the longest time to power in the industry.  

Below, we discuss nuclear energy’s potential to aid growth in AI data center power demand, its advantages and drawbacks, plus Big Tech’s increased interest in nuclear, including a record-setting deal, and more.  

GPU Power Consumption Continues to Soar 

One year ago, we first discussed how quickly power consumption was increasing with new GPUs in the analysis AI Power Consumption: Rapidly Becoming Mission-Critical. This trend is set to continue with Nvidia pushing towards an ultimate goal of super-sized 1MW server racks, or 8x more than GB200 racks.  

Nvidia’s Blackwell lineup already brings a significant increase in power consumption, nearly double the H200’s 70 kW at 120 kW for the GB200 NVL72 and 140 kW for the upcoming GB300 racks.  

Beyond Blackwell, Nvidia’s future design lineup shows continual increases in power consumption. Its Rubin generation is expected to boost thermal design power (TDP) by 50% over Blackwell at up to 180 kW per rack, with the upgraded Vera Rubin then doubling this to 360 kW per rack by 2027. In its largest configuration, the Vera Rubin NVL576, dubbed the ‘Kyber’ rack, could draw as much as 600 kW (0.6 MW), or 5x that of the GB200 NVL72 in just a two-year design timeframe. 

This is paving the way for the path to 1 MW GPU server racks by the early 2030s. While not much is known about Nvidia’s Feynman generation, it is also likely to bring higher TDP versus Rubin, and a possible shift from direct-to-chip cooling to immersion cooling to handle immense thermal needs. Additionally, researchers from KAIST predict that the accelerator industry could see server racks as large as 1.54MW by 2032, or more than 12x growth from the GB200s in seven years. 

This continuous upgrade cycle to more powerful GPUs is likely to further boost data center electricity demand due to the sheer increase in TDP that each generation brings combined with a path to larger cluster sizes. However, moving to 1MW servers and beyond will likely require significant advancements in cooling tech and widescale commercialization of immersion cooling to handle these intense thermal needs.  

AI Data Center Electricity Demand Forecasts Show Major Growth

Driven by the explosion in AI demand over the past two years, this current acceleration in inference, and increasingly power hungry GPUs, AI data center electricity demand is forecasted to surge over the next few years. We have a handful of different viewpoints and projections from analysts and industry groups that, while differing slightly in timelines and scope, all point to the same conclusion.  

First, let’s put in perspective how much power data centers need. For example, OpenAI’s Stargate data center in Abilene, Texas is expected to have a 1.2 GW capacity with its second phase under construction, or enough power to supply approximately 1 million homes. When you factor in Nvidia saying that it has visibility into tens of gigawatts of projects, that would be the equivalent of tens of millions of homes that the power grid will soon need to account for.  

In a shorter-term view, Boston Consulting Group forecasts global data center power demand to rise at a 16% CAGR from 2023 to 2028, accelerating from a 12% CAGR. Hyperscalers are projected to account for 60% of this demand growth.  

Within BCG’s forecast, generative AI power demand is estimated to rise at a 65% CAGR, with AI training increasing at a 30% CAGR and inference rising at a rapid 122% CAGR. By 2028, BCG estimates gen AI will account for more than one-third of global data center power demand.  

Chart showing acceleration in global data center power demand from 71 GW in 2024 to 127 GW by 2028, driven by generative AI and inference.

Global data center power demand is expected to accelerate to a 16% CAGR through 2028, driven by generative AI and inference demand. Source: BCGBCG 

Deloitte similarly sees surging growth for power capacity in the US, forecasting 5x growth over the next decade. The firm estimated US data center power capacity to rise 24% from 33 GW in 2024 to 41 GW in 2025, before tripling to 120 GW by 2030 and rising further to 176 GW by 2035.  

Goldman Sachs estimated global data center power usage at 55 GW in early 2025, far below BCG’s 82 GW figure. However, GS projects power usage to reach 84 GW in 2027 and increase further to 122 GW by 2030. 

AI Data Center Electricity Share Could Reach Double-Digits 

In terms of electricity share, AI is expected to account for a much larger proportion of demand by 2030, especially in data-center heavy regions.  

The Electric Power Research Institute forecasts that data centers may see electricity consumption more than double by 2030, to account for 9% of the US’ total electricity demand. Globally, a report from SPhotonix estimates that data centers could account for 13% of total electricity demand by 2030. 

The Department of Energy projects that data center demand could nearly triple by 2028 in its high-end scenario, accounting for 12% of the US’ total demand, compared to just 4.4% in 2023. The agency’s low-end scenario projects data centers reaching 6.7% of total demand. Meeting this increase in demand in such a short time could require between 33 GW to 91 GW of new generation capacity.  

However, in more localized regions that have concentrated data center presence, such as Northern Virginia, data center electricity demand may be far higher and place further strain on the local grid. For example, Northern Virginia has more than 5.9 GW of data centers in operation, 1.8 GW under construction, and another 15.4 GW of planned projects. Per the EPRI, data centers already account for 25% of Virginia’s electricity demand, amplifying concerns that this demand will outstrip supply and cause rolling blackouts. This does not even account for the 3x growth in data centers based on the planned project backlog. 

Why Nuclear is Emerging to Serve AI Data Center Power Needs 

Given that time to power has been floated as a constraint by Big Tech executives recently, it’s important to touch on why nuclear is being named to address rising power demand considering other fuel sources can have much quicker time to power. Nuclear could add dozens of GW to the grid to serve data center needs, with up to 174 GW of capacity potentially able to be retrofitted at existing power plant sites. 

Compared to other fuel sources such as coal, solar and wind, nuclear provides a few key advantages for AI-focused data centers: 

Reliable baseload energy source: Unlike solar, wind and natural gas, nuclear provides data centers with access to highly efficient, reliable baseload power. Nuclear’s capacity factor (ratio of electrical output vs maximum capacity) can exceed 92.5%, far outpacing other renewable or preferred power sources, including wind at a 35% capacity factor (CF), solar at 25%, and natural gas at 56%. Nuclear is also not reliant on weather conditions and reduces interruptions that may be faced with wind or solar.  

High energy density and zero emissions: Nuclear is highly dense, with nuclear power plants producing around 1 GW on average, or enough for five 200MW data centers per plant. Nuclear is also virtually emission-free, aiding countries or providers in meeting rising electricity demand while aligning with net-zero commitments. As seen in the graphic below, based on the average use per person of 235,000 kWh/year, nuclear’s fuel requirements are <2% of other common fuel sources with far fewer emissions. 

Graph showing nuclear energy fuel requirements and corresponding emissions versus coal, oil and gas.

Nuclear requires far less fuel than coal, oil or natural gas to produce equivalent output, with minimal emissions. Source: IEAIEA 

Scalability: Due to its high density, nuclear’s high output per plant makes it a suitable choice for larger data centers, as a single reactor could meet the needs of a large hyperscale data center campus or power multiple smaller data centers if used solely for that purpose. 

Grid stability and on-site needs: Co-locating nuclear with AI data centers can reduce stress on the grid as nuclear’s high output could limit reliance on existing grid infrastructure, while excess power generated could be returned to the grid. Modular reactors also promise ease of providing on-site power generation either on or off grid. In the case of Northern Virginia, nuclear could ease pressure on the grid given the substantial backlog of projects planned in the region. 

Large existing footprint: A substantial amount of nuclear power could come from retrofitting existing sites, with analysts from Goldman Sachs estimating that between 60 GW to 95 GW of new capacity could use existing sites, reducing costs and construction timelines. It’s also estimated that anywhere between 128 to 174 GW of nuclear capacity could be retrofitted at operating or retired coal plants. 

Small modular reactor (SMR) tech: SMRs are emerging as they promise quicker time to power with shorter construction times and lower costs, while offering more flexibility in deployment versus a large-scale plant. SMRs could offer up to 300MW capacity, able to power larger data center campuses without supporting infrastructure. However, SMRs are far from full-scale commercialization, with the first reactors likely not coming online until around 2030. 

For additional reading, we have covered other data center power sources in these articles:  

  • AI Data Center Power Wars: Brown vs. Clean vs. Renewable Energy SourcesAI Data Center Power Wars: Brown vs. Clean vs. Renewable Energy Sources 
  • Unlocking the Future of AI Data Centers: Which Fuel Source Reigns Supreme in Efficiency?Unlocking the Future of AI Data Centers: Which Fuel Source Reigns Supreme in Efficiency? 

A Note on Increased Policy Support 

While Big Tech’s quick turn to nuclear over the past year is supporting prospects of reigniting the industry at large, increased policy support from the current administration also serves as a tailwind.  

President Trump signed four executive orders targeting accelerated nuclear deployment and setting a goal of quadrupling US nuclear output by 2050. The orders call for increased uranium mining and enrichment capabilities to bolster the domestic supply chain, as well as accelerated testing of advanced reactor designs including SMRs and faster regulatory approval processes.  

Last week, the DOE announced a new program to help streamline the approval process and unlock private funding for advanced reactors and SMRs, aiming to have “at least three reactors achieve criticality by July 4, 2026.” Initial applications are due by July 21, 2025.  

Nuclear Energy has a Few Key Disadvantages  

Although nuclear has been gaining traction for AI data center needs, there are a few key downsides, most notable time to power and cost: 

High capex requirements: Capex for nuclear power plants is estimated to be 5x to 10x that of using natural gas, with nuclear costing between $6,417 to $12,681 per kW compared to $1,290 per kW for natural gas. Deloitte says restarting retired plants can significantly lower capex compared to new construction, with an estimated cost of approx. $6.2B for three plants with 2 GW capacity versus $37B for the same capacity in new construction.  

Long time to power: Nuclear faces long construction timelines, with large reactors (1 GW) taking between five years to nearly 11 years from breaking ground to connection to grid. Though slightly quicker, SMRs can still require nearly four to six year timelines. With power being a primary constraint and time-to-power at the forefront of discussions for Big Tech executives, nuclear’s prolonged construction may make it a story for 2030 and beyond, given that solar, fuel cells, and natural gas provide quicker alternative options.  

Cost and time overruns: Nuclear plants often see delays and higher costs than expected, and this is not isolated to the US. Per the IEA, nuclear projects in the US often see up to 2.6x overruns on cost and time in years, while France sees overruns greater than 3x. Break-even point for new builds tends to be ~30 years after breaking ground, with overruns potentially pushing this farther into the future.

Chart showing nuclear energy power plant cost and time overruns by country.

Nuclear power plant projects often face significant time and cost overruns, prolonging lengthy construction timelines and adding to high costs. Source: IEAIEA 

Low thermal efficiency: Despite having a high capacity factor, nuclear has a rather low thermal efficiency, meaning more of its power is lost to heat. Nuclear’s thermal efficiency is typically between 33% to 40% depending on reactor type, comparable to natural gas at 35% to 42% on a simple cycle gas turbine. However, when using combined cycle gas turbines, natural gas could see its thermal efficiency as high as 62%, making it more efficient and quicker to stand up than nuclear.  

Utilities Poised to Benefit from Big Tech Data Center Partnerships

Subscribe Below for Free to Access the Following: 

  • Info on new partnerships from Big Tech including a record-breaking multi-billion dollar nuclear deal 
  • An overview of nuclear stocks poised to benefit from increased AI data center power demand  
  • The one fuel source that is filling the gaps and meeting immediate power needs for Big Tech

Big Tech is showing an inclination to back nuclear, signing a handful of large contracts for multiple GW of capacity over the last year alone. However, a majority of these projects are unlikely to be ready by the end of the decade.  

Less than two weeks ago, Amazon and Talen Energy restructured and expanded their partnership into what would be the largest nuclear power purchase agreement (PPA) in history. The two finalized a 17-year, $18 billion deal scaling up to 1.92 GW of power from Talen’s Susquehanna plant. Amazon had previously acquired the collocated data center from Talen for $650 million in 2024, though regulatory headwinds had plagued the PPA. The new deal will see Talen provide energy to Amazon’s data center through 2042, while the two will also explore expanding output or developing SMRs in the future.  

Also earlier in June, Meta signed a 20-year PPA with Constellation Energy to purchase 1.1 GW of power from Constellation’s Illinois plant to meet growing AI power needs. The deal will come into effect in 2027, though it will not power Meta’s data centers directly but rather return power to the grid. This is also separate from Meta’s broader push to have 1-4GW of new nuclear capacity in the US beginning in the early 2030s. 

This follows a similar 20-year PPA deal between Constellation and Microsoft last year to restore the Three Mile Island Unit 1 nuclear by 2028, providing ~0.84 GW of power for Microsoft’s AI data centers. Constellation provided an update Wednesday morning, saying that TMI could restart by 2027, nearly a year ahead of schedule. 

Big Tech Also Exploring SMRs for AI Data Center Needs 

While the largest deals to date have been PPAs with power providers, Big Tech is also exploring SMRs with startups, though these are more focused on deployment timelines beyond 2030. 

In May, Google partnered with Elementl Power to provide capital for three project sites for advanced nuclear reactors, with each producing up to 0.6 GW. Google also partnered with Kairos Power last year to deploy a 0.5 GW fleet of SMRs by 2035. Both are a part of the search giant’s goal of bringing 10 GW of nuclear capacity online by 2035. 

Last year, Amazon announced partnerships with Energy Northwest, X-Energy and Dominion to explore SMR development through the 2030s. X-Energy is expected to deploy four reactors for 0.32 GW of power in the mid-2030s, with a goal of bringing five GW online by 2039.  

In late 2023, colocation and server management firm Standard Power selected NuScale Power’s SMR tech for two facilities it was planning to develop in Pennsylvania and Ohio to power data centers in the region. NuScale is expected to provide 24 units of 77 MWe SMR modules for combined capacity of 1.85 GW, though there is not a set timeline for delivery. The 77Mwe module just received NRC approval at the end of May.  

Natural Gas to Fill Gaps in Meeting Data Center Demand 

Though Big Tech is deploying more resources towards nuclear development, natural gas remains much more suitable and the preferred choice to meet immediate power needs. This is because natural gas is readily available and easily dispatchable over 3 million miles of pipelines, and more efficient than other renewable sources or coal. 

Utility providers are ramping up natural gas in the short term for AI data center needs, while industry executives have been outspoken about the importance of natural gas to fill gaps until nuclear is viable. 

For example, a report from Data Center Dynamics states that “utilities serving the Carolina, Georgia, and Virginia markets have announced plans to add 20GW of new natural gas generation capacity by 2040, with two-thirds of forecasted load growth tied to new data center capacity.” Duke Energy has also noted discussions with hyperscalers about accelerating projects to meet higher demand, with more than half of Duke’s project queue tied to data centers.  

Additionally, ConocoPhillips CEO Ryan Lance expects natural gas to play a much larger role in meeting demand over the next few years, while Talen Energy CEO Mac McFarland expects gas will have to fill the gap in the near-term until SMRs are ready. 

AI Data Center Energy Stocks 

Nuclear stocks that have a focus on AI data center energy needs are rather few and far between, though utility providers and companies in the uranium supply chain are also indirectly exposed to growing demand.  

On the utilities side, Constellation and Talen lead the way with strong engagements from Big Tech recently. Constellation boasts the largest nuclear fleet in the US with 21 reactors, producing 45,582 GWh of electricity in Q1. Dominion Energy plays a key role in Northern Virginia and is working with Amazon on exploring SMR development, while Duke Energy has a larger presence in the Southeast.  

In advanced reactors and SMRs, Oklo notably has one of the largest singular nuclear data center power agreements, a 12 GW Master Power Agreement with data center designer Switch. NuScale expects to receive its first firm customer order this year, and its 77 MWe reactor design recently received NRC approval. Nano Nuclear is developing four different microreactor designs, though it does not expect to commercialize its reactors until 2030 or beyond. GE Vernova also is developing SMRs, though its boiling-water reactors are currently a core part of the industry with 40 in operation.  

In the supply chain, companies involved in uranium development, mining and production include Cameco, BHP, Uranium Energy, NexGen Energy and Energy Fuels.  

Conclusion

Nuclear has seen a resurgence recently as it offers a solution to growing AI data center power demand needs as a clean, 24/7 baseload power source. Big Tech has signed numerous commitments to explore SMR tech and purchase multiple GWs of nuclear power to fuel AI data centers, bolstered by Amazon and Talen’s record-setting $18 billion deal. 

While nuclear offers a few key advantages from output to low emissions, its major drawbacks of high costs and lengthy construction timelines fail to solve the main bottleneck of the AI data center industry – time to power. Thus, the prospects of the industry are much more oriented towards 2030 and beyond, while gas may still be at the forefront of solving critical gaps in power demand and supply in the near-term. 

In July for our Premium members, we will dig deeper into a handful of nuclear-exposed stocks that may be poised to benefit from data center demand growth. Learn more about our Premium services here.Premium services here.

Please note: The I/O Fund conducts research and draws conclusions for the Fund’s positions. We then share that information with our readers. This is not a guarantee of a stock’s performance. Please consult your personal financial advisor before buying any stock in the companies mentioned in this analysis.

Recommended Reading:

  • AMD vs Nvidia: The AI Stock That Could Win by 2028
  • This AI Stock is Set to Surge from Inference Demand
  • Taiwan Semiconductor Stock: AI Growth Amid Geopolitical Risk
  • Historic Market Uncertainty Meets $7 Trillion Debt Wall: What Comes Next for the S&P 500
Posted in AI StocksLeave a Comment on Nuclear Power Emerging as a Clean AI Data Center Energy Source

Innodata: Early-Stage AI Data Engineering; Lumpy Growth 

Posted on June 26, 2025June 30, 2026 by io-fund

Innodata is a company that has lumpy growth yet is also centered in the surging trend of AI data engineering, known as data-as-a-service (DaaS) which offers curated and synthetic data to augment large language models (LLMs). Notably, the company is a small cap, high risk stock. 

Complex reasoning models require an expanded data set, such as dozens of foreign languages or multi-step problems within math and chemistry, for example. This is in contrast to a static data set, which often produces too many hallucinations and can be inaccurate at times. For example, if a Big Tech company only used its proprietary social data to train LLMs, this may not be broad enough to prevent hallucinations since social data is limited in its context and scope. In many cases, additional data points are sought out to improve the accuracy of the model. 

In order to move toward general artificial intelligence (AGI), which is defined as AI models that think for themselves similar to a human, companies like Innodata are also tapped for their ability to augment accuracy through reinforcement learning and direct preference optimization, which utilizes subject matter experts to annotate data and to also stress-test the models for accuracy.  

Overview of Innodata’s Solutions: 

The problem Innodata aims to solve is to help generative AI improve its multimodal reasoning skills and to help the accuracy of agentic models. The definition of an agentic model is when the model is more proactive, has multi-layered memory for knowledge across sessions, and eventually will work across a multi-agent ecosystem with an orchestrator. Although very few enterprises use agentic models today, Big Tech and other enterprises rely on data solutions such as Innodata’s to build out the next level of complex problems that AI can solve. 

The CEO stated the following on the most recent earnings call in terms of the problem their solutions are aimed to solve: “As models grow more sophisticated, their performance hinges not just on raw computational power, but also on the breadth, depth and quality of the data they are trained on. Continuous data acquisition enables the models to better understand nuance, context, and intent across languages and domains.” 

Here is an overview of Innodata’s solutions and how they’re used: 

  • Fine tuning is using curated and synthetic data to expand the list of tasks and subtasks to where Innodata offers hundreds of capabilities through its data sets, such as programming tasks (coding), content creation (emails, papers, checklists), logic and semantics (sentiment analysis), multi-modal reasoning (input from audio, visual and text for more nuanced comprehension), etc. The list is quite long as to how synthetic data can augment proprietary data.
  • Model scoring, risk mitigation and red-teaming refers to stress-testing AI systems for vulnerabilities. It’s a common practice in cybersecurity that Innodata provides for generative AI models to help surface any biases or inaccuracies. Model scoring helps to rank a model compared to frontier models (i.e., your model is X% less accurate than Chat-GPT 4o).
  • Reinforcement learning from human feedback (RLHF): Generative AI requires human feedback to spot inaccuracies with expert annotators to help LLMs reflect the complexity of human interactions. The company advertises that it has 5,000 subject matter experts located globally who oversee a reward model.
  • Direct Preference Optimization (DPO) also uses feedback but is a more refined process due to optimizing models by assigning high probability or low probability to two outcomes. This offers a faster feedback loop as the model can more quickly learn from the higher probabilities to improve accuracy.  

Partnership with Nvidia’s NIM Microservices: 

Although very early stage and still in beta testing, Innodata announced a new platform at Nvidia’s GTC 2025 Conference. The company is partnering with Nvidia’s NIM microservices to help facilitate LLM development across enterprises. 

Nvidia’s NIM microservices is essentially an app store for LLMs, which offers foundation models, inference engines and APIs in out-of-the-box software containers for enterprises to easily build and deploy customized LLMs. Innodata helps by providing stress-testing and reinforcement learning/direct preference optimization to fine tune the models. 

Meta Invests $14.3 Billion into Scale AI 

Scale AI is a major competitor to Innodata that also annotates data with a global team of contractors. Scale AI was recently in the news following a $14.3 billion investment by Meta, which helps to underscore the importance of data engineering platforms and Data-as-a-Service (DaaS) for the purpose of fine-tuning large language models.  

Scale AI has a particular specialty in autonomous vehicles as the company helps companies like Waymo and Tesla label objects from lidar sensors and video frames. Reinforcement learning from human feedback (RLHF) — discussed above – is then used to improve the quality of the response. 

Following Meta’s investment, it was rumored that Google, OpenAI and Tesla are looking elsewhere to avoid strengthening Meta at the cost of their proprietary data. Although it’s speculative, the exodus of major players from Scale AI could become a tailwind for Innodata.  

While Innodata’s partnership with Nvidia is a boon, one reason that Innodata may struggle to capture the business is the company is vintage with an inception date in the 1980s. The other data labeling/tooling companies are native AI companies with API-first data pipelines. To contrast, Innodata has roots in legal, healthcare, publishing and PR content whereas these other companies were founded with natural language processing (NLP) in mind. 

For example, there are other private companies that stand to benefit as well, such as Labelbox, Appen (public company in Australia) and SuperAnnotate. From there, startups such as SnorkelAI also compete by relying on automated labeling, although it’s likely the workforce behind companies like Scale AI and Innodata is what's attractive to Big Tech given automation is an area where they lead. 

ScaleAI is valued at $29 billion compared to Innodata’s $1.5 billion market cap with last year’s reported revenue of $870 million last year. If we assume Scale AI is at $1 billion revenue now, that would be a 29X compared to Innodata’s 6X forward sales. 

Big Tech Seeking Data Quality as Differentiator  

If we read between the lines on the Meta $14B investment into Scale AI, then what we see is an emphasis on data quality as a key differentiator for frontier LLMs, such as Meta’s Llama, OpenAI’s Chat-GPT or even proprietary models for Waymo and Tesla’s autonomous vehicles. While we’ve heard companies like Palantir state LLMs will become commoditized, I will stick my neck out here to say I think Alex Karp is oversimplifying the quality of LLMs.  

Last month, I asked a question of Chat-GPT 4.1 about export licensing under the Trump Administration to help ascertain if a specific semiconductor was subject to export licensing due to manufacturing partners in Hong Kong and this was the response: 

Pictured above: Chat-GPT4o hallucination on simple, basic facts from a query dated May 20th, 2025 

Chat-GPT updates its training data about once per year with this example showing the limitations of lower quality data in terms of frequency of updates and/or limited resources for new data. 

As with all technologies, we are in the hype cycle for LLMs which precedes a period of mass consolidation. Meta knows it must be competitive on data quality, and clearly, its proprietary social data is not able to produce a broad level of intelligence in order to compete with a company like Google or OpenAI when comparing recent benchmarks  

Source: CapeStart 

Innodata’s Financials: Triple-Digit but Lumpy Growth; Anything Could Happen  

Innodata is a high beta stock with a $1.5B market cap and $241M estimated for fiscal year 2025 revenue. The company reported three consecutive quarters of triple-digit topline growth in Q1 with revenue rising 120.1% YoY to $58.3 million, marginally ahead of estimates for $57.6 million. Although revenue growth slowed by over 6 percentage points sequentially, it is expected to decline even more sharply in the coming quarters.  

For Q2, analyst estimates point to revenue growth decelerating nearly 50 points to the 73% range, before slowing to the low double-digits against peak growth comps. Management did not provide any quarterly guidance for Q2, though they maintained FY25 revenue growth guidance of 40% YoY, suggesting that with what management knew at the time of the earnings call, revenue growth is expected to follow this trajectory of a sharp back-half deceleration. 

However, it is important to keep in mind the fluid nature of Innodata’s business, and that any new contractual agreements or expansions could have a large and/or immediate impact on revenue. For example, in FY24 Innodata had originally guided for 20% YoY revenue growth, before raising that to >40% in Q1, then >60% in Q2 and ultimately to 88% to 92% YoY by Q3. Such a dynamic occurring again this year cannot be quickly written off, given that management is upfront about current engagements and prospective discussions with Big Tech customers. 

Customer Update: “Mag 7” and “Big Tech” Mentioned Repeatedly on ER Call 

Management provided a handful of updates on existing Big Tech customer expansions (which includes five of the Mag 7) and discussions with prospective customers in Q1. Keep in mind, the fiscal year revenue estimates right now are for $241 million yet discussions around SOWs present a strong case for Innodata exceeding this estimate as the year plays out: 

  • Innodata signed a second statement-of-work (SOW) with its largest customer, which as of Q4, was contributing revenue at a $135 million annualized rate, up more than 22% in two quarters on new expansions in Q4 and January.  
  • A Big Tech customer (noted to be one of the most valuable software companies in the world) was said to have a late-stage pipeline potentially valued up to “more than $25 million of bookings this year and continued growth over the next several years.” This customer began working with Innodata in Q2 ’24 and contributed just $0.4 million in revenue in FY24.  
  • Another Big Tech customer recently signed one expansion deal and is expected to soon sign a second expansion, worth a combined $1.3 million in potential revenue. Management said there is another opportunity with this customer worth up to $6 million, and for comparison, the customer generated just $0.2 million in FY24. 
  • Management said they signed a deal in Q1 with “one of the most highly regarded generative AI labs” worth $0.9 million, with expansion potential worth double that figure. 

To note, Innodata’s largest customer is by far its most important, as a $135 million annualized rate implies this customer is contributing nearly $34 million quarterly, or around 58% of Q1’s revenue. This is a rather significant customer concentration, in that any lost revenue from this customer would not easily be made up from others, as deal sizes touted by management in Q1 pale in comparison.  

With that said, the shakeup around Scale AI and the growing importance around data engineering, plus Innodata’s partnership with Nvidia would help level out the customer concentration by attracting more large customers.  

On the call, it was stated that Innodata is working on building 200 autonomous agents with its largest customer worth approximately $6 million at the onset: 

“With one of our smaller big tech relationships, one that I discussed a few minutes ago, we have begun a collaboration around both AI agent data set creation and AI agent building. The work we are hoping to kick off with them this quarter will involve creating approximately 200 conversational and autonomous agents across multiple domains.” 

Key Segments 

Innodata’s Digital Data Solutions (DDS) segment is the primary driver of this sharp growth acceleration and improvement in profitability in FY24 and FY25. The segment handles AI data preparation, labeling and annotation, AI training and related services.  

The Synodex segment transforms medical records into usable digital data for customers, while its Agility segment provides a platform for PR and communications professionals to target and distribute content to journalists and influencers globally. 

  • DDS revenue in Q1 rose 158% YoY to $50.8 million, accounting for more than 87% of revenue. This marked the third consecutive quarter with revenue growth above 150% YoY. However, given that Innodata’s revenue is expected to decelerate sharply by Q4, it’s likely DDS is behind this as the core growth driver, and could see growth return to Q3 23’s levels.  
  • Synodex revenue rose 7.6% YoY to $2.0 million, decelerating from 14.6% YoY growth in Q4. 
  • Agility revenue rose 11.6% YoY to $5.5 million, decelerating from 24.9% YoY growth in Q1.  

GAAP Profitable with Adjusted EBITDA Growth of 236% 

Considering Innodata has a mere $58.3 million in estimated quarterly revenue, plus $241B in estimated annual revenue, the margin profile is quite impressive since most companies operate at a loss until they reach scale. 

Margins weakened slightly sequentially in Q1, though the rapid ramp of DDS revenue that really accelerated in Q2 has driven margins down the line much higher on a YoY basis. 

  • Q1 GAAP gross margin was 39.9%, down 5.3 points sequentially but up 3.5 points YoY. Adjusted gross margin was 43.2%, up 1.8 points YoY. Innodata shared that it is targeting an adjusted gross margin of 40%, with this result being above expectations. 
  • GAAP operating margin was 14.4%, down 4.8 points sequentially but up more than 9 points YoY. 
  • GAAP net margin was 13.4%, down 4 points sequentially but up nearly 9.7 points YoY, benefiting from the increased operating leverage driven by improving DDS profitability. 

Innodata did not provide any clear guidance on Q2’s margins, though management noted that they plan to invest ~$2 million in Q2 to support the new SOW with its largest customer, which will occur ahead of associated revenue and thus impact margins.  

Turning to adjusted EBITDA, management forecast YoY growth for the metric, though it is not clear to which degree, given that there was no supporting commentary. Adjusted EBITDA for FY24 was $34.6 million for a 20.3% margin, with Q1’s 21.8% margin already positioning Innodata for growth. Adjusted EBITDA was up 236% YoY (although on small numbers). 

  • DDS adjusted EBITDA was $11.5 million for a 22.7% margin. This marks a substantial improvement from the 11.0% margin a year ago. 
  • Synodex adjusted EBITDA was $0.4 million for a 20.8% margin, down nearly 4 points from a 24.7% margin a year ago. 
  • Agility adjusted EBITDA was nearly $0.8 million for a 13.7% margin, down nearly 10 points from a 23.3% margin a year ago. 

EPS 

Despite Q1 starting off with triple-digit topline growth and a rather strong >40% guide for FY25, EPS growth is expected to be negative this year. This is primarily due to two factors: a $5.9 million income tax benefit in Q3 and strong outperformance in margins in Q4.  

In Q1, Innodata reported $0.22 in GAAP EPS, ahead of estimates for $0.17 and representing growth of 633.3% YoY.  

However, for Q2, analysts are currently expecting EPS of $0.11, down (50%) sequentially, before ticking higher to $0.17 in Q3. This would be a decline of nearly (67%) YoY versus $0.51 in Q3 2024, due to the income tax benefit. Q4 is not expected to bring any relief, with current estimates pointing to a (38.5%) YoY decline to $0.19.  

For the entire year, Innodata is expected to report a (22.0%) YoY decline to $0.69, before rebounding 46.3% in FY26 to $1.02. 

Cash and Balance Sheet 

Cash flows have improved significantly as revenue ramped, allowing Innodata to add significant cash to its balance sheet through 2024. As a result, Innodata has a relatively healthy balance sheet with no debt and an undrawn $30 million credit facility. 

  • Operating cash flow was $10.9 million for an 18.6% margin. This was lower than the 25.5% margin in the year ago quarter, with the strong print driven by a $3 million QoQ increase in deferred revenue. 
  • Free cash flow was $8.5 million for a 14.6% margin. This was lower than the 20.5% margin from the year ago quarter due to the relatively stronger OCF. 
  • Cash and equivalents on hand were $56.6 million, up from $46.9 million in Q4 and a substantial improvement from $19.0 million a year ago.  
  • Debt remained zero, with Innodata still having access to its undrawn $30 million credit line should it need extra funding. 
  • Deferred revenue was approximately flat QoQ at $8.03 million. 

Cash flow is a line item to watch as the company stated they plan to re-invest OCF and this could lead to debt or stock dilution: “Accordingly, we intend to reinvest a meaningful portion of our operating cash flow into product innovation, go-to-market expansion and talent acquisition, while still delivering adjusted EBITDA above our 2024 results.” 

Earnings Call:  

Largest Customer to be down 5% 

In the opening remarks, the CEO stated the largest customer would be down 5% going into the next quarter: “Inevitably, customer concentration can result in quarter-to-quarter volatility. For example, with our largest customer, we exited 2024 at an annualized revenue run rate of approximately $135 million. In Q1, we were running higher than this by about 5%, and in Q2, we anticipate that we could be lower by about 5%, but the customers' demand signals are updated continually and are highly dynamic.” 

An analyst asked about this in more detail during the Q&A when it was stated the new statement of work with the customer will provide “additional share of wallet that we can tap into.” Management is referring to 200 autonomous agents discussed above under the customer section, yet at the onset this is worth $6 million. 

Risks: 

There have been short reports on the company that led to a 30% drop in share price in one day. You can read the report from Wolfpack Research here   and a second short report from J Capital can be read here. These are worth a read for anyone seriously considering the stock. We utilize proper risk management in these cases, which includes a stop on the position – should we enter. We would also only buy on a breakout when technicals provide a green light.  

One of the primary risks to Innodata’s revenue acceleration and growth trajectory is We’ve already seen one large customer termination with Innodata, though that was attributed to Musk’s publicized take-over of xAI (Innodata said this customer “dramatically cut spending after a significant and highly publicized management change” in 2022). There is no guarantee that customer spend with Innodata will expand beyond the scope of the current deals, though the view that a majority of the Magnificent 7 are rapidly adopting generative AI products and will spend hundreds of millions on generative AI and LLM development over the next few years bodes well for future growth, both in terms of expanding the scope of deals and landing deals with new customers.  

Another risk presents itself in the volatile swings in share price that Innodata sees – as a small cap, it’s much more likely to see these substantial moves in such a brief period. For example, there have been multiple weeks and many days in which Innodata has seen moves in excess of +/- 10%. This level of volatility is not typically seen with large or mega-cap stocks and requires prudent risk management. Institutional ownership is also relatively low for a high-beta AI small cap at just 36%.

Conclusion: 

The takeaway is that as LLMs continue to fiercely compete, companies like Innodata will become force extenders in the race for more accurate and reliable output. Although Innodata has many competitors, consider that Meta’s investment into Scale AI is 14X larger than its acquisition of Instagram at $1 billon, which puts into perspective the importance of data quality for Big Tech companies. 

In the closing remarks, the CEO stated “we believe our business right now is on fire. The growth we're seeing year-over-year is just the beginning. What's happening now inside the Company is really like or unlike anything we've seen before.”  

Investors will have to get comfortable with early-stage tech given Innodata’s new product-market fit is very early stage. Scale AI provides a decent comp in terms of the value of a strong AI data engineering company. Innodata’s solutions will be put to the test now that Scale AI customers will be unwinding their partnerships. Anything could happen. If we were to enter, it would be with a tight stop, and we would raise our stop as the stock price increases. 

For stock setups including a potential entry price for Innodata, consider upgrading to our Advanced tier with real-time trade alerts and weekly webinars held on Thursdays at 4:30 p.m. EST. To receive $100 off our Advanced tier use ADVANCED100 or click here and email your request to upgrade.ADVANCED100 or click here and email your request to upgrade.

Please note: The I/O Fund conducts research and draws conclusions for the Fund’s positions. We then share that information with our readers. This is not a guarantee of a stock’s performance. Please consult your personal financial advisor before buying any stock in the companies mentioned in this analysis.

Recommended Reading:

  • Credo Reports 180% YoY Growth and 20% GAAP Operating Margin
  • Amphenol Reports 134% Growth in Datacom IT Segment
  • TSS Inc.: Downwind of the AI Infrastructure Spending Boom; Helps to Alleviate Tariffs for Dell
  • Jabil’s Strong AI Growth Overshadowed by a Myriad of Weak Segments
Posted in AI Stocks, Data CenterLeave a Comment on Innodata: Early-Stage AI Data Engineering; Lumpy Growth 

Solana Approaching Buy Zone

Posted on June 23, 2025June 30, 2026 by io-fund

From the 2022 low, Solana has been tracing a very large and clean 5-wave uptrend. Note the back and forth through 2023, which was followed by a vertical push higher on max volume and momentum. This is standard 3rd wave behavior, which is the most powerful part of a 5-wave uptrend. The question we now have is: has the final 5th wave swing completed, which would complete the larger uptrend, or do we still have a final swing to new highs in our future? 

This question can best be outlined with the following scenarios: 

Blue – The 4th wave completed in April. This puts us in the early stages of the 5th wave setup to new highs. Within this larger 5th wave, we have the first wave in place and are currently in the 2nd wave. If any further weakness holds over $111 – $105, we should continue higher toward the $400 – $500 region to complete wave 5. 

Red – The 5th wave completed in January of 2025. This means that we might see one more swing higher, but it will not make a new high. This will be followed by a direct drop toward the $74 – $48 region. 

If we zoom into the current bounce off the April low, we can see that the push higher has taken the shape of a 5-wave pattern. This supports the bullish blue count listed above. We are now in a 3-wave retrace, which appears to be targeting $117 – $105 region. For the blue count to hold, we must hold $105. Any sustained break below this level will suggest that the bullish setup is breaking in favor of the red count.  

In conclusion, our game plan will be to buy on the current drop around our target zone. We will hold this position with a stop and look to close it we move toward the overhead targets listed in the blue count.

Please note: The I/O Fund conducts research and draws conclusions for the Fund’s positions. We then share that information with our readers. This is not a guarantee of a stock’s performance. Please consult your personal financial advisor before buying any stock in the companies mentioned in this analysis.

Recommended Reading:

  • Historic Market Uncertainty Meets $7 Trillion Debt Wall: What Comes Next for the S&P 500
  • Core Scientific Q1: Expects 250MW of Billable Capacity to CoreWeave by Year-End
  • Bloom Energy: Strong Q1, FY Revenue Guide Maintained with Confidence
  • Lumentum at Inflection Point with 20% QoQ Growth in AI-Related Segment
Posted in Blockchain, Crypto InvestmentLeave a Comment on Solana Approaching Buy Zone

Credo Reports 180% YoY Growth and 20% GAAP Operating Margin

Posted on June 20, 2025June 30, 2026 by io-fund

Credo continues to report outstanding revenue growth, up 180% YoY in Q4 and guided to accelerate further in Q1 as management touted growing traction with hyperscalers, new design wins in qualification and strong customer forecasts driving sustained AEC growth.

GAAP margins have expanded significantly down the line with operating margin quickly approaching 20% as signs of operating leverage emerge. Cash flow margins were robust in Q4 on strong collections, while inventories surged over the past two quarters, indicating that Credo’s hypergrowth phase will likely continue for a few quarters.

Management hinted that a new DSP deal with a hyperscaler represents its largest revenue opportunity to date, with two new hyperscaler customers ramping up in FY26. Backed by these arising revenue streams, Credo guided for revenue growth of 85%+ next year, or over $800 million.

Brief Background on Credo:

Credo’s primary product line is active electric cables (AECs), while it also offers PAM4 digital signal processors (DSPs), optical transceivers, active optical cables (AOCs), and PCIe 6 retimers. Credo’s product portfolio is underpinned by its proprietary SerDes tech, which allows for comparable performance as its peers in data transmission but at a much lower cost.

AECs and active copper cables (ACCs) are challenging fiber optic networking in the two to seven meter space, as these solutions offer lower power, lower costs and at times, higher reliability over the shorter distance. AECs solve a critical issue of data loss that occurs with passive cables at longer lengths, especially in 800 Gbps/port environments with lengths longer than two to three meters. As data center network architectures look toward replacing fiber optic in some cases for short haul networking, both AEC and ACC are being evaluated.

AECs with retimers are a more expensive option compared to ACCs due to offering a cleaner signal, yet they have the additional benefit of being vendor agnostic, which is key for data center operators who are looking to upgrade as they add more racks.

Being copper-based, AECs are cheaper than fiber optics even with the cost of the retimer, and AECs consume less power due to having a small diameter. By allowing more air flow, there are fewer issues with thermal management. This is the primary catalyst for AEC growth within the data center.

In Credo’s case, for distances between two meters and seven meters, AECs are seeing heightened demand as servers scale up from eight GPUs to now 36 and 72 GPU per rack-scale AI systems, and also as clusters grow from 10,000 to 100,000 and soon million-GPU clusters.

For a deeper understanding of Credo’s products and market positioning, read more here: Credo: AI Networking Company Surging in Revenue from Active Electric Cables (AEC)Credo: AI Networking Company Surging in Revenue from Active Electric Cables (AEC)Credo: AI Networking Company Surging in Revenue from Active Electric Cables (AEC)

AEC Adoption Driven by Higher Reliability and Efficiency

For Credo, the strong growth trajectory of its AEC product line in Q4 and FY25 was driven by their higher reliability and energy efficiency, with management highlighting significant customer wins in Q4’s earnings call.

Credo expanded its AEC portfolio with the launch of its 800G HiWire ZeroFlap AECs for AI backend networks in October 2024, aiming to enable large AI clusters sized into the hundreds of thousands of GPUs. The new AECs were designed to reach seven meters with full host-to-switch connectivity, specifically for liquid cooled servers. Credo says the new AEC line saves up to 14 watts per link and up to $1,000 per GPU.

Credo says that ZeroFlap AECs now “are gaining traction as a robust rack-to-rack solution for distances up to 7 meters, offering over 100 times greater reliability than laser-based optical modules, virtually eliminating linked labs and significantly improving energy efficiency, which are both key enablers for best-in-class AI deployments.”

This increased reliability and focus on energy efficiency at the longer seven meter length have already driven a major customer win in xAI’s Colossus 100,000 GPU cluster. At that size, Credo’s ZeroFlap AECs could drive power and cost savings of up to 1400kw (~10 NVL72 racks) and $100 million.

Aside from xAI, Credo says it has a second customer ramping this year where the catalyst was “similar in the sense that their ability to move to these longer length AECs really opens the door for them to improve the reliability.” Credo is eyeing more deployment opportunities through FY27 as cluster sizes continue to increase, with AECs helping hyperscalers greatly improve density (more racks deployed for same amount of power) with a highly reliable, efficient solution.

Eyeing >100% YoY Optics Growth with 100G Optical DSPs and 800G Transceivers

While AECs take center stage for the role as the primary growth driver, Credo’s optics portfolio stands out as well. Management laid out robust triple-digit growth targets for FY26, alongside significant progress with industry-leading product deployment and major customer wins.

Credo recently announced a handful of industry-leading optics products that position it well for more customer wins and strong growth over the next two years. Credo unveiled its ultra-low power 5nm 100G optical DSP at OFC in May, which it says sets new industry-leading benchmarks for power efficiency with full DSP and linear receive optics (LRO) variants. Credo recently showcased its 3nm 200G per lane DSP, support 1.6T port speeds with leading power efficiency and signal integrity. Credo says this new solution positions it to drive the shift to 200G lane speeds over the next few years.

Credo also showcased its family of ultra-low power 800G optical modules with an industry-first power consumption of just 9W, powered by its Lark linear receive optic (LRO) tech. Credo said it “achieved error rates comparable to full DSP solutions” and attracted significant interest from hyperscalers who are prioritizing power efficiency. LRO solutions are gaining traction as they remove the DSP, reducing cost, latency and power consumption by 1-2W per module, which is significant at larger scales.

Highlighting the strength of its optics solutions, Credo secured a major full 800G DSP transceiver win with a US-based hyperscaler, with deployments commencing in fiscal 2026. Credo said that from a revenue standpoint, this win is “probably going to be the largest opportunity that we've had to-date.”

As a result, Credo CEO Bill Brennan is expecting the company to “double or even beyond double our optical revenue in fiscal '26” with accelerated growth in the years ahead. Most optical shipments currently are 50G per lane (400G) with several designs shipping, though Credo expects more traction and revenue growth from 100G per lane designs.

Brennan was also confident in Credo’s ability to drive market share gains in 100G DSPs. He explained that he feels Credo will “experience a lot of success in the 100G per lane market in the next 12 to 24 months” as full DSP and LRO variants launch simultaneously, with the expectation that Credo will be “really well positioned in that market as that develops.”

In terms of the timing for scale-up driven optics growth, Brennan said Credo has been consistent in saying designs wins will come this year with revenue ramp beginning in calendar 2026. Over the next two to five years, he believes optics and DSPs will grow “dramatically” to eventually become a >10% revenue business. Importantly, this comment suggests that optics remains <$40 million as of FY25, and the forecast for doubling or more than doubling in FY26 may only contribute approx. $40 million of an expected $370 million-plus in revenue growth.

PCIe 6, Scale-Up Seen as Growth Driver through 2027

Credo was highly positive about the transition from PCIe Gen5 to PCIe Gen6 driving growth for them in scale-up, with PCIe 6 expected to gain traction in FY26 and FY27.

Credo’s PCIe 6 AECs displayed at GTC promised the same reliability and energy benefits for scale-up networks and rack-scale architectures, while its PCIe 6 retimers showcased “superior performance and interoperability.” Management said that customer momentum for PCIe retimers is accelerating with design winds expected in 2025 and production revenue commencing in calendar 2026. On the AEC front, management said there were “new design wins in qualification” amidst growing traction amongst hyperscalers, positioning them for sustained strong AEC revenue growth.

For scale-up Ethernet, UALink or Nvidia’s new NVLink Fusion, Credo said that these networking standards create a large market for PCIe, shifting from Gen5 to Gen6. CEO Bill Brennan said that these will all be 224G series, with Credo aiming to “establish revenue and really increase that revenue base in the PCIe Gen5 and Gen6 timeframe. And then after that, we're going to be flexible in a sense of offering Gen7” where Credo’s AECs will be universal to Ethernet, UALink or NVLink Fusion.

Financials

Revenue Continues to Accelerate to 218% in Q1

Credo reported 179.7% YoY and 25.9% QoQ growth to $170.0 million in revenue in Q4, beating the consensus estimate for $159.6 million. Revenue growth has sharply accelerated throughout the fiscal year, up from the 60% to 70% level in 1H to high triple digits in 2H.

AEC maintained a “steep growth trajectory” with revenue reaching another record in the quarter, growing double-digits sequentially. Evidence of the rapid ramp of AEC and Credo’s other optic and retimer products, quarterly revenue has nearly tripled since the start of the fiscal year at $59.7 million.

For Q1, Credo guided to $185 million to $195 million in revenue, pointing to a nearly 40 point sequential acceleration to 218% YoY growth at midpoint. This was also 17% above consensus estimates for $162.4 million heading into the report.

Credo reported 180% YoY revenue growth in Q4 and guided for an acceleration to 218% in Q1.

Revenue growth estimates have moved sharply higher since February. Q1’s growth estimate just four months ago was 133.4%, and is now nearly 85 points higher, while Q2’s growth estimate has risen 74 points from 100.9%. 

For fiscal 2025, Credo reported a 122 point acceleration to 126.3% YoY growth, with revenue of $436.8 million. For fiscal 2026, Credo guided for revenue to exceed $800 million, for growth in excess of 85% YoY, while analysts are now expecting $804.1 million.

What’s important to note here is that analyst growth expectations are much lower than what Credo has been reporting. For fiscal 2026, analysts are expecting sequential growth of 3% to 4% each quarter to reach the $804 million estimate. In Q4, Credo had initially guided for QoQ growth of 19% and reported 26%, while for Q1, Credo has guided for 12% QoQ growth. Assuming Credo can maintain QoQ growth >7% through FY26 as new hyperscalers begin to ramp, these expectations will likely materialize as too low. However, it’s important to caution that Credo is coming up on difficult comps in Q3 and Q4 and those comps elevate risk as it can be a point where hypergrowth companies often fail to impress.

Key Segments – Product Revenue Growth Tops 300% YoY

Credo reported a significant 80 point sequential acceleration in product revenue growth to 303.3% YoY in Q4, with revenue of $164.5 million. Credo said AEC products are gaining traction in rack-to-rack distances up to 7 meters, with xAI being the most successful customer at that distance with a second customer ramping this year.

For optics, Credo noted that it reached its revenue targets and ended FY on strong momentum with an expanding customer base. As previously mentioned, Credo is targeting 100%+ optics revenue growth in FY26.

In retimers, Credo said growth was fueled by 50G and 100G per lane Ethernet products, with customer momentum accelerating. Credo added that for fiscal 2026, they anticipate strong growth in retimers driven by the shift to 100G per lane solutions.

Credo's product revenue growth accelerated sharply to 303% YoY in Q4.
  • Product Engineering Service revenue declined (60%) YoY and (50%) QoQ to $1.3 million.
  • IP License revenue declined (75%) YoY but rebounded 41% QoQ to $4.2 million.

Note on Customer Concentration

Moving forward, Credo expects to diversify its customer base, eyeing up to five >10% customers in FY26, up from three in FY25. Credo’s largest customer, rumored to be Microsoft, accounted for 61% of revenue in Q4.

Credo also has two new hyperscalers ramping in 2H 26, with the expectation that both could become >10% customers in the long-term, though management offered no timeline for that. CEO Bill Brennan said the first customer is expected to ramp in mid-year, sooner than expected, with the other looking to be later in the second half. Should Credo be able to ramp these two quickly, it could provide additional revenue and growth as tough comps roll around.

Margins Shine with 40% Adjusted Operating Margin in FY26

Credo has excelled on the margin front, driving strong expansion in margins in 2H and in fiscal 2025 despite being solidly in its hypergrowth phase, a difficult feat to accomplish.

For Q4:

  • GAAP gross margin was 67.2% for an expansion of 2.4 points YoY and 3.6 points QoQ. Adjusted gross margin was 67.4%. For Q1, Credo guided for GAAP gross margin of 63.4% to 65.4%, and adjusted gross margin of 64% to 66%.
  • GAAP operating margin was 19.9%, well ahead of guidance for 17.5%. This marked an exceptional ~33 point improvement from (13%) last year, and its second consecutive quarter above 19%. Adjusted operating margin was 36.8%, up more than 24 points YoY and more than 5 points QoQ. For Q1, Credo’s operating expense forecast implies a GAAP operating margin of 17.4%, and an adjusted operating margin of 36.1% at midpoint.
  • GAAP net margin was 21.5%, up more than 38 points YoY and down marginally QoQ. Adjusted net margin was 38.4%, up 19 points YoY and nearly 5 points QoQ.
Credo's operating margin was 19.9% in Q4, up nearly 33 points YoY.

For fiscal 2025:

  • GAAP gross margin expanded less than 3 points to 64.8%, while adjusted gross margin expanded 2.5 points to 65.0%.
  • However, Credo drove significant improvement to operating margins with prudent cost management. GAAP operating margin inflected to positive territory at 8.5%, up more than 27 points YoY. Adjusted operating margin expanded 25 points to 26.4%. For fiscal 2026, management shared that they are targeting adjusted operating margin of 40%, a 14 point YoY expansion.
  • GAAP net margin was 11.9%, up nearly 27 points YoY. Adjusted net margin was 29.7%, up 22 points YoY.

EPS Growth Expected to be Triple Digit in FY26

Credo has reported robust EPS growth driven by its margin strength, with fiscal 2025’s adjusted EPS of $0.70 increasing from just $0.08 in the prior year. Credo generated the bulk of this EPS in H2 as revenue and margins surged,

Adjusted EPS of $0.35 in Q4 beat estimates by 29.6%, representing growth of 400% YoY. Growth is forecast to accelerate to 782% in Q1 to $0.35 on a low comp, before slowing to 17% YoY by Q4 FY26 against a much tougher comp.

Credo's adjusted EPS growth is forecast to accelerate to 782% in Q1.

For FY26, Credo is expected to report nearly 111% YoY growth to $1.42 in adjusted EPS, driven by strong topline growth and a projected 14 point expansion in adjusted operating margin.

Free Cash Flow Margin of 32%, But Likely Will be Lower in FY26

Credo’s cash flow margins surged on strong collections, while its balance sheet remained robust with debt still at zero.

  • Operating cash flow was $57.8 million in Q4, up more than $53 million QoQ on higher “cash collection driven by the significant sequential product ramp.” OCF margin was 34% in the quarter, compared to 3.1% last quarter and 6.8% a year ago. For FY25, operating cash flow was $65.1 million, for a margin of 14.9%. This decreased from a 17% margin in FY24 as cash flow growth of 99% YoY lagged revenue growth by 27 points.
  • Free cash flow was $54.2 million in Q4, for a 31.9% margin. For FY25, free cash flow was $29 million, for a 6.6% margin, down from an 8.9% margin last year on higher capex. Credo mentioned that it expects capex to double YoY in FY26 on upcoming 3nm product tape-outs, which may pressure FCF through the year.
  • Cash and equivalents totaled $431.3 million, while debt remained zero.
  • Inventories were $90.0 million, up more than 69% QoQ and up 148% in two quarters. This implies Credo is preparing for its new products and new hyperscalers to ramp and hypergrowth to continue.

Tariff Impacts Downplayed

Importantly, despite its China exposure, management downplayed tariff impacts. China specifically accounted for 18.2% of revenue through Q3, but when including Hong Kong, China-related exposure is 75.4%, due to Hong Kong revenue nearly tripling YoY through Q3 to $152.7 million. Credo noted that geographic revenue represents shipment destination or location of contracting entity, which could be different from customers’ principal offices.

In the Q4 call, Needham’s Quinn Bolton pointed out that Credo’s AEC manufacturing partners BizLink and FoxLink are both located in China, questioning management about how tariffs could impact margins.

CFO Dan Fleming said Credo does not expect a “significant tariff risk” to gross margins and it is not the cause of Q1’s sequential guide down. CEO Bill Brennan was more vague on tariffs, saying Credo was “monitoring the situation closely and we're working very closely with our customers, and ultimately, we're trying to be as flexible as we can,” and in the worst case, Credo “could be out of one geographic location and into another” within months.

The more important question for Credo here is if it can accelerate and maintain strong revenue growth while potentially onshoring manufacturing over the next few years to mitigate future tariff risks.

Conclusion

It’s hard to nitpick much in Credo’s Q4 report aside from China revenue, which likely remained elevated given the geographic mix as of Q3. Management highlighted two additional hyperscalers ramping in mid and late-FY26, providing tailwinds to growth as these new projects ramp.

Analysts are only projecting 3% to 4% sequential growth through FY26, which seems low given that Credo guided for double-digit sequential growth in Q1 while highlighting those new customers ramping and more opportunities in optics as FY26 progresses.

The I/O Fund owns AI networking stocks that are linked to Nvidia and custom silicon projects such as Amazon’s $100B capex including Trainium. We share our portfolio with Pro and Advanced Members. Advanced Members also receive real-time trade alerts, entries, exits and trade plans in our weekly webinars. Take advantage of a limited-time offer for $75 off Pro or $100 off Advanced. Email us to upgrade

Damien Robbins, Equity Analyst for the I/O Fund, contributed to this analysis.

Please note: The I/O Fund conducts research and draws conclusions for the Fund’s positions. We then share that information with our readers. This is not a guarantee of a stock’s performance. Please consult your personal financial advisor before buying any stock in the companies mentioned in this analysis.

Recommended Reading:

  • Amphenol Reports 134% Growth in Datacom IT Segment
  • TSS Inc.: Downwind of the AI Infrastructure Spending Boom; Helps to Alleviate Tariffs for Dell
  • Jabil’s Strong AI Growth Overshadowed by a Myriad of Weak Segments
  • Vertiv Q1: Inflection Point Muted by APAC, AI Factories Catalyst for 2026
Posted in AI Stocks, Data CenterLeave a Comment on Credo Reports 180% YoY Growth and 20% GAAP Operating Margin

Can AMD’s MI350X and MI355X GPUs Close the Gap with Nvidia?

Posted on June 20, 2025June 30, 2026 by io-fund

This article is a continuation of our free newsletter from June 19, AMD vs Nvidia: The AI Stock That Could Win by 2028

Find out the following below: 

  • We compare AMD’s MI350X and MI355X with Nvidia’s B200s and GB200s to decipher if AMD has what it takes to close the gap with the AI leader 
  • Clear conclusions on the next 1-2 years that are tailored for stock investors and how we plan to position our portfolio  
  • The SKU that all investors should know about 

Last week, AMD introduced its Instinct MI350 series GPUs, including MI355X with up to 4X performance over the previous MI300X generation and up to 40% more tokens per dollar compared to Nvidia’s B200 accelerators. The company also previewed its Helios rack-scale server architecture featuring the MI400s for 2026 deployments. 

According to Tom's Hardware AMD is claiming the eight-GPU MI355X system is 1.3X faster than Nvidia’s DGX GB200s systems with Llama 3.1 and up to 1.2X faster than the B200 HGX systems in inference for DeepSeek R1 with equivalent performance as Llama 3.1 when tested at FP4. 

Here are a couple of key points in terms of how AMD is starting to close the gap with Nvidia for inference purposes: 

Floating point precision: 

AI accelerators are increasingly offering lower floating-point formats to help reduce memory consumption and bandwidth requirements, which in turn speeds up computation and lowers power consumption. For example, FP8 delivers better throughput and energy efficiency in LLM inference compared to FP16. The newer generations of GPUs will offer FP4 formats to further alleviate memory-bandwidth bottlenecks and improve performance for large matrix operations. 

I elaborated on the importance of floating-point precision in my analysis “Here’s Why Nvidia Will Reach a $10 Trillion Market Cap” when I stated: “The difference is that the smaller bit size allows for an economical way to achieve more speed when giving up a small amount of accuracy doesn’t make a critical difference. As discussed, this also helps in the face of a slowing Moore’s Law.” 

With the MI350X and MI355X, AMD is introducing FP4 along with the smaller formats of FP8, FP6 and FP4, which are especially helpful for inference. In the CDNA 4 architecture, the FP6 data rate shares the same peak PFLOP/s as FP4 — which for inference purposes means it will be comparable to or slightly exceed Nvidia’s B200s.  

ServetheHome states, “AMD is doing the higher performance (at a transistor cost) option of adding FP6 to the FP4 pipeline to give it a big boost.” 

Source: Tom’s Hardware, pictured above – FP6 performance is on par with FP4 performance.  

HBM3E and HBM4 Memory: 

AMD is attempting to compete on memory by slightly beating Nvidia with the MI355X having 1.6x more memory capacity than the B200s. This allows AMD to load full model weights into memory for fast inference and avoids having to share resources between multiple GPUs. The higher amount of memory also increases the batch size, which increases throughput while lowering latency.  

It’s important to keep in mind that Nvidia is preparing to send a shockwave through the AI market, once again, with its NVL72 and NVL36 systems. These systems combine 72 GPUs and 36 GPUs to think like one GPU, which I’ve covered recently here.covered recently here. 

Rather than AMD taking head-on Nvidia’s NVL72s and NVL36s right now – which are earth-shattering SKUs — the company is instead attempting to compete at the 8-GPU system level. Memory is a big part of that attempt. Inference craves low latency, thus having the model fit entirely in memory for inference purposes is a part of that strategy.  

What’s Important About the MI350X and MI355X: 

To put it plainly, on the AI accelerator front, this will be the first time that AMD will overlap Nvidia in terms of benchmarks on GPUs. Please do note, the amount of time that AMD’s current generation of GPUs and Nvidia’s GPUs overlap will be brief – and will only be at the single GPU and 8-GPU system level. AMD was originally expected to ship the MI350s at the end of this year yet are moving the shipments up – which fits with AMD’s tradition of underpromising and overdelivering.  

However, the accomplishment is noteworthy as it’s setting the tone as the inference market begins to ramp. In other words, AMD ceded the training market to Nvidia – but I do not expect that to be the case with the inference market. 

When Blackwell Ultra ships, the B300s will offer FP4 TFLOP/s that is 1.3X faster than AMD’s current MI350X and MI355X. With that said, because AMD has prioritized competing on memory — its bandwidth and capacity is expected to be on par with Blackwell Ultra. 

AMD’s CDNA 4 Architecture: 

The primary architectural changes of CDNA 4 were aimed at increasing memory capacity and bandwidth per compute unit. The lower precision compute capacity was also increased, favoring FP6 and FP4. 

AMD’s architecture is built on a chiplet design, and similar to the Zen-2 architecture discussed above, the chiplet design offers power efficiency improvements from monolithic designs by offering a dozen chiplets on a single processor.  

Although monolithic used to be preferable, to compare, Nvidia’s has evolved its architecture to utilize multi-die modules (MCM) which combines two reticle-limit dies. By utilizing high bandwidth connections, the two dies function as a single die to forego reticle-size constraints, helping to improve yields and results in higher performance. 

However, keep in mind that AMD was first to market with chiplets in the Zen architecture that helped stage the company’s comeback. Nvidia is the world’s best AI semiconductor design company, yet the point is that AMD is not necessarily a follower. In some design areas, AMD leads. 

A few more things to highlight from last week’s announcements: 

  • 3D packaging with CoWoS-S from the MI300s remains with XCDs, HBM3 memory, I/O Dies and the Infinity cache 
  • There are a total of 256 compute units with eight 32 CDNA per XCD. This is less than the last generation yet with the 3nm, each compute unit delivers more power 
  • There are two larger I/O Dies rather than four for better efficiency. The I/O Dies are built on a 6nm process. 
  • More memory at 288GB of HBM3E with 8TB/s 

MI400s “Helios” Will Close the Gap on Larger AI Clusters 

The market is forward-looking, which means investors should be too. AMD is closing the gap on single GPUs and 8-GPU systems, yet the MI400s will mark a pivotal moment as AMD will attempt to compete on rack-scale systems with Helios, its 72-GPU systems. If things go as planned, AMD will be competitive with Nvidia on GPU, memory and interconnect performance — while potentially taking the lead on memory capacity and bandwidth.  

By using UALink and potentially Broadcom’s scale-up ethernet, AMD will be able to deliver considerable bandwidth, with projections of 31 TB of HBM4 memory and 1.4PB/sec of bandwidth, which would beat Nvidia’s offerings by 50%. 

UALink, or Ultra Accelerator Link, is an open industry-standard interconnect that enables high-speed and low-latency communication for AI clusters. This is a joint venture between a consortium of Nvidia competitors, including AMD, Intel and Broadcom, to take-on Nvidia’s proprietary NVLink. The first generation of UALink supports 1.28 TB/s of bandwidth for systems of 4 to 8 accelerators while future generations will support racks of 72 accelerators and more. 

Conclusion: 

Judging by the poor stock performance over the past 1-2 years, the market thinks AMD is down for the count. I think it’s the nuances of AI training versus inference (and timing of those markets) that has made AMD appear to be inconsequential to AI hardware. Although I do not foresee AMD surpassing Nvidia in terms of market cap by a long shot, I believe it’s highly probable that AMD’s returns outpace the AI leader due to the sheer amount of revenue growth hidden within AI inference. Specifically, inference is expected to be a larger market than training, and AMD’s strengths will finally be on full display.  

My current prediction is that AMD does not need to even come close to overtaking Nvidia on revenue or market cap for the stock performance to exceed Nvidia's over the next few years. Rather, the unforeseen second wind from GPUs and AI systems will be enough to make second place the most rewarding era in AMD’s history.

Please note: The I/O Fund conducts research and draws conclusions for the company’s portfolio. We then share that information with our readers and offer real-time trade notifications. This is not a guarantee of a stock’s performance and it is not financial advice. Please consult your personal financial advisor before buying any stock in the companies mentioned in this analysis. Beth Kindig and the I/O Fund own shares in NVDA and AMD at the time of writing and may own stocks pictured in the charts.

Recommended Reading:

  • This AI Stock is Set to Surge from Inference Demand — Broadcom
  • Palantir Stock: Strong Sequential Growth and Strong Underlying Key Metrics
  • Taiwan Semiconductor: Building a Moat under Geopolitical Tensions
  • Dell Riding Nvidia’s Tailwinds to Record $12.1B in AI Server Orders in Q1
  • Nvidia Q1/Q2 Guide: Blackwell is (Finally) Here
Posted in AI Stocks, SemiconductorsLeave a Comment on Can AMD’s MI350X and MI355X GPUs Close the Gap with Nvidia?

AMD vs Nvidia: The AI Stock That Could Win by 2028

Posted on June 20, 2025June 30, 2026 by io-fund
AMD vs Nvidia: The AI Stock That Could Win by 2028

Last week, AMD offered more details on the release of their groundbreaking GPUs with little fanfare in the markets – which is par for the course as AMD has a history of being forgotten about until the company can no longer be ignored. 

Five years ago, I dubbed AMD the “Dark Horse” for my premium research members as the company had a mere 4% share in the CPU-data center and was up against the near-monopoly of Intel. The term “Dark Horse” refers to a competitor that unexpectedly achieves victory as I was predicting AMD would eventually overtake Intel.  

Two quarters ago, AMD posted CPU server market share of 39.4% — officially surpassing Intel.  

In the technology industry, the probability of an underdog successfully taking on a first-place contender with a formidable lead is incredibly rare. Yet, there is an element of catching the market off guard that helps to compound the returns. The opposite of this is known as a crowded trade. 

Does AMD have what it takes to overtake Nvidia on stock performance in the next few years? Most investors assume Nvidia will continue to dominate — and AMD will remain a distant second. In this piece, I’ll walk you through why AMD’s positioning in the AI cycle could lead to an outcome few are prepared for. 

Background on what AMD Achieved  

When Lisa Su became CEO of AMD in 2014, the company was on the brink of bankruptcy, operating at a loss from 2012 to 2017. The huge bets the company made with the Zen architecture were bold, and saved the company from going under.

Chart showing how AMD’s 2017 Zen architecture helped boost margins and turn the company profitable

Pictured above: The Zen architecture released in 2017 helped AMD move from deep in the red to the black on margins. Source: MacroTrends 

Examining how AMD was able to stage the comeback through architectural changes in CPU architecture, process technology, and chiplets is key for investors as not only did it result in over 3,600% returns in 10 years, but the company is now setting up to become a strong contender in the GPU server market.

Line chart comparing Nvidia and AMD stock returns in 2022 before Nvidia’s breakout, questioning if AMD will catch up

Pictured Above: In 2022, Nvidia stock and AMD stock has seen returns in the same zip code before Nvidia’s meteoric rise. Will AMD catchup in the coming years? Source: YChartsYCharts 

AMD Released the Zen 2 Architecture in 2019: 

Five years after Lisa Su became CEO, AMD was preparing to not merely survive but rather to rival Intel. The Zen 2 architecture was an important release that allowed AMD to leapfrog Intel with a 7nm chip while Intel was still producing 14nm and 10nm chips. Because 7nm are twice as dense as 14nm, AMD was able to release a 64-core server chip and 128 threads rather than AMD’s previous 32-core server chip. Up until early 2019, Intel’s offering has been a 28-core server chip and 64 threads. The result of being first to the 7nm is that AMD was able to produce a more power efficient chip that allowed more cores. 

The Zen-2 architecture also introduced a multi-chip module that used the most advanced technology where it’s needed most by combining 7nm chiplets with a 14nm die. This was quite a competitive leap as Intel was still using a monolithic design. 

In this case, the 14nm was leveraged for memory controllers because the central hub runs input/output (I/O) and memory better. This helped AMD beat Intel on memory bandwidth. The design also greatly improved performance by putting the L2 cache on the core and the L3 cache across the core. Overall, these design improvements lower the power required while increasing the performance as it requires fewer NUMA hops, which in turn, increases instructions per clock, and this ultimately reduces latency. 

AMD’s second-generation EPYC server processors sparked the company’s comeback with 1.8 to 2 times the performance advantage of Intel’s Xeon processors, but perhaps most importantly, EPYC 2nd Gen was at half the cost as Intel in some instances. Undercutting Intel on price became a virtuous cycle as driving down costs means more chips will be bought from AMD.  

In a 2021 webinar on AMD’s stock that I held for Premium Members, I noted at the time that a third-party analyst named Michael Larabel benchmarked AMD as being 14% faster than Intel while costing about 30% less. The result is that for every $1.00 Rome chip sale, Intel lost $2.25 in Xeon SP sales. The savings can then be deployed to buy more Rome chips to further depress Intel’s revenue. 

Since the Rome Series, AMD has been able to take more market share with the Milan Series and Bergamo Series with improvements such as 3D stacking in Zen3, tripling the L3 cache size while only adding four clock cycles of latency, and further customizing CPUs for cloud native workloads with less cache and more performance per watt. Genoa was the 4th generation, and provided more cache for general purpose workloads.

AMD versus Nvidia: Why Memory Gives AMD an Inference Edge  

The word “inference” will come up a lot in the coming years for AI investors, and thus, it makes sense to have a brief discussion on how it differs from training.

  • Training: 

Training is the process of a model learning patterns from labeled data through internal parameters (called weights). There is forward and backward pass or propagation for updating the parameters. This phase is computationally intensive, requiring significant memory and parallel processing power.  

Training is where Nvidia’s strengths are nearly insurmountable as the leader in combining parallel processing (CUDA) cores with matrix computations (Tensor Cores). Over the past few years, Nvidia has increased compute power by an order of magnitude to the point of defying Moore’s Law with architectural changes such as tensor cores and lower precision floating points.  

For example, the H100 is able to switch from a 16-bit floating point to 8-bit floating point to significantly increase training speed by requiring less memory and speeding up data transfer operations. The transformer engine in the Hopper generation helps models to apply self-attention to detect how data elements in a series influence and depend on one another. 

The second-generation transformer engine in the Blackwell architecture offers FP4. This is helpful because AI models are moving toward neural nets that lean on the lowest precision and yet still yield an accurate result. In this case, 4 bits double the throughput of 8-bit units, compute faster and more efficiently, and require less memory and memory bandwidth. 

The premiere SKU shipping now is the GB200 NVL72, which delivers real-time trillion-parameter LLM inference, 4X LLM training, 25X energy efficiency, and 18X data processing. The GB200 also provides 4X faster training performance than the H100 HGX systems and includes a second-generation transformer engine with FP4/FP6 Tensor core. The 4nm process integrates two GPU dies connected with 10 TB/s NVLink with 208 billion transistors. 

The point is that taking on Nvidia’s lead in training is not AMD’s goal. You can, of course, use AMD’s GPUs for training, but this isn’t where AMD can feasibly compete – and thus, its stock has suffered during the LLM training boom. Since the launch of Nvidia’s Ampere in May of 2020, the stock is up 1700% compared to AMD’s 135%.  

You can read more about the history of Nvidia’s GPU architectures including Blackwell in the analysis: "Here’s Why Nvidia Stock Will Reach $10 Trillion Market Cap."

  • Inference: 

Inference takes batches of real-world data and quickly comes back with an answer or prediction — therefore, this stage needs low latency (or speed) over raw compute power. For example, inference will take a trained model and produce a probable match for new data in milliseconds. While it can be compute-intensive for large models like GPT-4, inference generally prioritizes low latency, higher efficiency, and lower cost.  

In many applications, it makes sense to run inference at the edge (closer to where data is generated). However, cloud inference is still widely used for models that are too large or resource-demanding to deploy on local devices. Compared to training, inference requires only the forward pass through the model, making it more efficient in terms of power and hardware demands. 

If we go back and look at how AMD was able to take on Intel — briefly, it was with an architecture that required less power at nearly half the cost. This helps illustrate that AMD’s strengths are a much better fit for inference rather than training.

Can AMD’s MI350X and MI355X GPUs Close the Gap with Nvidia? 

Last week, AMD introduced its Instinct MI350 series GPUs, including MI355X with up to 4X performance over the previous MI300X generation and up to 40% more tokens per dollar compared to Nvidia’s B200 accelerators …

Below, I tell you key things about AMD’s upcoming release and whether AMD has the chance to close the gap with Nvidia …

Find out the following below: 

  • We compare AMD’s MI350X and MI355X with Nvidia’s B200s and GB200s to decipher if AMD has what it takes to close the gap with the AI leader 
  • Clear conclusions on the next 1-2 years that are tailored for stock investors and how we plan to position our portfolio  
  • The SKU that all investors should know about

Subscribe now and save $100 off our Advanced plan or $75 off our Pro plan.Subscribe now and save $100 off our Advanced plan or $75 off our Pro plan.

Our five-year cumulative returns of 210% would place us as #2 if we were a hedge fund and #5 if we were an ETF.
Subscribe to continue reading

Paid subscribers, click here to view the full articleclick here to view the full article

Not ready to subscribe but want more thoughtful analysis from a top-performing team in tech? Every week, we publish free research. 👉 Sign up here.ere.ere.

Please note: The I/O Fund conducts research and draws conclusions for the company’s portfolio. We then share that information with our readers and offer real-time trade notifications. This is not a guarantee of a stock’s performance and it is not financial advice. Please consult your personal financial advisor before buying any stock in the companies mentioned in this analysis. Beth Kindig and the I/O Fund own shares in NVDA and AMD at the time of writing and may own stocks pictured in the charts.

Recommended Reading:

  • This AI Stock is Set to Surge from Inference Demand
  • Taiwan Semiconductor Stock: AI Growth Amid Geopolitical Risk
  • Nvidia Stock Faces a Choppy Q2, But Tailwinds Build for H2 Acceleration
  • Microsoft Stock Surges After Q3 2025 Earnings: What Separates Azure from AWS, Google Cloud
Posted in AI StocksLeave a Comment on AMD vs Nvidia: The AI Stock That Could Win by 2028

Amphenol Reports 134% Growth in Datacom IT Segment

Posted on June 13, 2025June 30, 2026 by io-fund

Amphenol plays an important role in Nvidia’s NVL72 racks that are shipping now, as the company supplies high-speed copper cables and interconnects. Nvidia’s choice to use copper cabling over optical transceivers resulted in both lower costs and power savings for the NVL72, providing a growth opportunity for Amphenol. Specifically, Amphenol's 12VHPWR PCIe 5.0 power connector was able to eliminate the need for three power connectors with a single power connector. 

Unlike other GPU-agnostic players who can realize growth and tailwinds as long as AI capex remains strong, Amphenol is more closely correlated to Nvidia’s NVL72, and its opportunity thus arises squarely from the ramp of the platform and overall shipment volumes. Signs that Nvidia is now quickly ramping NVL72 shipments far ahead of analyst expectations support more growth ahead for Amphenol in the upcoming quarters.  

However, Amphenol remains quite highly exposed to slower-moving sectors such as the industrial and automotive sectors, and cash to debt is upside-down due to its focus on M&A to complement growth. 

Nvidia’s Choice for Copper over Optics  

Although we have discussed the industry’s transition to optical modules for AI due to the rising data requirements and ability to solve the bandwidth bottleneck, for now, Nvidia is foregoing optics for copper in the GB200 NVL72 for two main reasons: cost and power.  

Should Nvidia have selected to use 1.6T twin-port optical transceivers, power consumption for the NVL72 would have been ~20kW higher at up to 140kW, as it would have needed 648 modules (72 ports times 9 NVSwitch trays) each consuming ~30W.  

The GB200 NVL72 was already severely pushing the limits of data center cooling infrastructure, and overheating issues were the rumored primary cause of shipment delays. Ditching optics helped drive power consumption lower without constraining performance.   

Transceiver costs are also quite expensive, and at ~$900 per module, this would equate to over half a million in added costs per rack, before Nvidia’s margin markup. These additional costs and added power consumption would throw NVL72’s TCO out the window.  

Copper results in lower cost and power consumption with copper cables approximately one-sixth of the cost at ~90% lower power consumption. Additionally, Amphenol’s Paladin HD and Paladin HD2 backplane interconnect cables provide up to 224G PAM4 data transfer rates, the same as a similar 1.6T transceiver, with low insertion loss and high performance. These cost and power advantages make copper a more suitable selection for the rack scale platform for both TCO for customers as well as overall power draw. 

Amphenol’s Role in Nvidia’s GB200 NVL72 

Amphenol’s opportunity arises from Nvidia’s use of copper cabling combined with its Paladin backplane and connectors. A report from SemiAnalysis states that the NVL72 backplane features these components from Amphenol: 

  • A total of 144 Paladin HD 224G connectors (72 male, 72 female) for the NVLink5 connector 
  • 5,184 SkewClear EXD Gen 2 cables 
  • 36 Paladin HD 224G connectors for the backplane 
  • 36 2 UltraPass OverPass 224G connectors terminating to a Paladin HD female connector 
  • 4 DensiLink OverPass cables  

Amphenol’s Paladin HD and HD2 connectors support both 800G and 1.6T PAM4 bandwidth requirements, maximized for performance with a 50% density increase versus the first-gen Paladin, allowing for more connections in limited PCB spaces. Amphenol says the connectors have the lowest crosstalk in the market and low insertion loss, which are critical for high-speed data transmission. The connectors are versatile, supporting direct backplane traces and cable-based architectures, enabling flexible deployment options in different server rack designs.  

The SkewClear EXD Gen 2 cables also support 800G and 1.6T PAM4 bandwidth requirements and were designed for maximum reach and density for OSFP, Paladin HD2, and UltraPass-based systems. The cables offer better signal integrity than traditional PCB or standard twinax and lower insertion loss, while Amphenol says it can offer customers the “lowest total applied interconnect link cost” for OverPass assemblies.  

The UltraPass OverPass 224G assemblies are the highest differential pair count interconnect available on the market, offering full 1.6T support, high signal integrity performance with low loss interconnect. Amphenol says it also reduces overall system costs by eliminating the need for re-timers and PCB laminates. The interoperability with SkewClear cables and Paladin connectors provides high performance in dense, thermal-constrained racks, hence Nvidia’s selection of the products. 

The DensiLink OverPass cables create a double-ended high performance cabling interconnect and remove high speed signaling from the PCB, allowing for reduced design complexity and lower PCB costs. Nvidia used the DensiLink cables in the DGX H100/H200 platform to connect the CX7 networking chip to the OSFP ports.  

GB200 NVL72 Shipments Accelerating, What This Means for APH

Amphenol’s dollar content per NVL72 rack is expected to be quite high — Evercore ISI estimated last year that Amphenol’s BOM content was in the range of $100,000 to $120,000 per NVL72, or around 3-4% of the server’s value. This represents a fairly large opportunity for Amphenol, especially if Nvidia is scaling shipments to a much larger degree than currently anticipated. 

As we had discussed in our post-earnings Nvidia analysis, the GB200 NVL72 has ramped from ~1K racks in all of Q1 to ~1.5K racks for April, now to ~1K racks per week as of the end of May, per Jensen Huang: 

“On average, major hyperscalers are each deploying nearly 1,000 NVL72 racks or 72,000 Blackwell GPUs per week and are on track to further ramp output this quarter.” 

Analysts were estimating Nvidia’s quarterly rack shipments to reach 4-6K in Q2, building on April’s ramp, before reaching 8-10K shipments in Q3; however, Huang’s comments imply that Nvidia is shipping at a much faster cadence, more along the lines of 12K racks per quarter, assuming the broader supply chain can support maintaining the 1K/week volume.  

Nvidia’s statement that Blackwell revenue was nearly 70% of data center revenue in the quarter implies QoQ growth of nearly 120% to around $24 billion, as shipments begin to tick higher. Rough math implies hyperscalers are now deploying $3 billion every week of the NVL72 and ramping higher, or a $39 billion quarterly run rate.  

For the full-year, NVL72 estimates still have a rather wide range, given the slow start to the year and limited visibility (until now) of the pace of the ramp. Nomura estimates that NVL72 rack shipments will reach ~20K for the year, while JPMorgan places shipments at 25K, with a stronger ramp into year-end.  

Despite the strong ramp commentary and implied growth rates, analyst estimates for Nvidia have yet to be revised higher, suggesting that either there is an expectation for supply chain bottlenecks to constrain shipment growth or that there is room for shipments to meaningfully exceed estimates moving forward.   

Dramatic Token Growth Supports Strong GB200 Ramp 

While the ultimate pace of the GB200 ramp may boil down to Nvidia’s complex supply chain and the quarterly or weekly output volumes that it can sustain, strong token generation growth and high demand for AI services at the hyperscalers supports the accelerated ramp the platform is seeing. 

Morgan Stanley says that “every hyperscaler has reported unanticipated strong token growth,” and that “everyone we talk to in the space is telling us that they have been surprised by inference demand, and there is a scramble to add GPUs.” The firm adds that “LLM cloud customers are requesting that in lieu of GB200 availability, their cloud partners add capacity of Hoppers and B200s.”  

This is further supported by recent token growth statements from Microsoft and Alphabet. Microsoft stated in its Q3 earnings call at the end of April that it “processed over 100 trillion tokens this quarter, up 5x year-over-year, including a record 50 trillion tokens last month alone,” implying a sharp uptick in inference activity at the end of their fiscal quarter.  

Nvidia revealed that Microsoft is expecting to ramp its GB200 capacity significantly: “Microsoft, for example, has already deployed tens of thousands of Blackwell GPUs and is expected to ramp to hundreds of thousands of GB200s with OpenAI as one of its key customers.” Quick back-of-napkin math shows that Microsoft could be ramping from 500 to 1,000 NVL72 racks to 5,000 racks to go from 36-72K GPUs to ~360K GPUs. 

Alphabet also highlighted at its I/O 2025 Developer’s Conference that its monthly tokens processed were surging, up 50x YoY in April 2025 to more than 480 trillion. This is far, far above Microsoft’s volume, likely due to the prevalence of AI overviews in Search handling billions of visits. Growth in tokens price began accelerating exponentially in February, more than doubling in just two months.  

Source: Alphabet 

Nvidia also backed this up in the earnings call at the end of May, stating that they also are “witnessing a sharp jump in inference demand [as] OpenAI, Microsoft and Google are seeing a step function leap in token generation.” Nvidia added that companies are seeing higher token generation rates with Blackwell: “inference serving startups are now serving models using B200, tripling their token generation rate and corresponding revenues for high-value reasoning models.”  

The GB200 NVL72 provides significant boosts to token generation (throughput), allowing the hyperscalers and tier 2 CSPs like CoreWeave to handle increasingly large inference requests and serve these at lower costs. Nvidia claims that the NVL72 can offer up to 116 tokens per second per GPU, a 30x increase to the HGX H100’s 3.5 tokens per second per GPU on GPT-MoE-1.8T. This performance increase drives higher revenue for cloud providers such as CoreWeave and Microsoft’s Azure, and the NVL72 currently is the only platform that can sustain token growth at this exponential pace and scale. 

Amphenol’s NVL72-Driven Revenue Opportunity 

Blackwell’s ramp over the next few quarters could drive hundreds of millions to $1 billion-plus in revenue for Amphenol due to its rather high dollar content per NVL72 rack. Based on the $100K to $120K BOM content, each 1,000 racks shipped could correlate to $100 million to $120 million in revenue for Amphenol. Thus, the revenue potential for Amphenol stemming from the NVL72 is dependent on rack volumes, which are now accelerating.  

For example, Q2’s estimated shipments could translate into a $400 million to $720 million revenue opportunity for Amphenol, while Q3’s could translate into $800 million to $1.2 billion revenue opportunity. However, if Nvidia is pushing the pace towards 12,000 racks per quarter, that could translate into $1.2 billion to $1.44 billion for Amphenol.  

Assuming that the NVL72 opportunity also carries a slightly higher margin, such as at around 30%, this could provide some tailwinds to earnings as well – at $400 million in revenue, this would provide $0.10 in EPS, while the $1.2 billion opportunity could contribute at least $0.30 in EPS. Though this seems small, $0.10 to $0.30 represents 16% to 48% of Q1’s adjusted EPS. 

Component sourcing timelines and revenue recognition dates likely means that Amphenol’s revenue will ramp quarter(s) in advance of Nvidia’s shipment ramp given the essential nature of Amphenol's components. Amphenol noted in its 10-K last quarter and its 10-Q this quarter that it does not have significant concentration with any single counterparty, implying that Nvidia remains a <10% customer, or below $480 million in revenue in Q1. Morningstar also estimated in January that AI-related connector shipments reached a $1 billion annual run rate, or ~$250 million per quarter. Based on estimated BOM content and Nvidia’s shipment growth, Amphenol likely still has more revenue upside available.  

Upcoming GB300 Platform Shift 

The upcoming shift to Blackwell Ultra (GB300), with production beginning at the end of this quarter for a second half ramp, also provides an opportunity for Amphenol even as the platform is expected to work in an upgraded CX8 networking chip and 1.6T optical modules.  

Nvidia confirmed in Q1’s call that the “GB300 will leverage the same architecture, same physical footprint and the same electrical and mechanical specifications as GB200” to allow “CSPs to seamlessly transition their systems.” It is also expected that the GB300 will optimize copper cabling layouts to meet higher performance and data transfer speed requirements, resulting in 50% longer cable lengths. This design continuity should translate into stable BOM content for Amphenol as the next generation commences. 

Tariff Risks for Amphenol’s AI-Related Products 

China is not only a major market for Amphenol, contributing 16.5% of revenue in Q1 and 22.3% in 2024, but it is also home to a significant share of Amphenol’s manufacturing for connectors, interconnects, and fiber optic products.  

Amphenol does not provide an exact breakdown for its China manufacturing exposure, though three of its four facilities listed on its high-speed backplane and cable connector data sheet are located in China, meaning that its primary growth driver at the moment may be overly exposed to China tariff risks. 

In its 10-K, it was stated that the “imposition of additional tariffs or other trade barriers could increase our costs in certain markets and may cause our customers to find alternative sourcing,” or increase difficulties in selling products in some markets. This could have negative impacts on both revenue growth from lost sales and earnings from higher costs” 

On the earnings call, the word tariffs came up 23 times with analysts poking around to see what the impact could be given Amphenol has 300 facilities in 40 countries. One of the more direct statements made from the questioning was the following: “Let's say that there's a slight impact on pricing as we go into the second quarter, and our team's going to work really well to moderate whatever impact could be on the bottom line. And I think implicit in our guidance, is that our margins are still very strong in the second quarter. So that must not be a tremendous impact.” 

This led to questions on whether the current results were from a pull-in, with management stating there was a “slight pull-in" on mobile devices but not on IT datacom where demand outweighs supply. 

Financials 

Amphenol reported a significant beat in Q1, reporting revenue well ahead of consensus estimates and far above its guidance for $4.0 to $4.1 billion in the quarter. This strength was driven by 91% YoY growth in Amphenol’s Communications segment, fueled by strong demand AI data center products. Growth estimates have also been moving substantially higher throughout the rest of the fiscal year following Q1’s strong beat and a solid Q2 guide.  

Revenue Growth Accelerating on Strong AI Demand 

Accelerating AI demand drove Q1’s outperformance, with revenue coming in “much stronger than expected” at a blazing 47.7% YoY to $4.81 billion in revenue, accelerating 18 points sequentially. Organic revenue growth was 33%, accelerating 13 points sequentially.  

Q1’s report marks a tremendous growth acceleration for Amphenol, with this being its first quarter with >40% YoY growth since 2006 and a remarkable 45 point acceleration in just 5 quarters. This is impressive considering more than two-fifths of Amphenol’s business remains in longer-cycle industrial and automotive end markets.  

For Q2, Amphenol guided for revenue between $4.9 billion and $5.0 billion for YoY growth of ~37.5% at midpoint, coming in well ahead of the consensus estimate for $4.61 billion. This is likely once again driven by AI data center demand, though it points to Amphenol reaching peak growth for this ramp cycle. 

Orders Surging 

Amphenol’s orders have grown at 58% YoY for a second consecutive quarter, with growth accelerating sharply over the last few quarters.  

Management had an important comment on order growth in Q1’s call related to the datacom segment: “We weren't able to meet our expectations. We far exceeded in the quarter our and our customers' expectations of what we could execute, but they still would have taken more, if we could deliver it.” This hints of more confirmation that Nvidia’s platform ramped much quicker than expected in the quarter, and that Amphenol could have driven higher revenue and stronger growth if it had an ability to meet said demand. 

Revenue Estimates Rising Sharply 

After Q1’s revenue growth came in more than 23 points ahead of guidance, estimates for the remainder of fiscal 2025 have risen rather sharply, with growth rates now nearly 10 to 20 points higher than at the start of the year. 

  • For Q2, revenue was expected to be $4.24 billion in late January, but as of mid-May, that has been revised nearly $800 million higher to $5.01 billion as Amphenol continues capturing strong AI demand. 
  • For Q3, revenue was expected to be $4.47 billion in late January, though that has also been revised nearly $700 million higher to $5.13 billion as of mid-May. 
  • For Q4, revenue was expected to be $4.57 billion, though that has been revised nearly $700 million higher to $5.25 billion. 

Putting this together, the nature of Q1’s beat and the strength in datacom at 134% YoY has driven estimates for the next three quarters up by more than $2 billion combined. This also came before Nvidia revealed that NVL72 shipments were ramping much faster than analysts anticipate, providing a major tailwind to datacom growth in the upcoming quarters due to Amphenol’s content on the platform.   

In terms of YoY growth, here is what the revisions look like: 

  • Q2’s growth is now expected to be 38.8%, more than 21 points higher than January’s 17.5% estimate. 
  • Q3’s growth is expected to be 27.0%, approximately 16.5 points higher than in January. 
  • Q4’s growth is expected to be 21.5%, nearly 10 points higher than in January. 

Segment Breakdown: Communications Driving Revenue Growth & Quickly Gaining Share 

Amphenol has three primary reportable segments, Harsh Environment Solutions, Communications, and Interconnect and Sensor Systems, though it also breaks down sales by end market (discussed next). These segments all serve many of the same end markets, such as industrial, auto, and datacom, so the end market breakdown provides a clearer view of what’s driving growth.  

Harsh Environment Solutions includes ruggedized interconnect products, connectors and interconnect systems, specialty cables, PCBs and other products. Revenue for the segment rose 38.4% YoY, though growth was just 8% YoY organic, to $1.27 billion in Q1. The segment accounted for more than 26% of revenue in the quarter. 

Communications Solutions includes connectors and interconnect systems, including high speed, radio frequency, power, fiber optic and other systems, as well as coaxial and high speed cables. Revenue rose 90.7% YoY and 73% organic to $2.41 billion, accounting for more than 50% of Amphenol’s revenue in the quarter.  

Interconnect and Sensor Systems includes sensors, sensor-based systems and value-add interconnects. Revenue rose 5% YoY and 6% organic to $1.16 billion, or less than 24% of revenue in Q1.  

End Market Breakdown 

Amphenol serves a wide range of end markets, exposing it to both macro-related and tariff headwinds in core end markets like automotive, though strong AI demand in the datacom end market is turbocharging revenue at the moment. 

  • Datacom revenue rose 133% YoY and 134% organically to 33% of revenue in Q1, with management saying that AI (predominantly GPUs) drove approximately 2/3 of that YoY growth, alongside “robust growth in our base IT datacom business.” This was a rapid acceleration from 76% YoY and organic growth in Q4 and 60% in Q3. For Q2, management expects high single-digit QoQ growth as AI data center investments continue to accelerate.  
  • Datacom quickly emerged as the primary driver for Amphenol’s growth last year, contributing 50% of its $2.67 billion incremental revenue growth on a YoY basis. This robust growth points to datacom remaining in the driver’s seat again this year.
  • Industrial revenue rose 20% YoY and 6% organically to 20% of revenue in Q1, as “organic growth in the medical, instrumentation, alternative energy and rail mass transit markets more than offset moderations in heavy equipment and factory automation.” This decelerated from 26% YoY growth in Q4 though organic was flat at 6%. Management expects Q1 sales to remain roughly at Q1’s level.
  • Automotive revenue declined (2%) YoY and (1%) organically to 16% of revenue, as North American and Asian growth was “more than offset by a moderation of sales in Europe.” This was a slight uptick from (3%) YoY and organic growth in Q4. Management expects a slight sequential decline in Q2.
  • Communications networks (not to be confused with Communications Solutions segment) revenue rose 107% YoY due to the acquisition of the Andrew Business from CommScope, as organic growth was just 11%. Management expects high-teens QoQ growth in Q2 as it benefits from a full-quarter impact of the Andrew acquisition.
  • Defense revenue rose 21% YoY and 14% organically to 9% of revenue in Q1, driven by “broad-based growth across virtually all segments within the defense market and importantly across all geographies.” This accelerated from 16% YoY and 9% organic growth in Q4. Management expects Q2 revenue will grow in the high-single-digit range QoQ.
  • Mobile devices revenue rose 20% YoY and 20% organically to 7% of revenue, as soft tablet revenue only partially offset strong growth in smartphones, laptops and wearables. Management said Q1 benefited from some pull-in demand due to tariffs with growth accelerating from 15% in Q4. Amphenol expects a high-teens QoQ decline in Q2 as customers adjust production volumes for 2H 2025 product launches.
  • Commercial aerospace revenue rose 106% YoY but declined (3%) organically to 5% of revenue, as jetliner procurement volumes moderated. Topline growth was boosted by the addition of CIT, which was acquired in 2024. This decelerated from 137% YoY and 18% organic growth in Q4. For Q2, management expects revenue roughly equal to Q1. 

AI Opportunities but Auto, Other Risks 

Despite the AI opportunities, Amphenol remains fairly exposed to a handful of end markets that could face tariff-related headwinds through the remainder of the year – automotive, mobile devices, and even industrial.  

As tariff fears surged in April, analysts noted that the automotive industry was likely to be hit quite hard by tariffs. A CNBC report stated that analysts and executives are “expecting to see a drop in vehicle sales in the millions, higher new and used vehicle prices, and increased costs of more than $100 billion for the industry.” While tariff policy is fluctuating quite rapidly, another pressure point for the industry has arisen: higher rates. This will weigh on vehicle affordability and could serve to dampen demand, as consumers may forgo purchases or leases due to rising costs. 

The smartphone market was already on thin footing this year, with shipments rising 1.5% YoY in Q1, though IDC attributed this to a supply-side surge in shipments ahead of tariffs. IDC said this dynamic “effectively inflated Q1 shipment figures beyond levels anticipated based on underlying consumer demand trends alone,” adding that heightened geopolitical tensions between the US and China and growing tariff uncertainties were a “strong reason for concern” for 2025 growth. For the remainder of 2025, TrendForce estimated that the “best case scenario will see the smartphone market flat at best” in 2025, while the “worst case scenario is a production decline by as much as 5% YoY.”   

Industrial revenue growth has been quite slow organically at 6% in Q1, while manufacturing activity has now contracted for a third straight month, according to the ISM Manufacturing Index. Tariffs such as those on steel could pressure industrial activity, while other sectors like alternative energy remain plagued by rates impacting demand.  

Overall, auto, mobile devices, and industrial accounted for 43% of Amphenol’s revenue in the quarter, and lasting challenges to growth, with auto now in negative territory, could offset datacom strength in the upcoming quarters.  

Communications Provides Some Margin Tailwinds 

Amphenol’s margins have been relatively stable over the past four quarters, but the strong growth and increasing contribution from Communications, which is accretive to operating margin, provides some margin tailwinds. 

  • Gross margin in Q1 was 34.2%, up less than 1 point YoY and marginally lower sequentially. Gross margin has been expanding slowly, from the high 32% in late 2023 to the low 34% range. 
  • Operating margin in Q1 was 21.3%, up just 0.3 points YoY and down 0.8 points sequentially. Adjusted operating margin was 23.5%, up 2.5 points YoY and more than 1 point QoQ.  
  • Net margin was 15.3%, down 1.6 points YoY and 2 points sequentially. Adjusted net margin was 16.6%, up 1.2 points YoY and half a point sequentially.  

By segment, Communications is seeing the strongest margins, with operating margin expanding nearly 5 points YoY to 27.4%; coupled with its robust growth and the largest revenue mix at 50%, Communications offers some tailwinds moving forward for Amphenol.  

Harsh Environment Solutions’ operating margin has begun to recover, but remains below 2H 23 and early 2024 levels above 25%. Interconnect and Sensors has both the slowest revenue growth in the single digits and the lowest margins in the 18% range, providing a bit of a drag to margins.  

EPS Growth Strong in 2025, but Decelerating Sharply After 

Due to the rather stable nature of margins, Amphenol does not have much of a tailwind from operating leverage, with EPS growth mirroring revenue growth rates for this year and over the next few years.  

Amphenol reported a quite large 21.2% beat on adjusted EPS in Q1, posting $0.63 versus the $0.52 estimate. This represented growth of 57.5% YoY, accelerating from 34.1% growth last quarter. However, similar to revenue, growth is currently expected to peak in Q1 and decelerate after, though remaining quite strong. 

For Q2, management guided for $0.64 to $0.66 in adjusted EPS for growth of 47.4% at midpoint. Growth is expected to decelerate nearly 13 and 10 sequentially in Q3 and Q4 to exit the year at 25.5%, based on current analyst estimates. 

For 2025, Amphenol is expected to report 40.8% growth to $2.66 in adjusted EPS, with growth forecast to slow dramatically to the 9% range for both 2026 and 2027, in an indication that 2025 is expected to be the sole strong growth year for the company due to Blackwell’s initial ramp phase.  

Cash Flows  

Amphenol’s cash flow margins have contracted slightly, as it reaffirmed a commitment to spend more on capex to support elevated datacom demand. Cash to debt remains upside down due to the company’s M&A strategy. 

Operating cash flow was $764.9 million for a 15.9% margin, down from an 18.4% margin in the year ago quarter. OCF margin over the past three years has hovered between the 17% to 20% range, with Q1’s cash flow slightly weaker. 

Free cash flow was $580.4 million for a 12.1% margin, down from a 15.5% margin in the year ago quarter. Management expects to have elevated capex again in Q2 to support datacom growth, weighing on FCF. 

Cash and equivalents totaled $1.67 billion, while debt was $7.17 billion. Debt to equity sits at 0.7x. Amphenol has taken a very M&A forward approach, having made more than 50 acquisitions over the last decade to complement and drive growth, with 4 acquisitions since 2024 – these four have cost more than $4 billion combined. Cash and equivalents have hovered around this level for more than a year, but the nearly $3 billion YoY increase in debt due to the acquisitions further stresses the balance sheet and increases the likelihood that Amphenol will tap into more debt in the future. 

Valuation 

Amphenol is also rather richly valued, trading at a 10% premium to its 10-year PE based on FY25 EPS estimates, while at its highest cash flow ratios. These valuation risks come front and center as Amphenol looks to have put in its peak growth quarter on the top and bottom line, barring a significant acceleration.  

Amphenol currently trades at ~34.5x forward EPS, nearly 10% above its 10-year average of 31.2x. The stock trades at a slight discount to the 40x multiple it held through late 2024, although Amphenol’s quarterly EPS growth is currently forecast to decelerate rather sharply from >40% in 2025 to <10% in 2026, which does not necessarily support more multiple expansion given the breadth of this projected deceleration. 

On the top line, Amphenol is reapproaching peak multiples, trading at 5.5x forward revenue, versus its peak at 6x and its 4.5x 10-year average. Similar to EPS, Amphenol’s revenue deceleration does not easily pave a path for more multiple expansion, unless these Nvidia-driven growth tailwinds drive revenue growth much faster than anticipated for multiple quarters into fiscal 2026. 

On a cash flow basis, Amphenol is trading at record high multiples over the past twenty years, and at significant premiums to historical averages. Amphenol currently is valued at 39x operating cash flow and 52x free cash flow on a TTM basis, a 50% premium to its 26x 10-year average for OCF and a 60% premium to its 33x average for FCF. 

Conclusion 

Amphenol is benefiting significantly from its high content on Nvidia’s GB200 NVL72 platform, offering a rather large opportunity ahead for Amphenol as shipments are projected to ramp faster than anticipated over the next few quarters. However, based off current estimates, Amphenol is already passing its peak growth quarter, and this combined with a richer valuation and potential tariffs in major end markets such as auto present some risks to this growth story. As with a few stocks right now, the risk/reward favors investors who attempt to get a lower price. 

The lower margins point toward more commoditized products than others in the AI space. However, we continue to watch the company closely as NVL72 systems have only begun to ship and will ramp from here. 

The I/O Fund owns AI networking stocks that are linked to Nvidia and custom silicon projects such as Amazon’s $100B capex including Trainium. We share our portfolio with Pro and Advanced Members. Advanced Members also receive real-time trade alerts, entries, exits and trade plans in our weekly webinars. Take advantage of a limited-time offer for $75 off Pro or $100 off Advanced. Email us to upgradeNvidia and custom silicon projects such as Amazon’s $100B capex including Trainium. We share our portfolio with Pro and Advanced Members. Advanced Members also receive real-time trade alerts, entries, exits and trade plans in our weekly webinars. Take advantage of a limited-time offer for $75 off Pro or $100 off Advanced. Email us to upgrade

Damien Robbins, Equity Analyst for the I/O Fund, contributed to this analysis.

Please note: The I/O Fund conducts research and draws conclusions for the Fund’s positions. We then share that information with our readers. This is not a guarantee of a stock’s performance. Please consult your personal financial advisor before buying any stock in the companies mentioned in this analysis.

Recommended Reading:

  • TSS Inc.: Downwind of the AI Infrastructure Spending Boom; Helps to Alleviate Tariffs for Dell
  • Jabil’s Strong AI Growth Overshadowed by a Myriad of Weak Segments
  • Vertiv Q1: Inflection Point Muted by APAC, AI Factories Catalyst for 2026
  • Lumentum at Inflection Point with 20% QoQ Growth in AI-Related Segment
Posted in 5G, Data CenterLeave a Comment on Amphenol Reports 134% Growth in Datacom IT Segment

This AI Stock is Set to Surge from Inference Demand — Broadcom

Posted on June 13, 2025June 30, 2026 by io-fund

This article is a continuation of our free newsletter from June 12, This AI Stock is Set to Surge from Inference Demand. 

For our Premium Members, we discuss the following:   

  • The one thing Broadcom CEO stated that all investors MUST hear to help position for 2025-2026.  
  • The clear catalyst within Broadcom’s product portfolio and timing for this product to help push forward the next leg up in AI revenue growth. 
  • The I/O Fund’s trade setup and buy zones we are eyeing for Broadcom given its immense demand yet stretched valuation.  

What Hock Tan Said that Every Investor Needs to Hear 

There was a subtle yet important change in commentary this past quarter around Broadcom’s hyperscale customer deployment expectations.  

  • In Q4 FY25, two quarters ago, Broadcom stated that they expected each of their three current hyperscale customers to deploy 1 million XPUs across a single fabric by 2027.  
  • However, in Q2, this commentary shifted – management now said they “eventually expect at least three customers to each deploy 1 million AI accelerator clusters in 2027.”  

This implies that one or more of their four prospective customers are also planning a significant accelerator deployment in short fashion, driving Broadcom’s total revenue opportunity higher. 

There were additional hints the current estimates are too low, such as when Hock Tan stated: “Turning to XPUs or custom accelerators. We continue to make excellent progress on the multiyear journey of enabling our 3 customers and 4 prospects to deploy custom AI accelerators. As we had articulated over 6 months ago, we eventually expect at least 3 customers to each deploy 1 million AI accelerated clusters in 2027, largely for training their frontier models. And we forecast and continue to do so a significant percentage of these deployments to be custom XPUs. These partners are still unwavering in their plan to invest despite the certain economic environment.  

In fact, what we've seen recently is that they are doubling down on inference in order to monetize their platforms. And reflecting this, we may actually see an acceleration of XPU demand into the back half of 2026 to meet urgent demand for inference on top of the demand we have indicated from training. And accordingly, we do anticipate now our fiscal 2025 growth rate of AI semiconductor revenue to sustain into fiscal 2026.” 

This circles back to Q4 2024’s serviceable addressable market (SAM) forecast, when management laid out a 60% CAGR through 2027 to a $60 billion to $90 billion SAM, which AI growth is now tracking. That SAM forecast was based on its view for three hyperscalers deploying 1 million accelerator clusters, or ~$20 to $30 billion per hyperscaler. Prospective customers were not included but it was noted they could “significantly” expand the SAM should they transition to revenue-generating customers. 

The subtle shift in deployment commentary hints that Broadcom’s SAM could expand to north of $100 billion on the high end should it be able to transition just one of its prospective customers to revenue-generating. With AI growth of 60% YoY this year and next tracking SAM growth, a possible SAM expansion and thus a higher SAM CAGR suggests AI revenue could remain stronger for longer, or expand above current forecasts as 2027 rolls around. Bank of America analysts seem to share this view, saying it is “only a matter of time” before the SAM forecast is raised, “especially as the FY27 sell-side AI revenue consensus estimate is still well below $45 billion.” 

Tomahawk 6 Enabling Path to 1 Million Accelerator Clusters  

Broadcom has been quite vocal about the industry’s path to 1-million-plus accelerator clusters, constantly reiterating how its three hyperscalers “each race towards 1 million XPU clusters by the end of 2027.” This would be multiples larger than current deployments, with xAI’s Colossus supercomputer recently expanding from 100K to 200K GPUs. Broadcom has continuously re-emphasized this forecast as it represents two major growth opportunities for the company: significant growth in accelerator deployments with inference tailwinds, and even more growth in networking deployments to support these clusters.  

The shift to Ethernet and away from Nvidia’s lock-in ecosystem of GPU + InfiniBand is benefiting Broadcom, with the industry pointing to rising Ethernet demand. Arista said that momentum for Ethernet “has really shifted in the last year” while Nvidia touted that its new Spectrum-X Ethernet is annualizing at $8 billion in revenue, or $2 billion quarterly. Broadcom noted that AI networking revenue rose 170% YoY in Q2 as demand remained above expectations.  

The company is committed to remaining on the leading edge of networking with its newest Tomahawk 6 switch, the industry’s first 102.4 Tbps Ethernet switch. The next-gen switch doubled the bandwidth of its predecessor, while offering flexible deployment ability with 1,024 100G or 512 200G SerDes options, reducing switch count.  

This raw performance upgrade paves the way for >100K to 1 million accelerator clusters by allowing larger leaf-spine fabrics to be constructed, while drawing less power and keeping latency low. Broadcom exec Ram Velaga said that demand for the new switch is “unprecedented” with multiple >100K accelerator deployments “using Tomahawk 6 for both the scale-out and scale-up interconnect.” 

When discussing Tomahawk 6, management points toward the flattening of the AI cluster as an important catalyst for this product, stating: “[…] Tomahawk 6 enables clusters of more than 100,000 AI accelerators to be deployed in just two tiers instead of three … this flattening of the AI cluster is huge because it enables much better performance in training next-generation frontier models through a lower latency, higher bandwidth and lower power.” 

Additional commentary the CEO shared in terms of the AI networking opportunity was that the opportunity for scale up is 5-10X more than scale out – setting up a nice trajectory as AI clusters grow: 

“In fact, the increased density in scale up is 5 to 10x more than in scale out. And that's the part that kind of pleasantly surprised us and which is why this past quarter, Q2, the AI networking portion continues at about 40% from what we reported a quarter ago for Q1. And at that time, I said I expect it to drop. It hasn't.” 

Quick Note on Margins 

The market loves this stock – and one of the primary reasons why is its earnings power. 

Broadcom reported adjusted operating income of $9.8 billion, up 37% YoY, outpacing revenue growth by a factor of 1.8x. Adjusted operating margin was 65.3%, expanding more than 8 points YoY. Adjusted EBITDA surpassed $10 billion for the first time, for a 67% margin.  

Margins are also rather strong in both of Broadcom’s segments: Semiconductor gross margin expanded 1.4 points YoY to 69%, while operating margin rose 2 points YoY to 57%. Infrastructure Software gross margin surged 5 points YoY to an astounding 93%, while excellent execution on integrating VMWare drove operating margin 16 points higher to 76%.  

However, VMWare’s expensive price tag means Broadcom’s debt is elevated, at $67.8 billion in gross principal debt versus $9.5 billion in cash. Given the structure of Broadcom’s debt with a majority at a fixed 3.8% rate, annual debt payments are currently close to $2.7 billion. 

Quick Note on VMWare Software: 

VMWare helped drive outperformance in Infrastructure Software, with revenue growing 25% YoY to $6.6 billion in Q2, ahead of management’s expectations for $6.5 billion on successful conversion of enterprise customers from perpetual vSphere to full VMWare Cloud Foundation (VCF) software stack subscriptions. Broadcom noted that strong VCF momentum has led to double-digit ARR growth in core Infrastructure Software. However, for Q3, Broadcom guided for a deceleration to 16% YoY growth to $6.7 billion. 

For a deeper dive on VMWare, read the analysis Broadcom: Networking/ASICs Giant and The Second Largest by AI Revenue.Broadcom: Networking/ASICs Giant and The Second Largest by AI Revenue. 

Broadcom Trade Setup: 

By Knox Ridley

Like many AI related tech stocks, Broadcom appears to be in a large-degree uptrend that is not finished. The pattern that this bull cycle is tacking is a diagonal pattern, which is a 5-wave pattern that is marked with strong swings in both directions.  

Based on the historic price action, there are two scenarios that we are tracking, both suggest higher levels from here, after we see an immanent period of volatility.  

  • Blue – This scenario suggests that the 3rd wave within the larger diagonal pattern ended in December of 2024. This would mean that we are in the 4th wave correction, and that the bounce off the April lows is a bounce within this larger correction. If this is playing out, the next drop will take the shape of an aggressive, and direct 5-wave pattern that ultimately breaks through $161.50. The final targets for this drop will be $139.50 – $102. We would then turn higher for another bull cycle to new highs. 
  • Green – This scenario suggests that the larger 3rd wave is not complete. When AVGO tops, the retrace will take the shape of a messy and overlapping 3-wave pattern, which will hold over $161.50. We will then turn higher toward the $400s in the coming months. This swing higher will complete the larger 3rd wave, as we set up for the larger 4th wave correction into 2026. 

We do believe that the broad market signals are suggesting a correction is immanent. Several warning signals are also flashing in AVGO’s chart. One of which can be seen in how the last swing to new all-time highs, just before their earnings report, was accompanied with decelerating volume and momentum. In other words, though the sellers have not stepped up, the number of buyers is fading the higher we go. This is a common pattern that we see just before reversals. 

In conclusion, how AVGO corrects from here is key. If we see a 3-wave retrace that holds over $161.50, it is setting up a great buying opportunity for a move to new highs. On the other hand, if we see a 5-wave pattern develop that breaks through $161.50, we will patiently wait for lower prices, which most investors believe is impossible based on how relentless this stock continues to advance.  

Conclusion 

The shift from AI training to AI inference is becoming increasingly visible as Big Tech and model providers highlight strong growth in tokens and revenue. Broadcom has already benefited from both increasing compute and networking needs – but we think the surge in inference demand will disproportionately (and positively) flow to Broadcom’s top line and bottom line. 

This is because custom silicon’s cost advantages and ability to drive lower inference serving costs at scale creates a strong value proposition for Big Tech. As more and larger clusters are deployed to serve exploding inference demand, there will be additional long-term tailwinds for networking for the Ethernet networking giant.  

Broadcom’s FY26 visibility is improving with management expecting near 60% YoY AI revenue growth to continue, while SAM could potentially expand past $100 billion as customer engagements remain strong.  

We have plans to add Broadcom to our portfolio – keep an eye on your trade alerts and join Knox in his weekly Thursday webinar at 4:30 p.m. EST for more information on buy levels.

Upgrade to the Advanced Annual Plan – Just $599Upgrade to the Advanced Annual Plan – Just $599

Email us to upgrade now or to claim this limited-time offer.

Please note: The I/O Fund conducts research and draws conclusions for the Fund’s positions. We then share that information with our readers. This is not a guarantee of a stock’s performance. Please consult your personal financial advisor before buying any stock in the companies mentioned in this analysis.

Recommended Reading:

  • Palantir Stock: Strong Sequential Growth and Strong Underlying Key Metrics
  • Taiwan Semiconductor: Building a Moat under Geopolitical Tensions
  • Dell Riding Nvidia’s Tailwinds to Record $12.1B in AI Server Orders in Q1
  • Nvidia Q1/Q2 Guide: Blackwell is (Finally) Here
Posted in AI Stocks, SemiconductorsLeave a Comment on This AI Stock is Set to Surge from Inference Demand — Broadcom

This AI Stock is Set to Surge from Inference Demand

Posted on June 13, 2025June 30, 2026 by io-fund
This AI Stock is Set to Surge from Inference Demand

Broadcom stock joined Nvidia, Alphabet and Microsoft in calling out surging AI inference demand, noting that this rapid growth could drive increased demand for custom silicon in the second half of 2026, and with it, higher AI revenue. 

Despite an in-line print and guide, Broadcom’s AI revenue is tracking above Street estimates for next year towards the $30 billion mark, up nearly 150% in two years, with growing tailwinds from inference and networking as clusters increase in size. AI revenue growth is also tracking Broadcom’s addressable market forecast of a 60% CAGR.  

Broadcom is cementing itself as the clear second in AI with key ingredients for success as inference demand rises. However, its premium valuation to Nvidia looks to be pricing in above-expected AI revenue growth into 2027, likely closer to a 70%+ CAGR, as there exists a $160 billion gap in AI-driven revenue between the two. 

Inference Driving Possible Acceleration into 2H 26 

The AI ecosystem’s pivot from training to inference, now emerging as a strong revenue engine for hyperscalers, is a structural tailwind for Broadcom's custom silicon and networking products.  

We’ve seen quite a handful of signs over the last couple of months that inference demand (and revenues) are beginning to explode: 

  1. Microsoft reported 5x YoY growth in tokens processed to 100T in Q1, with AI contributing 16 points or nearly half of Azure’s 33% growth last quarter. Microsoft’s AI run rate at the end of January was $13 billion, up more than 175% YoY. 
  2. Alphabet reported 9x YoY growth to 480T tokens processed in April. 
  3. OpenAI this week announced that it had crossed $10 billion in ARR, nearly doubling from $5.5 billion at the end of 2024. 
  4. Anthropic’s ARR rose 200% in five months and 50% in 2 months to $3 billion. 

With hundreds of millions of users interacting frequently with AI assistants, inference becomes the focal point for providers such as OpenAI and Google. Meeting these levels of growing demand, without significant response delays or downtime, requires more and more accelerators, networking and interconnect products.  

Broadcom’s edge goes beyond the fact that custom accelerators are often multiples cheaper than Nvidia’s GPUs for inference tasks – it's that custom silicon is increasingly performant with each generation. By optimizing algorithms (software), Big Tech can drive higher performance from large language models (LLMs) — which helps to drive down costs while also increasing output for specific workloads. For example, a rough idea as to how much it costs Nvidia to make merchant GPUs is estimated around $3,000 to $5,000 whereas the company charges $25,000 to $30,000 – hence the AI leader’s excellent margins. Reducing Nvidia’s high pricing power is what Big Tech is after and this can be accomplished both in the hardware costs but also through optimizing the workloads for specific use cases. 

Big Tech is prominent in Broadcom’s custom silicon customer list, which includes Google and Meta. ByteDance reportedly emerged as the third customer last summer, though some reports surfaced earlier this year that this project could be cancelled. OpenAI and Apple are also heavily rumored to be prospective customers. 

Why Big Tech Is Chasing Cheaper Inference 

For the providers in the AI ecosystem, monetizing GPUs depends on inference, and thus revenue becomes a function of GPUs and tokens and profits become a function of cost. Nvidia’s Blackwell offers a massive leap in performance and can train models such as Meta’s Llama 3.1 405B in as little as 27 minutes, yet the cost advantages offered by custom silicon can translate into higher margins in the long run from lower inference serving costs.  

For example, Google recently announced that its upcoming seventh-gen TPU Ironwood is its “most performant and scalable custom AI accelerator to date, and the first designed specifically for inference.” Ironwood comes in two sizes, a 256 and a 9,216 chip configuration, with the larger size offering up to 42.5 exaflops of performance.  

Google adds that Ironwood offers 2x the performance per watt as last-year’s generation Trillium, with 6x more HBM and 4.5x the HBM bandwidth. This allows it to deliver more capacity per watt at a time when power is a primary constraint, and provide customers with more cost-effective AI workloads. 

This is exactly what Broadcom sees arising from this inference growth curve, as CEO Hock Tan asserted that the company has quite a bit of visibility into “increased deployment of XPUs next year, much more than we originally thought and hand-in-hand with it, of course, more and more networking.” The necessity of networking in larger clusters means demand is likely to remain robust even given custom silicon will not keep pace with Nvidia’s merchant sales into the hundreds of billions. 

Higher-than-expected deployments of custom silicon combined with strong demand for networking should provide robust tailwinds for AI revenue growth beyond 2026. Broadcom currently has enough visibility to place possible demand acceleration for 2H 2026 on the table, and this could easily persist through 2027 and beyond should inference demand flourish and as the path to 1 million accelerator clusters materializes.  

Assuming Broadcom can maintain another 60% YoY growth in FY27 on stronger demand and potential conversion of its 4 current prospects, AI revenue would close in on $50 billion, or up to 60% share of revenue. Even if growth then slows to 30% YoY in FY28, Broadcom would still be more than doubling its AI revenue to $65 billion in just three years. 

Broadcom Reports 170% YoY Growth in AI Networking 

Broadcom has cemented itself in second place in AI revenue as it closes in on $20 billion this fiscal year in AI revenue — with a line of sight toward $30 billion by the end of fiscal 2026. AI revenue accounted for more than 50% of Semiconductor revenue for two quarters in a row and nearly 32% of total revenue in Q2. 

AI semiconductor revenue rose 46% YoY to $4.4 billion, in line with management’s guidance. Although this was a deceleration from 77% YoY growth in Q1, Broadcom forecast $5.1 billion in AI revenue in Q3, pointing to a rebound to 60% YoY growth – marking ten consecutive quarters of growth.  

In the current quarter, the 46% AI semiconductor growth was driven by networking, which was up 170% YoY and represented 40% of AI revenue. In the opening remarks, the CEO stated the following regarding this outsized growth: “As a standard-based open protocol, Ethernet enables one single fabric for both scale out and scale up and remains the preferred choice by our hyperscale customers. Our networking portfolio of Tomahawk switches, Jericho routers and NICs is what's driving our success within AI clusters in hyperscalers.” 

Graph of Broadcom stock's quarterly AI revenue accelerating from $4.4 billion to $5.1 billion in Q3.

Broadcom’s AI revenue was forecast to reaccelerate in Q3 to 60% YoY to $5.1 billion. Source: I/O Fund 

Q3’s guidance was ahead of some analyst expectations for $4.9 billion in AI revenue in the quarter, ticking higher as Google’s TPU v7p (Ironwood) begins to ramp. Q3 would also mark the largest sequential growth in over a year on a dollar basis, at ~$700 million.  

Additionally, analysts look to already be penciling in further strength in Q4, with Bernstein’s Stacy Rasgon suggesting that Broadcom could be eyeing $5.8 billion in AI revenue in Q4 assuming it sustains 60% YoY growth. Given that Broadcom’s 1H revenue was up more than 57% YoY, this seems a reasonable assumption, especially considering management is eyeing near 60% growth in FY26. 

More importantly, AI’s strength is masking persisting softness in non-AI revenue, which could continue to be pressured due to Broadcom’s high consumer exposure. Broadcom noted that non-AI revenue “is close to the bottom” but it “has been relatively slow to recover” with revenue down (5%) YoY to $4 billion in Q2.  

A graph of Broadcom's AI versus non-AI revenue showing AI revenue share now exceeding 50% on strong growth.

Broadcom’s AI revenue accounts for more than 50% of Semiconductor revenue, masking persisting softness in non-AI revenue. Source: I/O Fund 

Despite this weakness extending into Q3 with revenue expected to be flat QoQ at $4 billion, semiconductor revenue is accelerating – growth accelerated from 11% to nearly 17% in Q2, with the $9.1 billion semiconductor revenue guide pointing to an acceleration to nearly 25% growth in Q3.  

Should non-AI revenue soon find the bottom and begin to recover, this will provide support for continued Semiconductor growth. However, any persisting weakness in non-AI stemming from this elevated consumer and Apple exposure that AI revenue must absorb presents a real risk that investors should keep in mind through the rest of the year. Broadcom is also one of the more exposed semiconductor companies to China with tariffs, with more than $10 billion in revenue from the nation in fiscal 2024.  

A graph of Broadcom stock's quarterly Semiconductor revenue growth showing acceleration from 11% in Q1 to 25% guided in Q3.

Broadcom’s AI revenue strength is evident as Semiconductor revenue was guided to accelerate 8 points to 25% YoY despite flat non-AI revenue. Source: I/O Fund 

Broadcom Stock to See Lift from AI Inference 

Broadcom is aiming to capture growing inference tailwinds, with management explaining that the recent surge in inference demand is driving increased confidence in their FY26 AI revenue growth rate.  

CEO Hock Tan said that Broadcom’s hyperscale clients are “doubling down on inference in order to monetize their platforms,” and as a result, he expects Broadcom could “actually see an acceleration of XPU demand into the back half of 2026 to meet urgent demand for inference on top of the demand we have indicated from training.” This new dynamic is what is driving Tan’s confidence in stronger growth in FY26, saying that he now anticipates the “fiscal 2025 growth rate of AI semiconductor revenue to sustain into fiscal 2026.” 

This commentary plus potential demand acceleration in 2H 26 suggests that Broadcom has visibility into $30 billion AI revenue potential next year. Broadcom has not provided a full FY25 AI revenue guide yet, but it is on track to deliver approximately $19 to $20 billion in AI revenue in FY25, up ~60% YoY assuming 60% growth to $5.9 billion in Q4.  

Graph of Broadcom stock's AI revenue projections showing 60% YoY growth in FY25 and FY26 to $19.5 billion and $30 billion.

Broadcom’s AI revenue is projected to grow approximately 60% YoY in FY25 and maintain that growth in FY26. Source: I/O Fund 

Maintaining 60% growth through FY26 would project AI revenue to $30 to $32 billion. This trajectory indicates Broadcom is likely driving AI revenue ahead of expectations over the next four to six quarters, with Morgan Stanley saying that $26 to $30 billion in AI revenue is “higher than what is in Street models.” Evercore is modeling 58% AI revenue growth in FY25 and 50% in FY26, implying $28.9 billion.  

Broadcom Passes Nvidia Stock's Valuation – First Time in 9 Years

There’s no denying that Nvidia is the outright leader in the AI accelerator market with an estimated $200 billion in revenue this year with roughly $180 billion of that from AI data center whereas Broadcom will report $20 billion this year.  

Who is in second place is no contest yet what is second place worth when there is nearly a $160 billion gap? Broadcom clearly has key ingredients to have earned this second-place position yet there is also exposure to China and exports via Apple and ByteDance, one of its rumored customers. 

Meanwhile, for the first time in nine years, Broadcom has a higher valuation than Nvidia. 

On the top-line, Broadcom trades at nearly 19x forward revenue, an almost 8% premium to Nvidia’s 17.6x multiple. AVGO stock was at a 14% premium heading into Q2’s earnings. This is also 65% higher than Broadcom’s 5-year average 11.4x forward revenue multiple.  

Graph of Broadcom stock versus Nvidia stock valuation on a forward price-to-sales basis, with Broadcom now trading at a premium valuation.

Broadcom is currently valued at an 8% premium to Nvidia on a forward price-to-sales basis. Source: YChartsYCharts 

On the bottom line, Broadcom trades at 38.2x forward earnings, a 13% premium to Nvidia and a more than 18% premium to the semiconductor industry at 32.3x. Broadcom has strong margins – 65% adjusted operating margin and 52% adjusted net margin – driving strong EPS growth, at a 25% expected CAGR through FY27; however, the custom silicon ramp presents some headwinds to gross margin as it grows its mix share.  

Graph of Broadcom stock versus Nvidia stock valuation on a forward price-to-sales basis, with Broadcom now trading at a premium valuation.

Broadcom trades at 38.2x forward earnings, a 13% premium to Nvidia and a more than 18% premium to the broader semiconductor index on a forward PE basis. Source: YChartsYCharts 

Broadcom’s competitiveness with Nvidia on margins and its ability to drive strong EPS growth via operating leverage, while capitalizing on growing accelerator and networking demand lend to its valuation, as it is a clear second to Nvidia and far ahead of smaller peers Marvell and AMD in AI revenue. However, this premium valuation looks to price in above-expected AI revenue growth through 2026, likely closer to a 70% or even 75% CAGR through 2026 as Broadcom is currently tracking its SAM CAGR at 60% through FY26. 

Is Broadcom Stock a Buy? 

Subscribe for Full Access to the Article  

Behind the Paywall is the Following information: 

  • It’s often subtle commentary – and not the headlines – that reveals the biggest opportunities. Find out the one thing Broadcom CEO stated that all investors MUST hear to help position for 2025-2026.  
  • The clear catalyst within Broadcom’s product portfolio and timing for this product to help push forward the next leg up in AI revenue growth. 
  • The I/O Fund’s trade setup – exclusive only to subscribers. We detail buy zones we are eyeing for the #2 stock in AI given its immense demand yet stretched valuation.
    Sign Up to Continue ReadingSign Up to Continue Reading

Paid subscribers, click here to view the full articleclick here to view the full article

Not ready to subscribe but want more thoughtful analysis from a top-performing team in tech? Every week, we publish free research. 👉 Sign up here.ere.

Please note: The I/O Fund conducts research and draws conclusions for the company’s portfolio. We then share that information with our readers and offer real-time trade notifications. This is not a guarantee of a stock’s performance and it is not financial advice. Please consult your personal financial advisor before buying any stock in the companies mentioned in this analysis. Beth Kindig and the I/O Fund do not own shares in AVGO at the time of writing and may own stocks pictured in the charts.

Recommended Reading:

  • Taiwan Semiconductor Stock: AI Growth Amid Geopolitical Risk
  • Historic Market Uncertainty Meets $7 Trillion Debt Wall: What Comes Next for the S&P 500
  • Nvidia Stock Faces a Choppy Q2, But Tailwinds Build for H2 Acceleration
  • Why Bitcoin’s Bull Run May Be Nearing a Top Despite Pro-Crypto Tailwinds
Posted in AI StocksLeave a Comment on This AI Stock is Set to Surge from Inference Demand

Posts navigation

Older posts

Recent Posts

  • The IPO Glut of 2020: Why Valuations Have Gone Too Far
  • Zoom Discusses Two Important Catalysts In Q1 Earnings
  • Three Risk Management Tools the I/O Fund Offers
  • Micron Is Up 900%. Here’s Why the AI Memory Trade May Still Have Room to Run
  • Credo: Reliability Leader Aggressively Moves into Optics

Recent Comments

No comments to show.

Archives

  • June 2026
  • May 2026
  • April 2026
  • March 2026
  • February 2026
  • January 2026
  • December 2025
  • November 2025
  • October 2025
  • September 2025
  • August 2025
  • July 2025
  • June 2025
  • May 2025
  • April 2025
  • March 2025
  • February 2025
  • January 2025
  • December 2024
  • November 2024
  • October 2024
  • September 2024
  • August 2024
  • July 2024
  • June 2024
  • May 2024
  • April 2024
  • March 2024
  • February 2024
  • January 2024
  • December 2023
  • November 2023
  • October 2023
  • September 2023
  • August 2023
  • July 2023
  • June 2023
  • May 2023
  • April 2023
  • March 2023
  • February 2023
  • January 2023
  • December 2022
  • November 2022
  • October 2022
  • September 2022
  • August 2022
  • July 2022
  • June 2022
  • May 2022
  • April 2022
  • March 2022
  • February 2022
  • January 2022
  • December 2021
  • November 2021
  • October 2021
  • September 2021
  • August 2021
  • July 2021
  • June 2021
  • May 2021
  • April 2021
  • March 2021
  • February 2021
  • January 2021
  • December 2020
  • November 2020
  • October 2020
  • September 2020
  • August 2020
  • July 2020
  • June 2020
  • May 2020
  • April 2020
  • March 2020
  • February 2020
  • January 2020
  • December 2019
  • November 2019
  • October 2019
  • September 2019
  • August 2019
  • July 2019
  • June 2019
  • May 2019
  • April 2019
  • March 2019
  • February 2019
  • January 2019
  • December 2018
  • November 2018
  • October 2018
  • September 2018
  • August 2018
  • July 2018
  • June 2018
  • May 2018
  • April 2018
  • February 2018
  • January 2018

Categories

  • 5G
  • About
  • Accounting Tips
  • AdTech
  • Ai Platforms
  • Ai Platforms
  • Ai Platforms
  • Ai Platforms
  • Ai Platforms
  • Ai Platforms
  • Ai Platforms
  • Ai Platforms
  • Ai Platforms
  • Ai Platforms
  • Ai Platforms
  • Ai Platforms
  • Ai Platforms
  • Ai Platforms
  • Ai Platforms
  • Ai Platforms
  • AI Stocks
  • AI Stocks
  • Analysts
  • Application Monitoring
  • Application Monitoring
  • Applications
  • Applications
  • Applications
  • Applications
  • Applications
  • Applications
  • Applications
  • AR
  • Audit Reports
  • Autonomous Vehicles
  • Autonomous Vehicles
  • Autonomous Vehicles
  • Autonomous Vehicles
  • Autonomous Vehicles
  • Autonomous Vehicles
  • Autonomous Vehicles
  • Avod
  • Avod
  • Battery Charging
  • Bear Market
  • Bitcoin
  • Bitcoin
  • Bitcoin
  • Bitcoin
  • Bitcoin
  • Bitcoin
  • Bitcoin
  • Blockchain
  • Blockchain
  • Blockchain
  • Blockchain
  • Blockchain
  • Blockchain
  • Blockchain
  • Broad Market Today
  • Bull Market
  • Bull Market
  • Chainlink
  • Chainlink
  • Chainlink
  • Chainlink
  • China Stocks
  • Cloud
  • Cloud Infrastructure
  • Cloud Infrastructure
  • Cloud Infrastructure
  • Cloud Infrastructure
  • Cloud Infrastructure
  • Cloud Infrastructure
  • Cloud Infrastructure
  • Cloud Platforms
  • Cloud Platforms
  • Cloud Software
  • Cloud Software
  • Cloud Software
  • Cloud Software
  • Cloud Software
  • Cloud Software
  • Cloud Technology
  • Company
  • Company
  • Console Gaming
  • Console Gaming
  • Console Gaming
  • Consumer
  • Consumer
  • Consumer
  • Consumer
  • Consumer
  • Consumer
  • Consumer
  • Consumer
  • Consumer
  • Consumer
  • Consumer
  • Consumer
  • Consumer
  • Consumer
  • Consumer Tech
  • Corrections
  • Crypto Investment
  • Ctv
  • Ctv
  • Ctv
  • Ctv
  • Ctv
  • Ctv
  • Ctv
  • Ctv
  • Ctv
  • Ctv
  • Cybersecurity
  • Cybersecurity
  • Cybersecurity
  • Cybersecurity
  • Cybersecurity
  • Cybersecurity
  • Cybersecurity
  • Cybersecurity
  • Cybersecurity
  • Cybersecurity
  • Cybersecurity
  • Cybersecurity
  • Data
  • Data Analytics
  • Data Analytics
  • Data Analytics
  • Data Center
  • Data Center
  • Data Center
  • Data Center
  • Data Center
  • Data Center
  • Data Center
  • Data Center
  • Data Center
  • Data Center
  • Data Center
  • Data Center
  • Data Center
  • Data Center
  • Data Center
  • Data Center and Processing
  • Data Warehousing
  • Data Warehousing
  • Data Warehousing
  • Data Warehousing
  • Databases
  • Databases
  • Databases
  • Databases
  • Dating
  • Defi
  • Digital Ads
  • Digital Ads
  • Digital Ads
  • Digital Ads
  • Digital Ads
  • Digital Ads
  • Digital Ads
  • Digital Ads
  • Digital Ads
  • Digital Ads
  • Digital Ads
  • Digital Ads
  • Digital Ads
  • Digital Ads
  • E-Commerce
  • Earning Updates
  • Earning Updates
  • Earning Updates
  • Earning Updates
  • Earning Updates
  • Earnings Report
  • Earnings Report
  • Earnings Report
  • Earnings Report
  • Earnings Report
  • Earnings Report
  • Earnings Report
  • Earnings Report
  • ECommerce
  • Electric Vehicles
  • Electric Vehicles
  • Electric Vehicles
  • Electric Vehicles
  • Electric Vehicles
  • Electric Vehicles
  • Electric Vehicles
  • Energy Stocks
  • Enterprise
  • Enterprise
  • Enterprise
  • Enterprise
  • Enterprise
  • Enterprise
  • Enterprise
  • Enterprise
  • Enterprise
  • Ethereum
  • Events1
  • Events1
  • Exchange
  • Faq
  • Finance
  • Financial Analysis
  • Financial Analysis
  • Financial Analysis
  • Financial Analysis
  • Financial Analysis
  • Financial Analysis
  • Financial Analysis
  • Financial Analysis
  • Financial Analysis
  • Financial Analysis
  • Financial Analysis
  • Financial Analysis
  • Financial Markets
  • FinTech
  • Fundamental Analysis
  • Gambling
  • Gaming
  • Genomics
  • Glossary
  • Green Energy
  • Growth Stocks
  • Growth Stocks
  • Growth Stocks
  • Headsets
  • Headsets
  • Health Tech
  • Hydrogen
  • Identity
  • Identity
  • Identity
  • Inflation
  • Inflation
  • Inflation
  • Internet of Things
  • Interviews
  • Interviews
  • Interviews
  • Interviews
  • Investing
  • Investing
  • Ltbh
  • Ltbh
  • Ltbh
  • Ltbh
  • Ltbh
  • Macro Trends
  • Macro Trends
  • Market Trends
  • Market Trends
  • Market Trends
  • Market Trends
  • Market Trends
  • Market Trends
  • Market Trends
  • Market Updates
  • Market Updates
  • Market Updates
  • Market Updates
  • Market Updates
  • Market Updates
  • Market Updates
  • Market Updates
  • Market Updates
  • Market Updates
  • Media
  • Membership
  • Mining
  • Mobile
  • Mobile
  • Mobile
  • Mobile
  • Mobile Gaming
  • Mobile Gaming
  • Mobile Gaming
  • Multimedia
  • Music Streaming
  • NVDA | NVIDIA Corporation
  • Performance Updates
  • Pin Content
  • Podcasts
  • Podcasts
  • Podcasts
  • Portfolio
  • Premium Research
  • Press Releases
  • Press Releases
  • Productivity
  • Productivity
  • Productivity
  • Productivity
  • Productivity
  • Productivity
  • Productivity
  • Reports and Whitepapers
  • Research Services Preview
  • Resources
  • Resources
  • Semiconductor Stocks
  • Semiconductors
  • Semiconductors
  • Semiconductors
  • Semiconductors
  • Semiconductors
  • Semiconductors
  • Semiconductors
  • Semiconductors
  • Semiconductors
  • Semiconductors
  • Semiconductors
  • Semiconductors
  • Semiconductors
  • Social Media
  • Social Media
  • Social Media
  • Social Media
  • Social Media
  • Social Media
  • Social Media
  • Software
  • Software
  • Software
  • Software
  • Software
  • Software
  • Software
  • Software
  • Software
  • Software
  • Software
  • Software
  • Software
  • Software
  • Software
  • Solar
  • Solar
  • Stock Analysis PDFs
  • Stock Updates
  • Stock Updates (Blogs)
  • Supplychain
  • Supplychain
  • Supplychain
  • Supplychain
  • Supplychain
  • Supplychain
  • Svod
  • Svod
  • Svod
  • Svod
  • Svod
  • Svod
  • Tech Podcast
  • Tech Stock News
  • Tech Stock News
  • Tech Stock News
  • Tech Stock News
  • Tech Stock News
  • Tech Stocks
  • Tech Stocks
  • Tech Stocks
  • Tech Stocks
  • Tech Stocks
  • Tech Stocks
  • Tech Stocks
  • Tech Stocks
  • Tech Stocks
  • Tech Stocks
  • Tech Stocks
  • Tech Stocks
  • Tech Stocks
  • Tech Stocks
  • Technical Analysis
  • Telehealth
  • Telehealth
  • Telehealth
  • Telehealth
  • Testing Equipment
  • Testing Equipment
  • Top Tech Stock News
  • Travel
  • Trends Report
  • Tutorials
  • Uncategorized
  • Updates
  • Updates
  • Updates
  • Video
  • Video
  • Video
  • Video
  • Video Footage
  • VR
  • Webinar Alerts
  • Webinar Alerts
  • Webinars
Proudly powered by WordPress | Theme: iofund by iofund.co.uk.