We describe our newsletter as “free,” however the resources required to produce the research behind our weekly analysis are substantial. Delivering early, actionable insights consistently—and making them available to the public—is a deliberate investment by our firm and an approach that remains uncommon in traditional Wall Street research.
While we occasionally highlight individual examples to illustrate accuracy, the broader value becomes clearer when viewed over a full year. Across that period, many of our articles identified complex market inflection points and highlighted companies early in their cycles—long before their performance became evident by a mainstream investor audience.
For example, we offered immense benefit by preparing our readers for a local top in AI stocks in February, ahead of the April rout (reference articles below). Although the value of this has passed, our work in Q2-Q4 has only strengthened our strong 5-year track record. More recently, in Q3, the I/O Fund nailed the Bitcoin top at a time when virtually nobody else was calling it (quite the opposite; we literally challenged “the herd” in our article headline) —this materialized to become an accurate view that continues to play out as soft price action in crypto persists. Given the volatility of this asset class, the value in timing a selloff cannot be overstated.
A few weeks ago, our Q4 series on the AI Monetization Wave defended the AI opportunity by stating the era of monetization has not yet begun; an argument in sharp opposition to growing AI bubble fears. To help illustrate this, we point toward some companies that are quietly monetizing AI into the tens of billions – which is by far, the fastest growth curve the technology industry has ever seen in a 2-3 year time span. Interesting enough, the mainstream narrative is not able to recognize this.
These points, and many more like it, uniquely came from the I/O Fund – and we openly shared them with our readers in 2025. Below, we break down quarter-by-quarter the research we provided to our readers this past year – for free – including some critical research we believe is fully in play as we position for 2026.
I/O Fund’s AI Stock Forecast in Q1 2025: NVDA, SMH & QQQ Sell-off
Predicting the 2025 AI Correction: How the I/O Fund Identified the Peak
The I/O Fund has built its reputation on identifying major market trends before they materialize. In the February feature, ‘AI Stocks Signal a Correction Before a Buying Opportunity Emerges’ Co-Portfolio Manager Knox Ridley warned of rising volatility for 2025. He noted that the market rally lacked broad support, creating a risky divergence in which stocks trend higher even as key sectors fail to reach new highs.
For the I/O Fund, this served as a vital cautionary signal in an overheating market – especially given that the I/O Fund is a leading AI stock portfolio. Two months later, AI stocks sold off heavily with Nvidia stock down (25%), while VanEck Semiconductor ETF was down (22%), and Invesco QQQ ETF was down (17%) in a little over a month after we published the cautionary analysis.
The I/O Fund closely tracks the supply chain data and monitors the technical levels of stocks to help our premium members make informed decisions. Despite Beth Kindig being a well-established Nvidia bull, her firm took a balanced approach headed into 2025 with yet another warning that the AI leader was likely to trade meaningfully lower due to technical signals. The analysis ‘Where I Plan To Buy Nvidia Stock Next’ provided a buy plan for our readers and stated that Nvidia could trade below $100. The analysis played out, as we were able to buy Nvidia at $87.99, issuing a real-time trade alert that has returned 92% on that tranche since early April.
Most importantly we continued our coverage during the market sell-off caused by DeepSeek fears in our article, ‘DeepSeek Creates Buying Opportunity for Nvidia Stock.’ We reassured our readers that DeepSeek’s cost-efficient AI training is a long-term catalyst for Nvidia stock. We stated, “If DeepSeek’s breakthroughs are truly the key to ushering in a new paradigm of AI training and ultimately AI democratization from cost reductions, it will not be a death sentence for Nvidia; in fact, quite the opposite.” Despite many stating that DeepSeek was a defining moment for AI, and stirring up the panic, the Chinese LLM is hardly spoken of today.
mid
In Q1, a few Nvidia suppliers were providing mixed guidance on the timing of Nvidia’s Blackwell GB200 systems. We published an article, ‘Nvidia Suppliers Send Mixed Signals for Delays on GB200 Systems – What It Means for NVDA Stock’, to help Nvidia investors understand the changes in the supplier commentaries and why Nvidia was likely to take a pause Q1-Q2. Later, we identified Q3 as the likely inflection point for Nvidia, which later became the strongest earnings report in nearly two years.
I/O Fund has a history of buying Nvidia at low prices. The first entry was $3.15 in December 2018, and since then, we have been able to issue buy alerts around major lows – including $10.85 on October 13th, 2022, as well as $94.48 on April 4th, 2025, and again at $87.99 on April 7th, 2025. The I/O Fund discusses key technical levels in our weekly webinars for Advanced Market Signals Tier members.
Subscribe to Advanced Market Signals to get real-time trade alerts for every entry and exit, portfolio access, and join weekly live webinars.Advanced Market Signals to get real-time trade alerts for every entry and exit, portfolio access, and join weekly live webinars.
Q2: Navigating the AI Stock Recovery After the April Bottom
The I/O Fund Logged 23 buys in March and April of 2025, Including NVDA and ALAB
After the April bottom, AI stocks came roaring back with a vengeance. In tech investing, timing is the difference between average and extraordinary returns. For example, if an investor bought Astera Labs at the beginning of the year, the return would be only 27% compared to buying the stock at the beginning of April would have a staggering gain of 269% (as of today), a difference of 242% within a short period of one quarter. This is exactly what the I/O Fund did, adding to current positions like Nvidia, while also building new positions in four additional lesser-known AI stocks with strong outperformance.
Going back to Astera Labs, we knew that we wanted to own ALAB; however, our system was telling us that we should wait, as the odds were high heading into 2025 that we could get lower prices. We began to layer in at $79.73 on January 27th, when ALAB was more than 45% off its highs. We further issued 4 additional buy alerts, layering in at key levels, completing our accumulation at $51.10 on April 4th. Our system of using technical analysis to layer into a position gave us an 11% position in ALAB with a combined cost basis of $69.42, which made it one of our biggest winners of the year, with a 140% return in 2025.
Source: I/O Fund
Astera Labs (ALAB) Stock Performance: 269% Gains Following the April Bottom compare this to 27% return YTD in 2025.
I/O Fund’s Co-Portfolio Manager Knox Ridley discussed in May that his analysis foresaw the S&P 500 index reaching a new all-time high later in the year in the article, ‘Historic Market Uncertainty Meets $7 Trillion Debt Wall: What Comes Next for the S&P 500.’ Knox utilized a data-driven approach by identifying a bullish shift in the Advance-Decline line –signalling healthy market breadth. He also leveraged Fibonacci levels to gauge the strength of the recovery and along with that, used better-than-expected earnings signals to predict an all-time high later in 2025. Fast forward to December 2025, and Knox’s forecast has become reality as the S&P 500 officially surged to its new all-time high.
AMD Outperformed Nvidia in 2025
In June, AMD offered more details on the release of their groundbreaking GPUs with little fanfare in the markets – which is par for the course as AMD has a history of being forgotten about until the company can no longer be ignored. In the analysis, ‘AMD vs Nvidia: The AI Stock That Could Win by 2028,’ we offered our readers a timely discussion on AMD's strengths and how thinking AMD is down for the count could be a costly mistake. AMD stock is up 68% compared to Nvidia’s return of 31% during this period, a difference of 37%.
Visualizing AMD’s 37% Outperformance Over Nvidia Post-I/O Fund June Analysis
Broadcom’s Silent Rise: Building the Backbone of AI Inference
While everyone is focused on the Nvidia stock, Broadcom is quietly cementing its position for the second spot. The company specializes in custom silicon and networking required for the next phase of AI, particularly for the inference trend. Broadcom’s custom XPU solutions provides Big Tech something that AI GPUs can’t: massive cost savings and energy efficiency at scale. We have discussed in depth in our article, ‘This AI Stock is Set to Surge from Inference Demand.’
Q3 Market Bifurcation: AI Leadership Emerges as Crypto Stalls
April proved challenging, but Q3 marked a critical bifurcation in the market. As crypto rolled over and many debt-laden AI stocks softened, a select group of lesser-known AI names continued to advance—quietly separating leadership from excess.
Crypto Peaked in Q3 as the Herd Stayed Bullish
The I/O Fund has long held that risk management should carry equal weight to alpha generation. As a result, some of our most important wins are not always reflected in returns, but in losses avoided. In August, we hosted a rare, public one-hour webinar—our only free webinar of the year—to walk through why a Bitcoin selloff was increasingly likely. At the time, Co-Portfolio Manager Knox Ridley was confident enough in his analysis to openly challenge lofty crypto price targets, referring to consensus optimism as “the herd.”
Our Bitcoin calls are grounded in a systematic framework that combines technical analysis, on-chain data, and global liquidity trends. While many money managers were calling for Bitcoin prices to double in August, Knox accurately identified a market top through a series of research pieces, including the article ‘Is Bitcoin’s Bull Run Nearing a Top? What the Herd Missed at $16,000 and is Missing Now’as well as the accompanying webinar.
The clip below is from our Free Bitcoin Webinar in August, explaining that we were in the final Wave 5 for Bitcoin.
Avoiding the AI Bubble Trap: I/O Fund’s Timely Nvidia Q3 Call
While others were busy discussing the AI bubble, we continued to track Big Tech Capex to predict Nvidia’s strong Q3 results. Nvidia’s stock experienced a rare price target reduction after reporting weaker-than-expected Q2 results and increased competition from Broadcom. The company faced numerous headwinds from China and production delays in their current generation of GPUs during that period. We stayed calm and crunched the hard data on Q2 capex numbers and what is coming down the pipe for Q3. We also came up with an updated buy plan to our readers in the article that we published in September, ‘Updated Nvidia Stock Price Target – AI “Bubble” Narrative Ignores Re-Acceleration in Big Tech Capex.’
Reddit Stock, an Overlooked AI Play
During this quarter, the I/O Fund covered Reddit, ahead of the stock leading off the November lows in the article Reddit Stock Blows the Doors Off – Can it Last? We discussed Reddit’s strong Q2 earnings and even issued three buy alerts between $190 – $196. Despite having far fewer users than Facebook, Reddit ranks among the most visited U.S websites, benefiting significantly from Google’s AI-driven search changes. This visibility has fueled growth but also introduces risk. The analysis explores how investors can evaluate this opportunity and identify the signs of peak growth and recognize potential catalysts that could further influence Reddit’s stock.
Q4: The I/O Fund’s AI Monetization Calls
While many investors are wondering whether the AI trend is entering dot-com territory, we believe AI’s most powerful move has not even begun.
In a series of analyses on the incoming AI monetization wave, the I/O Fund has laid out a data-driven case that AI is on the cusp of monetizing; a sharp rebuttal to those who believe AI is topping. Earlier this month, we connected the dots on Nvidia’s earnings report, the strongest in nearly two years, and highlighted why Broadcom’s commentary is quietly signaling that the best is yet to come.
At select moments, IOF takes a firm view that diverges sharply from prevailing market consensus. In many of these instances, we are among the few—if not the only—voices expressing that view in real time, grounded in deep analysis and conviction.
We did this recently by standing against the prevailing, negative views on Big Tech capex by pointing out we are likely on the cusp of an AI monetization wave
Predicting Nvidia’s $20 Trillion Market Cap: The 2030 Roadmap
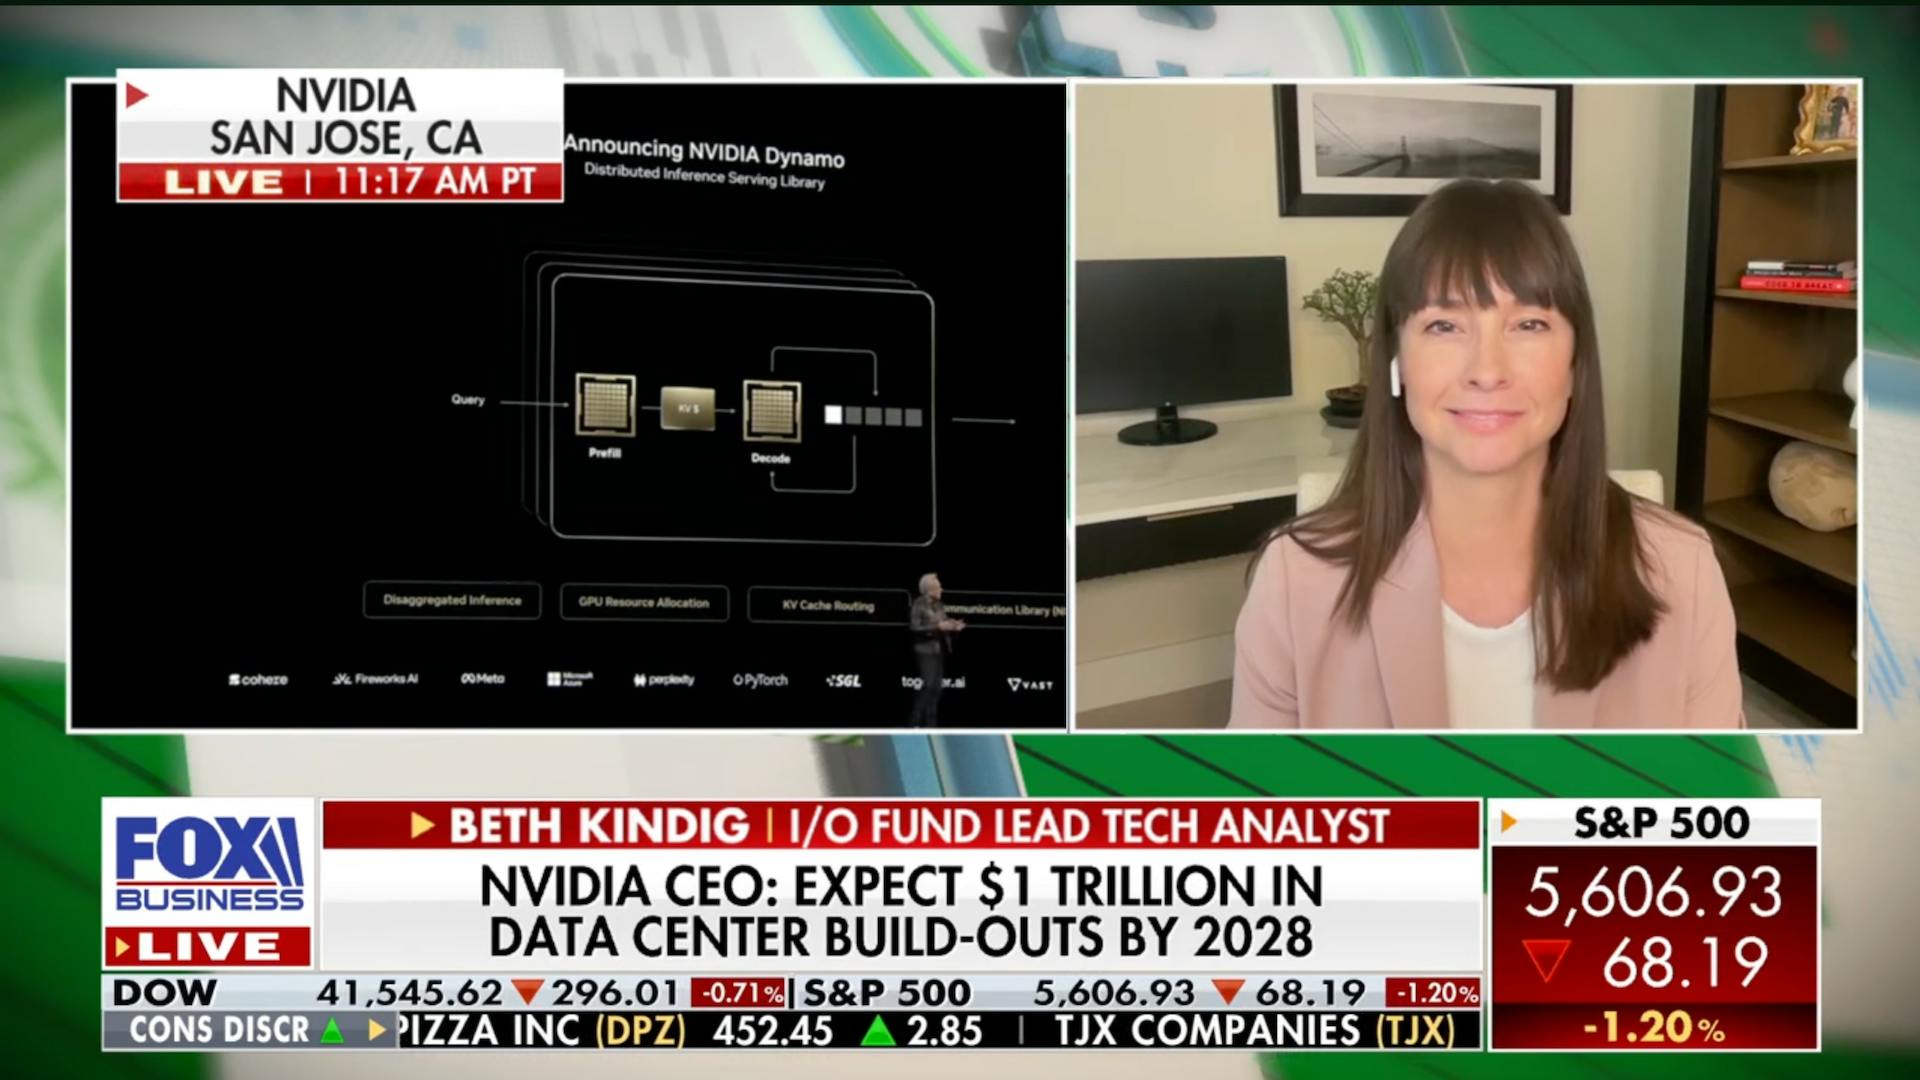
We revised our $10 trillion market cap target to $20 trillion in the article here. We offered a data-driven, fundamentally grounded case for how Nvidia can realistically reach a $20 trillion valuation by 2030. This is supported by Nvidia’s aggressive 1-year product roadmap, an impenetrable software ecosystem through CUDA to maintain a near-monopoly on training, and its evolution into a full-stack AI systems provider as the inference market intensifies. When these elements are modeled together — alongside the rapid expansion in global AI infrastructure capex — the path to $20 trillion becomes less sensational and more a reflection of compounding fundamentals. Under our framework, Nvidia’s data center segment would need to grow at a 36% CAGR through 2030 to support such a market capitalization—a trajectory we view as achievable given the company’s roadmap visibility. Our CEO and Lead Tech Analyst, Beth Kindig, joined Charles Payne of Fox Business Network on his show ‘Making Money with Charles Payne’, after Nvidia’s stellar Q3 results to defend the $20 trillion market cap target.
AI Growth Cycle: Decoding Big Tech’s Record CapEx
Big Tech’s capital spending, the core metric for the AI cycle, continued to impress in the Q3 earnings season. Q3 CapEx rose 19% QoQ and 75% YoY – which is the strongest growth we've seen this year. Amazon’s Andy Jassy captured the sentiment on his Q3 earnings call: “The faster we grow, the more CapEx we end up spending… We don’t procure it unless we see significant signals of demand.” His comments underscore the durability of AI-driven demand.
Some high-profile analyst firms claim the CapEx boom is a one-time event – and we wrote a data-driven rebuttal to this idea in the article Big Tech’s $405B Bet: Why AI Stocks Are Set Up for a Strong 2026. AI infrastructure is continuously advancing, and this requires successive generations of hardware and networking upgrades every one to two years as model architectures, memory bandwidth, and power requirements scale exponentially.
The Incoming AI Monetization Wave
In the analysis, ‘The AI Revenue Leader Nobody Is Talking About—Second Only to Nvidia Stock.’ We highlight several key metrics from Meta’s Q3 earnings report that illustrate the company is offering measurable returns on its AI investments. Perhaps most surprising, we believe Meta may now rank only behind Nvidia in AI revenue — surpassing Microsoft in the process. The analysis looks beyond the headline numbers to examine what’s driving AI’s second-largest revenue engine.
This quarter, our firm also covered Micron, a stock up 6X compared to Nvidia this year in the article Micron Stock Up 120% YTD: What the HBM Memory Leader Plans for 2026. Micron is no longer tied to consumer device cycles. Instead, high bandwidth memory (HBM) had led to higher margins and multi-year supplier agreements, resulting in a leveraged approach to participate in the AI infrastructure buildout.
Conclusion:
While the rest of the market spent this year debating AI bubbles, geopolitical fears, and supply chain bottlenecks, our team remained laser-focused on outcomes. Rather than responding to headlines, we work hard to anticipate shifts and publish data-driven analysis to get in front of the market. This approach led us to flag the April correction in February, surface multiple AI winners throughout the year, and help protect capital during the crypto downturn.
Over the past five years, the I/O Fund has delivered cumulative returns of 210%—performance that would rank us #5 among hedge funds and #2 among ETFs. Notably, this figure does not yet reflect our strong 2025 performance.
Subscribe to Advanced Market Signals to get real-time trade alerts for every entry and exit, portfolio access, and join weekly live webinars. Join now.Advanced Market Signals to get real-time trade alerts for every entry and exit, portfolio access, and join weekly live webinars. Join now.Join now.
Please note: The I/O Fund conducts research and draws conclusions for the Fund’s positions. We then share that information with our readers. This is not a guarantee of a stock’s performance. Please consult your personal financial advisor before buying any stock in the companies mentioned in this analysis.
As we have discussed for our Discovery and Pro members, AI networking is one of the strongest trends for this year and next, driven by scale-up and scale-out networking to support larger GPU racks and accelerating GPU cluster sizes. Celestica is an under-the-radar beneficiary of this trend, capitalizing on strong demand for 800G and 1.6T Ethernet networking switches and leveraging its deep ties to hyperscalers.
Celestica guided for one of the most impressive accelerations seen in this last quarter of earnings, underpinned by its 800G switches accelerating next year with 1.6T on deck. For 2026, Celestica expects revenue growth to accelerate around five points to 31% YoY in 2026, whereas consensus had been pegged at just 17% YoY. This strong upside is being driven by networking and custom AI compute platforms with visibility into 2026-2027.
In terms of AI revenue, Celestica’s Cloud and Connectivity Solutions (CCS) segment is guided to generate $9 billion in revenue in 2025, up ~40% YoY, accounting for nearly 74% of total revenue. CCS, which includes AI networking, server, storage and rack-scale system solutions, is Celestica’s main growth driver, expected to grow ~40% annually in 2026 and 2027.
Celestica is closely linked to Broadcom’s networking platforms as a key vendor, serving major customers such as Google and Meta, with some of its notable product engagements including Google’s TPU server racks, and Meta’s Minerva ASICs servers, Wedge400 switches and also its next-gen Tomahawk5-based 400G AI fabric switch Minipack3. Additionally, management’s commentary suggests that OpenAI could become a key customer as soon as 2027.
Below, we cover Celestica’s strategic positioning in the high-bandwidth Ethernet market, its engagements with hyperscalers and upcoming platform ramps, its updated growth outlook for FY26 and beyond, and more.
Celestica’s Strategic Positioning in Custom Networking Switches
Celestica is strategically positioned in the AI supply chain as it provides hyperscalers with highly customized data center networking switches, servers and storage platforms, alongside custom rack-scale integration services.
Celestica is also closely aligned with Broadcom, as a preferred provider offering customized high-performance Ethernet switches based on its Tomahawk platform and integrated XPU-based racks and systems. CEO Rob Mionis explained that when Broadcom launches new silicon, such as its newest Tomahawk6, “they’ll work with us to develop products, and those products end up in the major hyperscalers.”
Growth opportunities are primarily centered around its high-bandwidth Ethernet switch portfolio focused on back-end networking, with the company being the leading supplier with 41% share of the >200G switch market through Q2, and with 55% share of the custom switch market (up from 40% in 2024). The back-end networking positioning is important for Celestica as it means the company is exposed to the faster-growing segment of Ethernet switching – the back-end TAM is forecast to grow at a 56% CAGR through 2029 on scale-out, and potentially soon, scale-up demand, whereas front-end (user-facing) is forecast to grow at a 20% CAGR.
Per management, the back-end also sees a much faster refresh rate of every 18-24 months versus >5 years for front-end deployments, and it adopts the newest and fastest bandwidths (800G and soon 1.6T) due to the greater performance and reliability requirements of GPU-to-GPU and rack-to-rack communications.
Celestica’s primary products include scalable top-of-rack switches and high-bandwidth Ethernet switches (>400G). Its 100G and 400G switches are optimized for data center leaf-and-spine deployments.
For 800G switches, Celestica’s DS4100/DS4101 are based on Broadcom’s Tomahawk4 portfolio and the DS5000 is based on the Tomahawk5, targeting high bandwidth data center leaf-spine, and top-of-rack applications. For additional clarity on 800G switch dynamics, management explained that they have seen “tremendous growth in 800G this year to the point where we'll end 2025 with roughly a 50% split between 800G and 400G in terms of the products that we're delivering. As we look into 2026, we're seeing the 800G demand, in particular, accelerating.”
For 1.6T, Celestica will offer the DS6000 and DS6001, based on Broadcom’s upcoming Tomahawk6 offering 102.4Tbps bandwidth, with availability later in 2026. The DS6000 comes in an air-cooled version with linear pluggable optics (LPO) to improve power efficiency, while the DS6001 features hybrid-cooling and the first to integrate direct-to-chip liquid cooling. Both 1.6T switches are optimized for AI back-end networking (scale-out and scale-up), as well as large-scale AI fabrics for AI training and inference for frontier model sizes. Management expects the 1.6T upgrade cycle to emerge in late 2026 but primarily land in 2027, with one customer giving visibility to a back-half 2026 ramp and multiple other ramps occurring through 2027.
Celestica is also already making early investments for 400G SerDes to support 3.2T switch platforms, though it does not expect 3.2T mass production to arrive until 2028. Management is also preparing for co-packaged optics (CPO) and other interconnect types such as co-packaged copper (CPC), and while it sees some potential CPO shipments with 1.6T, it does not expect CPO to emerge in full-force until the 3.2T cycle.
Although these switch products can be highly customized, they support open-source networking stacks such as SONiC, offering hyperscalers flexibility in deployments, facilitating integration into existing software and hardware ecosystems, and letting customers avoid vendor lock-in. This is furthered with Celestica’s extensive Circular Services offering, spanning hardware lifecycle management, remanufacturing, and refurbishment to extend hardware lifetimes and reduce TCO.
ODM Pivot Driving Hyperscaler Growth, with Google and Meta Key Customers (and Soon Likely OpenAI)
This positioning in custom Ethernet switches also pushes Celestica towards more of an ODM (original design manufacturer) model from a traditional EMS contract manufacturer, as it engages more deeply across the design and engineering phase, tailoring products exactly to its hyperscaler customers’ needs. Some of its notable confirmed/implied hyperscaler product engagements include Google’s TPU server racks, and Meta’s Minerva ASICs servers, Wedge400 switches and also its next-gen Tomahawk5-based 400G AI fabric switch Minipack3.
Here is an example of what Celestica’s involvement would look like, such as on Meta’s Wedge400, its top-of-rack networking switch based on Broadcom’s Tomahawk3 from 2021:
Celestica works with Meta on system requirements and finalizes system level architecture.
Celestica is fully responsible for hardware design and complete prototyping, along with functional and reliability tests and diagnostic software development.
After this, Meta reviews Celestica’s engineering design and test reports and moves to production.
Management’s discussion on its first-of-kind rack-scale liquid cooled 1.6T networking win with a hyperscaler (likely to be Meta for its upcoming Santa Barbara racks) also shed light on why Celestica continues to win these engagements:
“The customer required an accelerated road map to allow the solution to be early to market, leveraging Broadcom's Tomahawk 6 SC silicon, making speed to market a key consideration. In addition, the customer required multi-node manufacturing capabilities in Asia and the U.S. to support the delivery of the program. As with many of our key engagements, managing complexity was a defining factor.
Celestica was awarded the program earlier this year based on a strong working relationship with the customer and their confidence in our industry-leading design engineering. They also valued our advanced manufacturing capabilities, specifically our ability to operationalize highly complex production lines for liquid cooled racks at scale and to do this faster and more seamlessly than other potential partners.
After receiving initial Tomahawk 6 samples earlier this year, we quickly stood up an operational prototype for the 1.6T switch and believe we were the first team anywhere to have done so. The program is scheduled to begin mass production next year.”
This ODM pivot and ability to co-design and manufacture highly customized, next-gen networking switch and rack solutions at speed is quite visible in Celestica’s hyperscaler growth trajectory, as hyperscalers are expected to account for ~$6.93 billion of revenue in 2025, up from $2.19 billion in 2022, an incredible ~47% CAGR. However, the ODM positioning also presents a risk as even a shift to higher complexity, higher value products may be unable to produce continuous margin expansion into the low-teens.
Also aiding this hyperscaler growth is a high level of stickiness and deep customer engagement across data rate upgrades. Management explained that they have been able to consistently upgrade all customer engagements each cycle:
“When you look at where we carved out this industry-leading position in networking, it started in 400-gig, and we were able to translate all of those engagements into 800-gig. And those engagements have been expanding incrementally to new opportunities, and we fully plan to translate all of our 800-gig engagements into 1.6T as well, and we're on track to do that.” Management quietly dropped that they currently have ten programs underway with 1.6T.
Digital Native Customer Win and 2027 Ramp (Hint: It’s Likely OpenAI)
Back in January, Celestica announced a “a significant new HPS win with a leading digital native company, who is a pioneer in the commercialization of AI applications,” collaborating with this company to “deliver a full rack, which is an optimized AI system solution built around the customer's custom ASIC accelerator.” The rack-scale solution also will include Celestica’s 1.6T switches and rack-level cooling and connectivity. At the time, Celestica said that “production for this program is expected to begin ramping in the latter part of 2026.”
In Q3, Celestica provided an update, saying that the “design work for this program is well underway, and we expect to receive initial XPU deliveries in the second half of 2026 to support early test deployments with full-scale production expected to commence in 2027.” Management did add that 2026’s $16 billion revenue outlook does not include any contribution from this customer, but if the custom silicon “is available sooner for mass production, then we may be able to produce sooner.”
Broadcom’s discussion around its 10GW commitment from OpenAI likely confirms that OpenAI is Celestica’s new digital native customer, with Broadcom saying that 2026 contribution from OpenAI is expected to be minimal with the 10GW deployments concentrated in 2027 through 2029.
This would potentially be a landmark deal for Celestica in the long-run, as it is an entirely new customer with the potential to add several billion in annual revenue; management said in the original announcement that “demand from this customer at scale could achieve a level similar to those of our largest hyperscaler customers today.” For context, this would compare to Celestica’s largest hyperscaler contributing 28% of revenue in 2024, or ~$2.7 billion, implying OpenAI’s revenue could match that once it ramps.
Financials
Celestica’s financials are somewhat mixed – on one hand, the company expects strong switch demand to drive its Cloud and Connectivity Solutions (CCS) segment revenue up ~40% YoY in both 2026 and 2027, yet gross and operating margins are quite low compared to its key supplier Broadcom.
CCS Revenue to Grow ~40% Annually Through 2027
Celestica was also one of the few companies to really provide a solid long-term growth outlook in its AI-related segment this past quarter, with management confident in maintaining ~40% annual growth in CCS through 2027. While this is already reflected by consensus estimates (meaning Celestica will need substantial upside as growth expectations are already being baked in to shares), there are five main factors that could push growth above and beyond this guide – more on this below.
For 2026, Celestica guided for approximately 40% YoY growth in CCS to ~$12.6 billion, up from $9 billion guided for 2025, supported by views for accelerating 800G demand, early 1.6T ramps and the ramp of its next-gen AI compute platform to full-volume.
Driven by this growth in CCS, Celestica guided for initial revenue of $16 billion in 2026 during Q3’s report, nearly 18% ahead of the consensus estimate for $13.6 billion. This would correspond to ~31.1% YoY growth, a five point acceleration from FY25.Supporting this, management says they “currently have about 12 to 15 months of real solid forecast inputs and demand inputs from our customers,” and in many cases, visibility extends beyond that and longer into 2027. For example, some customers have a “certain amount of ASICs, for example, that they may have committed to, and it gives us some assurance as to the longevity and the size of the overall program.”
Also backing up the guidance is capacity, with Celestica explaining in Q2 that it can support “$3 billion to $4 billion of additional revenue” across its footprint in Thailand, Malaysia, Mexico and the US; Celestica is also aiming to expand production of 800G switches and add capacity for thousands of advanced AI racks annually by 2027.
For 2027, management explained that it is around 12 months too early to provide concrete numbers, but “right now, we think at least 40% [CCS growth] into 2027 is what we have visibility to,” at least 40% [CCS growth] into 2027 is what we have visibility to,” with opportunities to potentially accelerate that growth. Underscoring this strong outlook includes solid visibility into significant new program ramps starting in 2027 (multiple 1.6T ramps with hyperscalers), scale-up engagements translating to production and revenue, a next-gen custom ASIC platform, and mass-production of the rack-scale custom AI system with the new digital-native customer (likely OpenAI).
Thus, assuming ~40% growth in CCS and comments for high-single digit (6-8%) YoY growth in its Advanced Technology Solutions segment (ATS/focused on aerospace, industrial and semicap equipment), a reasonable initial estimate for Celestica’s 2027 revenue would be ~$21.3 billion. This would mark a slight two point acceleration to 33% YoY.
Five Factors Supporting Growth Accelerating Beyond 31-33%
There are five main factors that support Celestica’s revenue growth being materially faster than the initial 31% and 33% implied growth for 2026 and 2027, as each of these five factors all exhibit growth rates in excess of Celestica’s guidance.
While there is no guarantee that Celestica can match or exceed some of the growth rates in the opportunities below, these five factors provide ample evidence of market conditions that can support higher growth.
1) Ethernet Switch Demand Growing for Back-End Networking
As we had discussed in our Top 10 New Ideas report, networking is at the heart of the new architecture that Nvidia is shipping now as the increased bandwidth is instrumental in driving higher performance. The majority of growth is expected to be driven by back-end networking — scale-up and scale-out networks.
Scale-out is where the near-term growth opportunities for Ethernet switches lie, despite Ethernet adoption and revenue share historically lagging InfiniBand by a wide margin. High-bandwidth Ethernet switches are seeing strong demand in recent quarters as hyperscalers pivot away from Nvidia’s lock-in ecosystem of GPU + InfiniBand. Arista has said that momentum for Ethernet “has really shifted in the last year” while Nvidia touted that its new Spectrum-X Ethernet is annualizing at $10 billion in revenue. This is also validated by some of the largest operational GPU clusters of today, such as xAI’s Colossus, utilizing Ethernet for the back-end fabric (Nvidia’s Spectrum-X).
These proof points support bullish growth forecasts for the Ethernet switching market over the next few years. Through 2025 to 2029, the high-bandwidth Ethernet switch TAM is projected to rise at a 30% CAGR, driven by >800G rates rising at a 54% CAGR. In dollar terms, the market is expanding from ~$18 billion to nearly $50 billion over the period.
It is still quite early for the scale-up opportunity, as Broadcom and others just introduced the ESUN consortium (Ethernet for Scale-Up Networking) a few months ago. Scale-up is inherently linked to Broadcom’s 102.4T Tomahawk6 platform, which, as we had discussed in our recent newsletter, Broadcom Stock: The Silent Winner in the AI Monetization Supercycle, paves the way for >100K to 1 million accelerator clusters by allowing larger leaf-spine fabrics to be constructed, while drawing less power and keeping latency low.
Broadcom’s management points toward the flattening of the AI cluster as an important catalyst for this product, stating: “[…] Tomahawk 6 enables clusters of more than 100,000 AI accelerators to be deployed in just two tiers instead of three … this flattening of the AI cluster is huge because it enables much better performance in training next-generation frontier models through a lower latency, higher bandwidth and lower power.”
Broadcom already sees multiple >100K accelerator deployments using Tomahawk 6 for both scale-out and scale-up interconnect, with bookings at record rates. As such, Celestica sees scale-up as an “emerging multibillion-dollar new market opportunity,” having already secured some program wins for its first scale-up solutions leveraging Tomahawk6.
Main takeaway: A majority of Celestica’s switch deployments already go to back-end networking, with >800G growth expected to rise at a 54% CAGR through 2030, 14 points faster than CCS revenue. Main takeaway: A majority of Celestica’s switch deployments already go to back-end networking, with >800G growth expected to rise at a 54% CAGR through 2030, 14 points faster than CCS revenue.
2) Broadcom’s $73 Billion Backlog and AI Revenue CAGR
Broadcom provided an update on its backlog in early December with its fiscal Q4 results, saying that its total AI semiconductor backlog was >$73 billion, with AI switch backlog exceeding $10 billion. Tomahawk6 was booking at record rates, with management later clarifying that TH6 is one of the “fastest-growing products in terms of deployment that we've ever seen of any switch products.”
Broadcom expects the $73 billion backlog to be delivered over the next six quarters, and this is also expected to be a baseline, with CEO Hock Tan explaining that “we fully expect more bookings to come in over that period of time.”
Broadcom also provided a strong AI revenue guide for FQ1 of $8.2 billion, implying a 100% YoY and 26% QoQ growth, primarily driven by custom AI accelerators and Ethernet switches. For 2026 and 2027 AI revenue, BofA analysts are already laying the tracks for $50 billion and $100 billion, implying growth at a 122% CAGR if this pans out. This is notably 2X faster than Broadcom’s previously-laid-out 60% serviceable addressable market CAGR of 60%.
Analysts from RBC also believe that Broadcom’s AI semiconductor revenue acceleration “bodes well” for Celestica’s Q4 as the numbers were “’directionally positive’ for Celestica’s near-term business momentum” in CCS.
Main takeaway: Celestica’s close ties to Broadcom suggest that its accelerating XPU and networking driven momentum and backlog growth could drive a stronger acceleration for CLS.Main takeaway: Celestica’s close ties to Broadcom suggest that its accelerating XPU and networking driven momentum and backlog growth could drive a stronger acceleration for CLS.
3) ASICs CAGR Forecasts
The ASICs market is forecast to see substantial growth over the next few years, as a handful of major hyperscalers pursue ASICs-based AI platform roadmaps. Marvell has projected the ASICs market to rise at a 47% CAGR from 2023 through 2028, rising from $6 billion to $40.8 billion, or nearly 7X growth in five years.
On the other hand, 650 Group has a slightly more bullish forecast, projecting the ASICs TAM to rise at a 54% CAGR from $18 billion in 2025 to $104 billion in 2029, or a roughly 6X increase over the next four years. Broadcom’s rising backlog and increasingly large ASICs orders — $10 billion and $11 billion with Anthropic and the 10GW commitment from OpenAI – support strong growth as Google and Meta continue to build expand their ASICs platforms.
Main takeaway: Rising demand for ASICs over the next few years can drive stronger growth for Celestica as its solutions are almost exclusively focused on ASICs platforms. Main takeaway: Rising demand for ASICs over the next few years can drive stronger growth for Celestica as its solutions are almost exclusively focused on ASICs platforms.
4) Google’s TPU Shipments Accelerating
While the market continues to debate the TPU vs GPU story, there are some reports from analysts that see TPU volumes accelerating over the next few years. For example, Morgan Stanley projects Google’s TPU shipments to be 1.75 million in 2025, with initial contribution of ~0.5 million from TPU v7 Ironwood.
For 2026, the firm projected Ironwood shipments to rise 5X to 2.5 million, driving total TPU shipments up ~83% YoY to 3.2 million. For 2027, Morgan Stanley boosted its shipment forecast by ~67%, from 3 million to 5 million, driven mostly by TPU v8 and future generations, while its 2028 forecast was boosted 120% from ~3.2 million to 7 million. This would imply 2027 and 2028 growth of ~56% and ~40%, up from (6%) and 19% previously.
There are some unsubstantiated claims that Celestica could generate $500 million in revenue per 1 million TPUs shipped, and while this is unverified, if Celestica can capture that amount ($500) per chip, the TPU linked opportunity could be increasingly large over the next few years.
Main takeaway: Celestica could see solid revenue tailwinds linked to Google’s TPUs if shipments accelerate per some analyst estimates, assuming it remains engaged on the platform.Main takeaway: Celestica could see solid revenue tailwinds linked to Google’s TPUs if shipments accelerate per some analyst estimates, assuming it remains engaged on the platform.
5) Meta’s Capex
Meta’s capex strategy is to “aggressively front-load building capacity” to prepare for the most optimistic cases on when AI superintelligence will arrive, with the company outlining substantial capex growth in 2026. Meta aims to meet these capacity needs by “both building our own infrastructure and contracting with third party cloud providers.”
As a result, Meta expects capex dollar growth to be “notably larger in 2026 than 2025,” implying 2026 capex of at least $103 billion, as current guidance for 2025 at $70-72 billion implies a minimum of ~$32 billion YoY growth. However, considering management’s comments for notably larger dollar growth, there is potential for capex to come in at or above $110 billion, up ~55% YoY, above current estimates for $107.9 billion.
Main takeaway: Meta’s capex is expected to grow a minimum of >45% in 2026 as the company spends heavily on AI data center infrastructure, potentially driving faster growth for Celestica as it has worked closely with Meta on prior products (and potentially the upcoming next-gen AI rack ramp in Q4). Main takeaway: Meta’s capex is expected to grow a minimum of >45% in 2026 as the company spends heavily on AI data center infrastructure, potentially driving faster growth for Celestica as it has worked closely with Meta on prior products (and potentially the upcoming next-gen AI rack ramp in Q4).
Celestica’s CCS segment is broken down further into two other subsegments – Communications (networking) and Enterprise (servers and storage). This breakdown highlights a key risk moving to Q4, as guidance implies Communications revenue will decelerate sharply QoQ, an odd print considering the strong ramp in switching products.
In Q3, revenue from CCS segment rose 43% YoY to $2.41 billion, driven by an 82% YoY increase in Communications revenue to $1.94 billion offsetting a (24%) decline in Enterprise to $477 million on an AI program transition with a hyperscaler.
For Q4, CCS revenue is implied to accelerate nine points to 52% YoY, with Communications growth guided in the high-60s YoY and Enterprise guided in the low-20s as the new AI program is set to ramp. Despite the seemingly strong guide in Communications, QoQ growth would be just 1% QoQ, a sharp deceleration from Q3’s 18% QoQ growth.
This would mark Communications’ lowest sequential growth in the last two years, and its first time reporting single-digit sequential growth in the last seven quarters, raising a potential red flag considering Communications is primarily driven by networking/800G switches.
A likely explanation of this could be the strong outperformance in Communications in Q3 – guidance was for low-60s YoY growth, which Celestica beat by ~20 points. As a result, QoQ growth was likely expected to be ~4%, but came in at 18%, possibly representing a much stronger-than-expected ramp of 800G platforms in the quarter.
Margins
Margins continued to expand in Q3, with some signs of operating leverage arising from strong Communications growth as operating margin expanded by 4.7 points YoY versus a 2.6 point YoY expansion for gross margin.
GAAP gross margin was 13.0% in Q3, up 0.2 points QoQ and 2.6 points YoY.
GAAP operating margin of 10.2%, up 0.8 points QoQ and 4.7 points YoY. Adjusted operating margin was 7.6%, up 0.2 points QoQ and 0.8 points YoY.
GAAP net margin of 8.4%, up 1.1 points QoQ and 4.8 points YoY. However, adjusted net margin was just 5.7%, up just 0.1 points QoQ and 0.7 points YoY due to a $113 million impact from gains on total return swaps.
For a segment breakdown:
CCS adjusted gross margin was 12.1% in Q3, up from 11.9% a year ago. CCS adjusted operating margin was 8.3%, up from 7.6% a year ago. Positioning as an ODM may not find much more margin upside even as higher-margin products such as advanced AI rack systems ramp.
ATS adjusted gross margin was 10.6%, up from 8.4% a year ago. ATS adjusted operating margin was 5.5%, up from 4.9% a year ago.
For fiscal 2025, Celestica guided for adjusted operating margin to be 7.4%, and for 2026, only a slight 0.4 point increase to 7.8% despite the 31% growth on the top-line. This suggests that its positioning primarily as an ODM may limit future upside to operating margins even as hyperscaler-linked revenue and higher-margin, higher-complexity designs increase in its mix:
“So we continue to see the benefits of both operating leverage as well as positive mix in our numbers, on track for about 7.4% operating margin at the company level for 2025, and we're guiding that, that can expand now going into 2026. We do continue to believe that there's opportunities for even more margin expansion. But again, I'm not giving formal numbers for '27 at this point.
When you look at our ATS business, the business has done very well on doing some selective pruning in order to really focus on the highest value engagement. And so we're really happy with the margin expansion that we've seen in ATS already. And we think that there's opportunities to continue to expand and get it above 6%, hopefully in the near to medium term.
On the CCS side, which is operating in the low 8s right now, what's working to our favor is the fact that we will continue to be seeing growth in networking, which are primarily our HPS products. And our HPS products are accretive to the company and accretive to CCS. And so as we see growth in that area, we will continue to see some margin upside.
That being said, we do continue to evaluate how we can support our customers on multiple areas such as doing complex rack integration work. And so sometimes that will be margin dilutive.”
Earnings
Celestica reported GAAP EPS of $2.31 in Q3, beating the $1.38 estimate by 67.6%. Adjusted EPS was $1.58, beating the $1.49 estimate by just 6% and representing growth of 52% YoY.
For Q4, Celestica guided adjusted EPS to be in the range of $1.65 to $1.81, which, at the $1.73 midpoint, is only marginally ahead of estimates for $1.71. This also corresponds to a slight acceleration to 55.9% growth. Looking ahead to Q1 and Q2, estimates point to 52.3% growth and 41.5% growth, decelerating in both quarters, likely driven by margin expansion slowing.
For fiscal 2025, Celestica boosted its adjusted EPS outlook by 7.3% to $5.90, from its previous forecast for $5.50 and pointing to 51% YoY growth. For fiscal 2026, Celestica outlined an initial guide for $8.20 in adjusted EPS, up 39% YoY and well ahead of estimates for $7.22.
Cash
On the other hand, cash flows are rather thin and fell to the lowest level in a year.
Operating cash flow was $126.2 million, or a 4% margin, down from 5.3% in Q2 and 4.9% in the year ago quarter. OCF growth was just 2.4% YoY and was also the lowest cash flow since the year ago quarter.
Adjusted FCF was $89 million for a 2.8% margin in Q3, up 15.6% YoY but also the lowest level since the year ago quarter. Adjusted FCF margin was down from 4.1% in Q2 and 3% in the year ago quarter.
For fiscal 2025, Celestica raised its adjusted FCF guidance slightly to $425 million, from $400 million prior, for a 3.5% margin, while capex is guided to $200 million, or 1.6% of revenue. Fiscal 2026 adjusted FCF was guided at $500 million, up 18% YoY and for a 3.1% margin, with the margin decline driven by higher capex, guided to rise 50-100% YoY to $300 to $400 million, or 2.2-2.5% of revenue.
Cash and equivalents totaled $305 million while debt totaled $728 million in term loans. Including an undrawn revolver, total liquidity is approximately $1.1 billion. Celestica’s gross debt to TTM adjusted EBITDA was 0.8x, improving by 0.1 points sequentially and 0.3 points from last year.
Inventories were $2.05 billion, up nearly 7% QoQ, while accounts receivable totaled $2.44 billion, also up nearly 7% QoQ.
Valuation
Celestica is trading just off peak multiples on the top and bottom line following this recent pullback after Broadcom’s earnings. Celestica’s forward PS is currently at 2.5x, well above the five-year average of 0.75x and 25% above the 2x multiple it commanded at the start of September. Even on the fiscal 2026 guide, shares are at a 1.9x multiple.
On a forward PE basis, shares are trading at 45.7x fiscal 2025 adjusted EPS and 32.3x fiscal 2026, well above its five-year average forward PE of 15.4x and prior resistance at 25x in late 2024 and early 2025. The company has been seeing a re-rating higher as it captures AI-growth tailwinds, but any hint of softness in growth could easily see Celestica re-rated lower given growth through 2027 is visible and may already be priced in.
Conclusion
Celestica is benefiting from strong market demand for 800G switches with its Tomahawk6-based 1.6T switches on deck for availability later in 2026. The company guided for an impressive five-point acceleration in 2026 during Q3’s report, outlining more than 31% growth to $16 billion in revenue. 2027 was implied to accelerate slightly to around 33% YoY to surpass $21 billion in revenue, again on strong switch demand, the ramp of 1.6T programs, and a new custom rack-scale solution with a digital native customer entering the picture, likely OpenAI.
However, Celestica’s valuation remains quite stretched, with the company sitting well above its five-year average multiples on the top and bottom line as shares are being re-rated higher for its visible topline acceleration and strong 40% growth momentum in CCS – this extended valuation will need to be watched considering growth expectations could be getting priced in already given the high level of visibility into 2027.
Damien Robbins, Equity Analyst at I/O Fund contributed to this analysis.
Please note: The I/O Fund conducts research and draws conclusions for the Fund’s positions. We then share that information with our readers. This is not a guarantee of a stock’s performance. Please consult your personal financial advisor before buying any stock in the companies mentioned in this analysis.
Memory is typically a cyclical industry that is lower margin and lumpy, yet it is seeing a newfound resurgence from AI that is strong enough to transform commoditized hardware into a secular trend as the AI economy is built out. AI servers use more DRAM and NAND than traditional servers, relying heavily on high-bandwidth memory (HBM) for training and inference.
As is stands, the AI-driven demand for memory (especially HBM and high-performance DRAM) is still in the early stages of a multiyear growth cycle. The company’s CEO and Chairman, Sanjay Mehrotra, also mentioned in the September earnings call, “Memory is very much at the heart of this AI revolution. This means a tremendous opportunity for memory and certainly a tremendous opportunity for HBM."
The HBM market is projected to reach $35 billion this year, doubling YoY, with Micron’s September results confirming that the market was well on track to be over $30 billion as of Q3. Looking ahead, the shift to HBM4 with Nvidia’s Rubin architecture and AMD’s MI400 series will represent another important growth lever come 2026 as HBM content per GPU and per rack surges, paving the way for HBM to potentially triple again by as early as 2028.
Not only is HBM a focal point due to its rising importance and thus increasing content per GPU, but other memory products are quickly coming to the forefront, notably low-power DDR5 memory (LPDDR5X) and data center solid state drives (SSDs).
Below, we look at the memory products front and center of this AI-driven cycle, structural drivers behind rising AI memory demand such as AI inference, supply and inventory constraints driving prices rapidly higher, long-term growth outlooks and more.
Overview: DRAM and NAND’s Role in AI
Demand for high-capacity memory is driven by generative AI and LLMs, which both require significant amounts of computing power and substantial amounts of DRAM to meet elevated performance requirements. Within DRAM, demand is focused more specifically around high-bandwidth memory (HBM) and double-data rate 5 DRAM (DDR5) for its increasing content in AI accelerators — SK Hynix’s head of DRAM marketing Park Myung-soo has explained in the past that “an AI server requires 500-gigabyte (GB) or larger high bandwidth memory (HBM) chips and at least 2-terabyte (TB) DDR5 chips.” Now, we’re seeing nearly that amount of HBM being put on a single GPU rather than an 8-GPU system.
High bandwidth memory (HBM) offers higher bandwidth, capacity, performance, and lower power by vertically stacking up to twelve DRAM memory chips to shorten how far data has to travel, while also allowing for smaller form factors. Stacked memory chips are connected through something called “through silicon vias” or TSVs.
HBM is now mission-critical, especially for inference, as increasing bandwidth and capacity per HBM generation paves the way for significant leaps in throughput with each GPU generation. Currently, the leading AI accelerators from Nvidia and AMD utilize HBM3e, an enhanced HBM3, while the next-gen Rubin and MI400 architectures are set to bring HBM4 mainstream next year – more on this below.
DDR5 DRAM, or double data rate 5, is aimed to double bandwidth and data transfer speeds at a lower latency and power consumption than its predecessor, DDR4. DDR5 memory chips can be mounted on circuit boards to create memory modules, for use in servers or PCs. DDR5’s increased bandwidth allows for faster processing for memory-intensive applications, such as generative AI and training LLMs. Memory giant SK Hynix saw high-capacity DDR5 (>128GB) revenue more than double QoQ in Q3.
Demand for a low-power DDR5 variant, LPDDR5X, is rising sharply due to its role in Nvidia’s Grace and Vera CPUs, as LPDDR5x is delivering up to 5X better throughput, a more than 35% increase in memory bandwidth with up to 77% lower power consumption. This combination can improve system power efficiency (performance per watt) by up to 10%, per Micron.
Emerging with Nvidia’s GB300 racks (and soon Rubin racks) are SOCAMM modules, which combine LPDDR5X with a Compression Attached Memory Module (CAMM). SOCAMM modules can deliver up to 2.5X higher bandwidth with lower power consumption and a smaller footprint versus traditional RDIMMs (registered dual in-line memory modules).
Not to be forgotten is memory’s second half, NAND, as it also plays a vital yet less visible role in AI, as its high-capacity, reliable storage is increasingly important in meeting growing inference demands. NAND’s importance is primarily concentrated to NAND-flash based data center solid-state drives (SSD).
SSDs can boast superior performance in speed, latency, energy efficiency and reliability compared to hard disk drives (HDD). The high-speed read capabilities of SSDs help process vast datasets in training large LLMs and multi-modal models, as well as store model checkpoints. For inference, SSDs are typically used to store ‘hot’ data, or data needing to be accessed frequently, making them crucial for inference workloads.
HBM3e, HBM4 and the Need for Increased Memory Bandwidth
HBM3e is the primary version of HBM shipping currently, supporting both Nvidia’s H200 and Blackwell architectures, as well as AMD’s Instinct MI350 series and Google’s TPU v7 Ironwood. HBM4, the next generation, is expected to support Nvidia’s upcoming Rubin platform later in 2026, along with AMD’s Instinct MI400 series.
The reason that AI accelerators are quickly upgrading to the next generation of HBM is because HBM capacity and bandwidth are consistently increasing, which, when combined with increasing capacity per chip, translates directly to massive leaps in throughput, or tokens processed per second. This means that newer chip generations, such as the shift from Nvidia’s Hopper generation to Blackwell, are exponentially more performant on LLM inference workloads.
For example, HBM2e, used on Nvidia’s H100, delivered a modest 3.6 Gb/s data rate (speed of data transfer), leading to 461 GB/s of bandwidth per HBM cube. With HBM3, data rates improved to 6.4 Gb/s and stack heights moved from 12 to 16, thus boosting bandwidth by more than 75% to 819 GB/s.
With HBM3e, data rates increased substantially to 9.6 Gb/s, boosting bandwidth to 1.23TB/s, or nearly 3X that of HBM2e. Translating this to Nvidia’s H200 meant that it could deliver 1.4X to 2X faster LLM inference versus the H100 as bandwidth per chip rose from 3TB/s to 4.8TB/s and HBM capacity rose 1.76X from 80GB to 141GB.
With HBM4, the main upgrade is a doubling of interface bits from 1,024 to 2,048, or the number of data bits that can be transferred simultaneously between the memory chip and the GPU. This means that even at the JEDEC standard of 8 Gb/s data rate, a modest decline from HBM3e, bandwidth per HBM4 stack rises to more than 2 TB/s, a 2.5X boost from HBM3 and a ~66% increase from HBM3e. However, Micron claims that its HBM4 boosts data rate to 11 Gb/s, delivering 40% higher bandwidth at 2.8 TB/s per stack, along with 20% better power efficiency and 60% better performance versus HBM3e.
While these increases may not seem significant when looking simply at upgrades per HBM generation, looking at the exponential increases in bandwidth and inference performance per GPU generation shows a better picture.
Nvidia’s 8-GPU HGX H100 system delivered a mere 24 TB/s of aggregate memory bandwidth, yet the HGX B200 system boosted that ~2.6X to 62 TB/s with the shift to HBM3e and more HBM3e content (more on this below).
The scale-up architecture of Nvidia’s GB200 and GB300 NVL72 brought a massive boost to aggregate memory, with both rack-scale solutions offering 576 TB/s, or 24X more than the HGX H100 systems. Nvidia says the GB200 can offer throughput of up to 116 tokens/s on GPT-MoE-1.8T model, a 30X improvement on real-time LLM inference versus the HGX H100, with performance gains also aided by improvements in NVLink and CX8 network interface cards.
Nvidia’s upcoming Vera Rubin architecture will boost aggregate memory bandwidth by as much as 8X from here over the next two years.
Nvidia’s upcoming Vera Rubin NVL144 is expected to take aggregate memory bandwidth to 1.4 PB/s, and 1.7 PB/s with the CPX platform. This is the equivalent of 1,400 TB/s to 1,700 TB/s, or a ~2.4X to ~3X increase versus the GB200/GB300 racks. Jensen Huang claims that the NVL144 system bandwidth is “the entire data usage of the Internet in one second.”
With the NVL576, aggregate memory bandwidth will continue to surge, with the rack boasting 4.6 PB/s, or 4,600 TB/s of bandwidth. This is another roughly 3X boost to the NVL144, and compared to the GB200/GB300, a massive 8X increase in just two years.
HBM’s Longer-Term Tailwind: Capacity per Chip Surging
HBM capacity per chip continues to rise with each new generation of GPU, and this is a primary contributing factor behind the surging aggregate memory bandwidth discussed above, paving the way for accelerated throughput gains and inference performance. For example, we’ve seen a ~3.5x increase in HBM content in short fashion on Nvidia’s GPUs within about three years’ time frame:
The H100 featured 80GB of HBM2e content per chip. This chip began shipping in Q4 2022 and ramped in early 2023.
The H200 featured 141GB of HBM3e content per chip, 1.76x higher than its predecessor.
The B200 features 180GB of HBM3e content, more than double the H100 and a 28% increase versus the H200. In an 8-GPU server configuration, the B200 boasted 1.44TB of HBM content.
The B300 boasts 288GB of HBM3e content, a 60% increase versus the B200 and over 3.5x more than the H100. In an 8-server configuration, the B300 has 2.3TB of HBM content. This chip is beginning to ship now in Q3-Q4 2025.
The upcoming Rubin chip will remain at 288GB, but transition to HBM4 for more bandwidth.
Putting in context Nvidia’s rack-scale solutions, the GB200 and GB300 NVL72, shows just how rapidly HBM content is increasing. The GB200 supports up to 13.4TB of HBM content, while the GB300 supports up to 21.7TB of HBM, nearly 34X higher than the 640GB of HBM content in the 8-GPU DGX H100 servers.
AMD is also showing surging memory requirements, to the tune of 3.5X across two main generations:
The Instinct MI250 featured 128GB of HBM2e memory.
The MI350X featured 288GB of HBM3e memory, a 125% increase versus the MI250 and on par with Nvidia’s Blackwell Ultra.
The MI400 series is expected to feature 432GB of HBM4 memory, a 50% increase versus the MI350X and the Blackwell Ultra. In the Helios rack configuration slated for 2026, the MI400 will boast 31.1TB of HBM content, 1.5x more than the GB300 NVL72.
Packing more HBM per chip is also not exclusive to GPUs, with Google’s TPUs notably seeing a 6X jump in HBM capacity over one generation (one year) and a 12X increase in two generations:
Google’s TPU v5e, released to general availability in 2023, featured 16GB of HBM capacity.
TPU v6e (Trillium), released in 2024, doubled HBM capacity per chip to 32GB.
TPU v7 (Ironwood), released this year, boosted HBM capacity by 6X over Trillium to 192GB per chip, or 12X growth from v5e.
This surge is expected to continue through 2027 as HBM4 and then HBM4e come online – it has been estimated that in a 20-high configuration could pack 80GB of memory per HBM chip, up from 36GB per 12-high HBM3e cube today. Assuming similar usage of eight cubes, this could take memory per GPU up from 288GB in Nvidia’s B300 to 640GB in future chips.
HBM Market Doubling in 2025, Expected to Triple Again by as Early as 2028
The HBM market is forecast to double this year to approximately $35 billion, up from less than $18 billion in 2024, with growth driven by increasing content per GPU such as that with Blackwell and Blackwell Ultra as well as from capacity constraints. As of Q3, HBM is now likely above a $30 billion annualized run rate, supported by comments from Micron last quarter that its HBM revenue grew to almost $2 billion; with HBM share expected to nearly match its DRAM share (of 22% in Q2 to 25.7% in calendar Q3), this would imply the HBM market is likely in the mid-$8 billion range, or around $32-33 billion annualized. HBM’s share of DRAM revenue is also rising sharply, expected to rise ten points this year, from 18% in 2024 to 28% in 2025, with more growth ahead through 2030.
Through 2026 and 2027, the outlook for HBM remains fairly positive, with SK , SK Hynix, Samsung and Micron already selling out of HBM3e and HBM4 capacity through the end of 2026. This underscores the robust demand environment stemming from AI accelerators, with Micron seeing HBM bit shipments outpacing DRAM bit growth, but also may limit revenue upside as prices have been contracted over the next four quarters.
On pricing, HBM4 is expected to carry a significant premium to HBM3e, currently used for Nvidia’s Grace Blackwell chips. Analysts from UBS had estimated that HBM4’s price premium could be as much as 30%, though reports of Samsung’s discussions over HBM4 supply with Nvidia dwarfed that – Samsung was said to be targeting price parity with SK Hynix on HBM4 around $500, up ~50% from the mid-$300s for HBM3e. These price increases will support strong growth as HBM4 volumes ramp.
Looking forward, industry analysts project the HBM market to reach $98 billion to $100 billion by 2030, representing a 31.5% CAGR from 2024’s $18 billion, outpacing DRAM’s growth by 3X, which is expected to rise at an 11.7% CAGR to $194 billion. As a result, HBM’s share of DRAM revenue is expected to surpass 50%.
However, in its Q1 report, Micron said it now expects the HBM TAM to reach $100 billion as early as 2028, two years sooner than its prior forecast. This would represent a ~42% CAGR from $35 billion, or more than 10 points faster than the base case forecasts.
HBM’s Challenges: No Tail-End to Shipments, Supplier Shifts
The reason that HBM can be such a challenging market is two-fold – supplier qualifications can (and do) change rather quickly between generations for SK Hynix, Samsung and Micron, and the winner is oftentimes determined by time-to-market, or whichever company can hit mass production first.
Micron executives explained that HBM is unlike standard memory products, and that they do not expect a long tail in these products, meaning that once the next generation comes online and ramps (HBM3 to HBM3e, HBM3e to HBM4, etc), demand for the old generation dissipates quickly. This in turn means that whichever suppliers can either qualify first and reach mass production first have an advantage when it comes to revenue and even margins. For example, SK Hynix was the main supplier of HBM for Nvidia’s H100, yet Micron was the main supplier for the H200.
For HBM4, SK Hynix said in early September that it had finished development of HBM4 and was ready for mass production, while Micron also announced that month that it had begun shipping HBM4 samples to customers. On the other hand, Samsung just finished development of HBM4 in early December and began shipping samples to Nvidia. However, SK Hynix is reportedly delaying the start of mass production from Q2 2026 to Q3 2026 to better align with Rubin’s ramp.
Rising Demand for LPDDR5X and the DDR5 Profitability Dilemma
Demand for LPDDR5X is rising sharply due to its role in Nvidia’s Grace and Vera CPUs, as LPDDR5x is delivering up to 5X better throughput, a more than 35% increase in memory bandwidth with up to 77% lower power consumption versus typical DDR5.
Low power is critical with Nvidia’s GB racks as well as Rubin, as power consumption has been surging per rack, and already pushing the upper boundaries of what current data center infrastructure can handle. Current builds, such as Vantage’s upcoming 1.4 GW campus in Texas for Oracle, are only designed for ultra-high density racks up to 250kW, meaning these new facilities could quickly be phased out and require new infrastructure to accommodate increasingly power hungry racks.
Nvidia’s GB300 and Rubin platforms will use a purpose-built SOCAMM module optimized for AI servers, which combines LPDDR5X with a Compression Attached Memory Module (CAMM), aimed at maximizing performance and reducing power consumption. This is currently provided by Micron, which reported 50% QoQ in LPDDR revenue to a new record last quarter.
When comparing to smartphones, the usual destination for LPDDR memory, the content demands for AI servers are profoundly large:
“Indeed, each Grace CPU in today's platform is equipped with 480 GB of LPDDR5X memory (a premium smartphone uses 16 GB of LPDDR5X), but this is going to at least double with Vera CPUs, possibly straining LPDDR5X supply.”
So not only do you have Nvidia’s Blackwell and Blackwell Ultra lines ramping, with those consuming 30X LPDDR5X memory as a typical smartphone, but that gap is poised to widen tremendously later next year as Rubin ramps, with the Vera CPU expected to contain 1.5TB of LPDDR5X, more than 3X the Grace CPU and as much as almost 94 smartphones.
Keep in mind that the 480GB for the Grace CPU and the 1.5TB for Vera CPU are per chip, per chip, meaning that the GB200 NVL72 rack featuring 36 CPUs will consume 17.28TB per rack. per rack. For the Rubin NVL144, with the same 36 CPU count, LPDDR5X content would surge to 54TB per rack, and in the NVL576, with 144 CPUs, content quadruples to 218TB per rack218TB per rack. That is the equivalent of 13,625 premium smartphones.
Nvidia’s demand needs are expected to place substantial upward pressure on prices, as Counterpoint Research believes it now is an LPDDR “customer on the scale of a major smartphone maker — a seismic shift for the supply chain which can’t easily absorb this scale of demand.”
Global DRAM Market Surges 31% QoQ in Q3, Q4 Pricing to Remain Strong
You would be hard pressed to find another segment of the AI data center industry posting growth to this degree on a sequential basis. Data from TrendForce estimates that the global DRAM market recorded growth of 30.9% QoQ in calendar Q3 to $41.4 billion. In dollar terms, this represented QoQ growth of ~$9.7 billion, or nearly as large of a QoQ jump as Nvidia reported in its most recent quarter. This growth was driven by “significant increases in conventional DRAM contract prices, higher bit shipments, and growing HBM volumes.”
For a supplier breakdown, SK Hynix’s revenue grew 12.4% QoQ to $13.75 billion, fueled by seasonal price increases and significant bit shipment growth. Samsung also reported similar significant growth in bit shipments, with revenue up 30.4% QoQ to $13.50 billion. Micron followed with a substantial 53.2% QoQ increase to $10.65 billion, per TrendForce (note that this is for calendar Q3 which does not align with Micron’s fiscal year calendar).
As of November, TrendForce estimates that DRAM contract prices will accelerate into Q4, predicting conventional DRAM contract prices will surge by another 45% to 50% QoQ, while total contract prices (which includes HBM) will increase by 50% to 55% QoQ – this is a substantial uplift from projections for 18-23% QoQ growth in Q4 at the end of October.
Contributing to strong pricing is DDR5 DRAM, where prices rapidly skyrocketed – from late September to early November, prices have as much as quadrupled, with impacts felt most on consumer products. Samsung also reportedly just boosted DDR5 prices by 100%, citing no stock left.
However, revenue growth in Q4 will likely be lower than pricing as bit shipments are projected to decline sequentially due to rapid inventory depletion. DRAM supplier inventory levels are projected to range between two to four weeks, a major crunch from 5.5 weeks on average last quarter and more than 15 weeks at the start of the year.
Turning to 2025 as a whole, HBM is expected to be a primary growth contributor for the DRAM industry. Current projections have DRAM revenue rising ~35% YoY, or $32 billion, to $127 billion in 2025, meaning HBM is contributing more than half of that dollar growth at ~$17 billion. This is also marking a rapid recovery from 2023’s trough of $52 billion, with the $127 billion projection representing two-year growth of 148%.
For 2026, it is these tailwinds above, along with tight supply, that can continue to drive strong growth in the DRAM market moving through the year, especially as HBM4 begins to ramp initially with Nvidia’s Rubin platform along with AMD’s MI400 platform.
Inference is Creating a Secular Tailwind for Data Center NVMe SSDs
Data center solid state drives (SSDs), such as those based on NAND flash memory, are an often overlooked but equally important memory component when it comes to AI training and inference. This is because data center SSDs offer higher read-write speeds critical for accessing and transferring data rapidly, along with higher performance and energy efficiency, making them vital for larger-scale AI training and inference workloads.
NVMe (Non-Volatile Memory Express) is a protocol designed specifically for NAND-flash based SSDs that optimizes performance by reducing latency and increasing data transfer speeds by utilizing the PCIe bus. This helps provide the high throughput and fast data transfer speeds necessary for AI workloads – NVMe SSDs can increase performance by more than 2X versus SATA SSDs.
There are five main types of NAND flash used in SSDs, delineated by the number of bits of data that can be stored per cell:
SLC (single-level cell): Stores one bit of data per cell, meaning data can be retrieved faster. SLC offers the best performance and highest endurance, though it is typically the most expensive.
MLC (multi-level cell): Stores two bits of data per cell, allowing for a higher data density or higher capacity, though this comes at the expense of performance and endurance. MLC is typically found in consumer NAND products.
TLC (triple-level cell): Stores three bits per cell, increasing density and capacity and reducing cost, but also increasing chance for error.
QLC (quad-level cell): Stores four bits per cell, providing significant storage capacity (4X that of SLC) and lower costs, making QLC suitable for large-capacity solid-state drives. Meta has made the case for QLC SSDs in data center applications due to the higher density and improved power efficiency versus TLCs at a price that allows for significant scaling, though it says price is not yet competitive enough for broader deployments.
PLC (penta-level cell): The next evolution of NAND flash that stores five bits per cell, aiming for significant high density storage but also facing high error rates.
AI training and inference are two main long-term drivers for SSD demand, which is projected to rise ~6X from 2024 to 2030, from 181 exabytes (EB, or equal to 181,000,000 TB) to 1,078 EB, under McKinsey’s base case scenario. Training demand projected to rise at a 62% CAGR to from 7 EB in 2024 to 127 EB by 2030. On the flipside, demand from AI inference is expected to grow at a 105% CAGR from 6 EB to 447 EB by 2030, giving inference a 41% share of demand versus less than 12% for training.
This is not only driven by development of more LLMs, but also the increasing size and complexity of frontier models, where training data sets and context windows for inference are getting increasingly large.
For example, EpochAI estimates that training data set sizes are rising 3.7X per year on average, or nearly doubling every six months. There are some models that are scaling much quicker. For example, Meta’s Llama2-70B from 2023 was trained on 2 trillion tokens, while Llama3-70B, from 2024, was trained on 15 trillion tokens, a 7.5X increase. Multi-modal models, those integrating audio, video, image or more, are also likely to require significantly more SSD storage, with McKinsey estimating in the hundreds of TBs depending on the mix of data needing to be stored.
Looking at tensor parallelism from a memory perspective also shows why the ability to distribute workloads across tens to thousands of GPUs is such a game-changer for AI training and inference. After accounting for memory required to store model parameters and for the activation buffer, a single AMD MI300X GPU can handle a max request of ~6,500 tokens on Llama-70B, per TensorWave. However, when you distribute model parameters across 8 GPUs along with the same buffer, that 8-GPU server could now handle a max request of 523,000 tokens, an ~80X increase, with gains that only compound as server size and memory increase.
The increasing size and complexity of models also ties directly to a major pain point when it comes to inference: “As models grow in complexity and require longer contexts, their memory footprint expands beyond what a single GPU can handle. This results in inefficiencies where GPUs are memory-starved, causing significant bottlenecks in AI token generation.”
To put this GPU memory bottleneck in real-life application for inference, AI inference acceleration startup WEKA states that when it tested Llama-3.1 70B with no optimizations, a 100K token prompt took 24 seconds to pre-fill into the model before any output could be generated, but “extending GPU memory to ultra-fast storage [NVMe SSDs] can dramatically improve token processing efficiency.” When configuring an Nvidia DGX H100 server with an 8-node exabyte-scale NVMe SSD pod, WEKA says its “tests demonstrated a staggering 41x reduction in prefill time on LLaMA3.1-70B, dropping from 23.97 seconds to just 0.58 seconds,” significantly improving model efficiency with zero optimizations – simply from adding SSDs to extend GPU memory. This pre-fill time would feel near instantaneous for an end user versus a 24 second delay.
Other long-term growth vectors include increased adoption of retrieval augmented generation (RAG), which “assembles companies’ own data into vectorized databases, which models then refer to, improving the accuracy and specificity of outputs.” RAG would then require two forms of storage – active storage of useful data, and vector database storage to organize that active data to be accessible by LLMs.
A more rapid uptake of RAG or faster multi-modal model adoption could push data center SSD demand up to a 42% CAGR through 2030, reaching 1,490 EB or ~8X 2024’s demand, while slower uptake could see demand rise at a 25% CAGR to 702 EB, or ~4X 2024’s demand.
Data Center SSD Revenue Up 28% QoQ in Q3
Similar to DRAM, data center SSD shipments and prices were strong in Q3, driven by hyperscaler demand for AI infrastructure and general-purpose servers. Revenue from the top five companies – Samsung, SK, Micron, Kioxia and SanDisk – rose ~28% QoQ to a new record at $6.54 billion, per TrendForce. Notably, this was broad-based strength, with growth at the five firms all ranging between 26-30% QoQ.
For Q4, there are a few dynamics in play that are likely to keep prices and thus revenue growth strong. For example, supplier inventories are expected to have fallen sharply, from 10-15 weeks in early Q3 to just 7-10 weeks at the start of Q4, which was said to be ‘below healthy levels’, with enterprise SSD supply growth substantially lagging demand. SanDisk says that its storage-focused SSD is “growing in demand with 2 hyperscaler qualifications underway and a third hyperscaler along with a major storage OEM planned for calendar year '26.”
In November, TLC and QLC SSDs reportedly experienced strong price increases, with 1 TB TLC SSDs seeing sharp increases and the “most significant shortage due to persistent enterprise SSD demand.” 512 GB TLCs were estimated to see the most significant price hikes at ~65% MoM, while the QLC supply chain tightened and forced prices higher.
Additionally, TrendForce points out that these inventory and demand dynamics mean “supply shortages in 2026 are becoming increasingly apparent,” providing an additional lever for SSD prices to rise through next year and support more revenue growth as long as inventories and bit shipments do not hinder that.
Can the Memory Boom Last Through 2028?
There have been rising discussions regarding the strength of this current memory boom, and whether it can stretch through 2027 or even 2028, as reports from Korea and analysts from Morgan Stanley now estimate. The industry currently has the necessary ingredients for a sustained upcycle: strong demand, supply shortages combined with lean inventories, and strong pricing trends. A multi-year supercycle would likely require persistent supply shortages driving strong pricing power, stemming from elevated demand. such as strong HBM and LPDDR5X content growth with next-gen GPU racks, and strong inference-led tailwinds for SSD growth.
There are signs emerging that support such a view. Micron said in November that it is seeing “much more supply-demand tightness than we expected” in September and expects this tightness “to continue beyond 2026.” However, perhaps the most important comment from Micron came from Q1’s call this past week, with management saying that “in the medium term, we are only able to meet about 50% to 2/3 of our demand from several key customers.” SK Hynix also believes it will be “difficult to resolve the supply shortage by the first half of 2027.” More specifically on NAND, SanDisk says that demand “continued to outpace our supply, a dynamic we expect to persist through the end of calendar year '26 and beyond.”
Samsung and SK Hynix have both been rather straightforward about wanting to avoid oversupply, as this could cut the current cycle short and eat into profitability quickly. Samsung executives have said that they will “minimize the risk of oversupply through a capital expenditure strategy that balances customer demand and pricing," and instead of rapidly expanding production, they will focus on profitability.” SK Hynix is on a similar page, though reports have suggested it could boost 1c DRAM production by ~8X by 2026, from 20K units per month to 160K, in order to meet rising SOCAMM and GDDR7 demand.
The profitability point ties into capacity allocations and exhibits why supply remains tight. For example, HBM3e and DDR5 share production capacity, and through the first part of 2025, HBM3e “commanded a price premium more than four times that of DDR5.” However, with the recent surge in DDR5, profitability is now on track to surpass HBM3e by Q1, meaning suppliers may shift HBM3e capacity to DDR5 to boost profits. Samsung is already planning this shift from HBM3e to DDR5, with the expectation that it will shift ~80K wafers per month, while Micron is shelving its consumer DRAM and SSD unit, Crucial, to focus on HBM, DDR5 and enterprise SSDs.
Competitive risks aside, evidence of the size of this boom will be visible within revenue growth trajectories and margins. But perhaps the most important question for this cycle is, can the combination of tight supply, low inventories, sharply rising prices and strong (and rising) demand drive margins and earnings power to surpass 2018 levels in a sustainable way?
Currently, Micron’s revenue estimates and revisions give two primary takeaways into the duration and size of the cycle – analysts are more bullish about the boom lasting into 2028, though they are essentially completely divided on the overall strength of it, with revisions showing a massive range between low and high end forecasts.
Above shows revenue estimates heading into Micron’s fiscal Q1 report on December 17, with fiscal 2027 and fiscal 2028 both seeing estimates revised 41-43% higher since July. FY27 estimates had moved from $48 billion to $68 billion, while FY28 moved from $51 billion to $72 billion. A majority of the upward revisions have come since September, aligning with surging DRAM prices.
However, Micron gave a blowout Q2 guide, forecasting revenue of $18.7 billion at midpoint, more than 31% above consensus for $14.23 billion and representing growth of 37.1% QoQ and 132.2% YoY. This has pushed estimates even higher – FY26 and FY27 already see revisions ~$16 billion higher to $74.1 billion (+98% YoY), and $84.3 billion (+15%), while FY28 rose $11 billion and points to flat growth.
Analysts remain essentially completed divided on the potential strength of the cycle, with the gap between the low and high end of revenue estimates doubling from fiscal 2026 to fiscal 2027 and 2028.
For example, estimates for fiscal 2026 range from $53 billion on the low end to $82 billion on the high end, or a $29 billion range. For fiscal 2027, the low end falls to $46 billion, potentially on pricing peaking much sooner than expected, while the high end rises to $106 billion, a $59 billion range. Fiscal 2028 also sees a $61 billion range between the high and low end of $53 billion to $114.5 billion.
More impressively, Micron is showing that gross and operating margins have already surpassed the 2018 peaks, and commentary for expansion through the year suggests some potential upside to already strong earnings estimates.
For example, Micron’s TTM gross and operating margins, below, have rapidly recovered from 2023’s trough and already pushed past prior cyclical peaks (2010/2015), at 45.6% and 33% respectively as of fiscal Q1 (ending Aug). On a quarterly view, Micron’s FQ1 margins were 56% and 45% respectively, up 11.3 and 12.7 points QoQ. For comparison, SK Hynix reported operating margin at nearly 47% in Q3, up more than five points QoQ.
Compare this to the 2018 cycle, where DRAM prices tripled over the course of six to eight quarters. Micron’s gross and operating margins peaked at 60% and 50% respectively, and Q2 was guided to far surpass that at 67% and 58.7%, respectively. Again for comparison, SK Hynix’s operating margin peaked at 57% on a quarterly basis in Q3 2018, more than ten points higher than current margins.
Potential earnings power is where this boom gets interesting, especially for Micron, given the wide range for revenue estimates and the rapid ascent in margins to above >65%/>55%. Considering Micron’s management explained that they “would expect gross margins to expand beyond fiscal Q2” though at a more gradual pace than the last few quarters, it is reasonable to assume upside towards 70-72% and potentially 61-63% on operating margin, assuming similar fall-through. Supporting this would be evidence of strong AI-driven product demand in HBM and LPDDR5X (non-existent factors in the prior 2018 cycle) and strong DRAM pricing.
Assuming Micron ramps into this margin profile of ~70%/61% by year-end and maintains that through fiscal 2027 (Aug ’27) on tight supply dynamics and demand growth, rough back-of napkin math would place FY27 GAAP EPS at $40.35, or ~7.6% above consensus for $37.50 (although it should be noted that this was $20.77 prior to earnings, or an ~80.5% raise now).
If FY27 revenue moves to the upper end of the estimated range, or ~$105.8 billion, driven by factors such as strong HBM demand from next-gen platforms and strong LPDDR5X content growth, earnings power could be even stronger. Assuming the same peak margin profile of 70/61/54%, FY27 GAAP EPS could reach $50, or ~33% higher than consensus, though such a scenario could be challenging to execute.
However, it would be remiss to cover memory without discussing the cyclicality of the industry and risks to the ‘supercycle’ narrative. Some of the main factors that could end this cycle include potential oversupply from capacity additions, or price reverting lower after its current L-shaped trajectory.
While 16Gb DDR4 and DDR5 prices have seen an “unprecedented spot price rally” to record levels, time and time again DRAM prices have always reverted lower, although cycle timing can differ. The swiftness of the current price rally has already outpaced 2018’s rise, though the duration of the price rally has not nearly been long enough to see when or where it could peak. The next-gen DDR6 is not expected to reach the mass market until 2027, suggesting there is ample runway for DDR5 pricing to remain strong through 2026.
A more hidden risk to the thesis emerges from consumer electronics. Although Micron has exited its consumer memory business and the focus for the trio of Micron, SK Hynix and Samsung remains squarely on AI, consumer electronics (smartphones and PCs) are still strong drivers of DRAM and NAND demand. For example, some analysts have placed consumer electronics at ~37% of DRAM and ~56% of NAND demand.
The surging DRAM prices are placing upwards pressure on bill-of-materials content for PCs and smartphones, with Lenovo, Dell, HP, Asus and others already hiking PC prices as a result, estimated at around 15-20%. These dynamics could lead to inventory buildup in consumer electronics markets, or potentially some degree of demand erosion, both major headwinds for pricing strength moving through 2026 and 2027.
While inventory rebuild and oversupply have previously ended past booms, manufacturers are aiming to preserve strong profitability and avoid flooding the market to keep this cycle intact. However, there can be no assurance that these fears will remain on the back burner come 2027.
Conclusion
While this may be a lot to unpack, the primary takeaway here is that the memory market is seeing strong, structural tailwinds from rising HBM and LPDDR5X content in GPUs and SSD use in AI applications. Some of the primary companies located at the heart of this trend include Micron, SK Hynix and Samsung as the primary HBM manufacturers; for enterprise SSDs, the market leaders include Micron, Samsung, SK, Kioxia and SanDisk.
To help narrow down on this trend, we plan to dive deeper into one of a leading Memory stock to our Discovery tier members the first week of January.
Subscribe to Discovery and get the Top 10 Emerging Tech Watchlist delivered monthly. Our incoming Top 10 list will be published January 2nd with many new names including a lesser-known memory stock. Current Pro and Advanced Members: To subscribe to Discovery with 30% off, click here to email us or email premium@io-fund.com and mention code DISCOVERY30
Please note: The I/O Fund conducts research and draws conclusions for the Fund’s positions. We then share that information with our readers. This is not a guarantee of a stock’s performance. Please consult your personal financial advisor before buying any stock in the companies mentioned in this analysis.
Below are our current positions and corresponding theses. In most cases, we have written about the stock many times. What is listed below are the most pertinent analysis for becoming acquainted with the stocks we currently hold. If you want to read more, please use our search bar by also ticking Pro in the filters and search by stock name to pull up more archived articles.
This list will be updated and refreshed when positions are added or removed. Please check back often for updates!
While the rest of the market spent this year debating AI bubbles, geopolitical fears, and supply chain bottlenecks, our team remained laser-focused on the signal within the noise. Rather than responding to headlines, we work hard to anticipate shifts to get in front of the market. For example, consider that we covered AI energy in our free newsletter 18 months before the market recognized it had become a bottleneck for AI systems. Behind our paywall, we do this on a monthly – if not weekly basis – by publishing information we feel confident is early and actionable.
As we close out a defining year for tech, we’re proud to share a few media moments where our theses met the mainstream. Below are some of our most impactful media appearances of the year, including in-depth conversations on Nvidia’s stock, the broader AI market, and—not to be missed—a few lesser-known AI stocks that anchors couldn’t help but ask about.
We are grateful that our readers trust us to cut through the noise – and we want to wish you a wonderful holiday season and a successful close to the 2025 trading year!
Beth Kindig’s $20 Trillion Nvidia Thesis: 25% Data Center Growth Silences AI Bubble Fears
I/O Fund’s CEO and Lead Tech Analyst, Beth Kindig, joined Charles Payne of Fox Business Network on his show ‘Making Money with Charles Payne’, after Nvidia’s stellar Q3 results. In the video below, Beth highlighted the company’s strong fundamentals and picture-perfect earnings report. She specifically pointed out the 25% sequential growth in the data center segment, the fastest QoQ growth in about two years. Beth boldly said, “The more people talk of the AI Bubble, I would counter that and say the bigger concern is the opportunity cost of not investing in AI.” Beth also defended her $20 trillion market cap forecast by 2030.
I/O Fund has a history of buying Nvidia at low prices. The first entry was $3.15 in December 2018. The I/O Fund discusses key technical levels in our weekly webinars for Advanced Market Signals Tier members. Subscribe to Advanced Tier to get real-time trade alerts for every entry and exit, portfolio access, and join weekly live webinars.
Nvidia’s Blackwell Ramp: Key to the $20 Trillion Thesis
In May, Beth made an bold call on Fox Business Network following Nvidia’s Q1 results—at a time when few dared to look past the headlines. She emphasized that Nvidia’s software revenue is on track to surpass hardware revenue within five years, that Blackwell's ramp is strong, and that Nvidia's long-term AI vision transcends China-related market noise. Since this interview, Nvidia shares are up 30% – not an easy call considering the company was already worth $3.4 trillion and competing with Microsoft as the world’s most valuable company.
Best AI Stocks for Q4 2025: Beth Kindig’s Top Picks
In Q4, Beth released her Top 15 AI Stocks report that totaled 43 pages and 15,000 words. Charles Payne interviewed Beth to discuss three of the top 15 stocks. To access the full report, subscribe here.
Join Discovery and get 2 stock ideas and technical setups every month plus the Top 10 Emerging Tech Watchlist.Join Discovery and get 2 stock ideas and technical setups every month plus the Top 10 Emerging Tech Watchlist.
The Power of Precision: Beth Kindig’s AI pick outpaces Meta
Beth Kindig joined David Ingles and Yvonne Man on Bloomberg: The China Show in July. Beth shared her expertise on Tesla’s Q2 performance, Alphabet’s AI spending, and the Best AI stocks. By favoring Astera Labs over industry giants like Meta, Beth achieved a stellar 43% outperformance in this short period. With Astera Labs surging 35% and Meta retracing 8%, Beth continues to prove why she is the leading voice in tech investment.
From Hopper to Blackwell: Why Beth Kindig’s Nvidia Q3 Call Was a ‘Bingo’ for Investors
Beth Kindig made a bold call after the GTC 2025 event in March this year and said, “It is a perfect time for the naysayers to lose faith because we are moving from one generation to the next. That’s from Hopper to Blackwell…keep an eye on Q3, it is going to be phenomenal.”
The stock is up 60% since this conversation, despite the $2.90 trillion market cap during that time and Nvidia’s Q3 was the strongest report in nearly two years (bingo!)
Nvidia Blackwell Ramp & $50B Data Center Forecast: Beth Kindig on Bloomberg
In August, Beth Kindig shared her outlook on Nvidia’s growth with Caroline Hyde on Bloomberg Technology, emphasizing the strong ramp of the Blackwell platform. She noted that her forecast set a year ago that data center quarterly revenue would surpass $50 billion by year-end fiscal 2026 was likely conservative. Later, Nvidia achieved the milestone a full quarter early, exceeding $50 billion in data center revenue in Q3.
AI Infrastructure & Power Demand: Why Energy Stocks Are Essential for AI Portfolios
Beth Kindig joined Charles Payne on Fox Business Network in July to break down the evolving AI landscape and why energy stocks are becoming a critical piece of AI-driven portfolios. In this interview, Beth explains how power demands from AI infrastructure are reshaping the market — and why investors should consider exposure to top-performing energy names alongside tech leaders.
The Rarest S&P 500 Pattern Since 1998: Cycles Point to a Big Move Ahead
In the below video, I/O Fund’s Co-Portfolio Manager, Knox Ridley, breaks down why the current S&P 500 rally is one of the rarest in over 25 years. Using Fibonacci retracements, cycle analysis, and long-term Elliott Wave patterns, he examines how the market has rallied for eight straight months without even a 23.6% pullback — a behavior only seen once since the 1920s, during the 1998–1999 melt-up.
Bitcoin Price Prediction 2025: Elliot Wave & RSI Signals Pointed to a Cycle Top
The I/O Fund's Co-Portfolio Manager, Knox Ridley, perfectly highlighted that the Bitcoin price was entering the final fifth wave after a multi-year bull run — and technical signals are flashing a warning that a potential top is near during his weekly webinar in October to our Advanced Market Signals Tier members. Knox breaks down Bitcoin’s Elliott Wave structure, key RSI signals, and how the DXY (U.S. Dollar Index) could determine what happens next.
Subscribe to Advanced Market Signals Tier to get real-time trade alerts, portfolio access and weekly live webinars.Advanced Market Signals Tier to get real-time trade alerts, portfolio access and weekly live webinars.
Please note: The I/O Fund conducts research and draws conclusions for the Fund’s positions. We then share that information with our readers. This is not a guarantee of a stock’s performance. Please consult your personal financial advisor before buying any stock in the companies mentioned in this analysis.
The trend toward neoclouds is a high risk/high reward opportunity for investors. Nebius is similar to CoreWeave, dubbing itself as AI native cloud infrastructure, which means the infrastructure was created specifically for AI workloads with architectures built on bare metal servers instead of hypervisor layers, for example, creating an important differentiation from the Big 3 which we’ve previously covered here and here.
Nebius offers an Nvidia-optimized cloud platform for teams that need to adjust compute resources, want high-performance storage and an easy-to-use AI environment yet do not want to manage the infrastructure or AI operations.
Nebius shares surged in September following the up to $19.4 billion deal with Microsoft. Recently, the company expanded its hyperscaler customer list recently with a $3 billion deal with Meta expected to ramp over the next three months. Backed by these two deals ramping through 2026, Nebius now projects reaching $7 billion to $9 billion in annualized run rate revenue (ARR) by the end of next year, up more than 13X from its current ARR of $551 million from Q3.
However, Nebius is a high-risk stock given its success depends on how much capital the company can raise, and the current financials do not support an easy path to ramping capacity and reaching these targets. Capex needs have already moved much higher, and meeting management’s more aggressive capacity targets for the end of 2026 will require significant capital to deploy the necessary GPUs – there is a chance for capex needs to remain at 7-8X of revenue in 2026, making financing a major challenge.
Regardless of how Nebius executes relative to CoreWeave, it remains an AI bubble stock as the company has to hope the stock price goes up to raise cash, which will dilute shareholders (or raise debt). It’s a vicious cycle as during any months/quarters that AI stocks are soft, Nebius stock will carry outsized execution risk.
Revenue Growth Decelerates in Q3, but Expected to Reaccelerate
Revenue decelerated to 355% YoY and 39% QoQ in Q3 to $146.1 million in Q3, down from 605% YoY and 90% QoQ in Q2. Core AI Infrastructure was the primary driver as revenue grew 400% YoY and 40% QoQ to ~$131.5 million, or ~90% of total revenue in Q3.
On that note, Nebius tightened its 2025 revenue outlook, from $450-630 million down to $500-550 million, citing timing of capacity as the primary reason. This is also below current estimates for 372% growth to $555 million.
On the other hand, revenue growth is expected to reaccelerate to 549% to $246.1 million in Q4 and further to 749% to $469 million by Q1, with more capacity coming online next quarter to support the Microsoft deal ramping through 2026 and its new $3 billion, five-year deal with Meta, with capacity rolling out over the next three months.
For fiscal 2026, revenue is expected to reaccelerate to 521% to $3.45 billion, with estimates having doubled since Nebius signed the Microsoft deal in September. Nebius said this quarter that it plans to provide full-year guidance for 2026 in the upcoming quarter.
However, reaching these targets will likely require strong/perfect execution as the company must build and deliver substantial capacity for both the Microsoft and Meta deal, as well as additional capacity to meet external demand. Doing so will likely require capex at >7X of revenue next year, an incredibly challenging position to be in as peers are spending far less yet still struggling to find funding.
Ambitious $7-9B ARR Target by End of 2026, up >7X YoY
Nebius provided an ambitious new medium-term annualized run rate revenue (ARR) target in Q3, forecasting reaching $7 billion to $9 billion in ARR by the end of 2026. For comparison, this would represent >7X YoY growth from 2025’s target of $1 billion at midpoint if it materializes.
Nebius’ two hyperscaler deals with Microsoft and Meta would account for more than half of this at ~$4.1 billion in ARR at full scale combined (approx. $3.5B for Microsoft and $0.6B for Meta). However, this would require Nebius to generate ~$3.9 billion in ARR at midpoint from other customers and other capacity, a challenging task given how costly its capacity expansion plans will be.
Additionally, the QoQ decline in incremental ARR, from $181 million in Q2 to ~$121 million in Q3, highlights a major challenge – this growth boils down to timing, and when Nebius can bring capacity online. This could be power bottlenecks, GPU supply bottlenecks, delays in building out physical infrastructure, funding bottlenecks, etc.
Thus, if the company cannot raise enough capital to afford its ambitious plan of reaching 2.5GW of contracted power and 0.8-1.0GW of connected power by the end of next year, these revenue targets may be unattainable.
Capex Forecast Raised by 2.5X to $5 Billion, 9X of Revenue
Capex requirements will be the number one focal point for Nebius considering it does not have the same depth of cash as hyperscalers, yet is competing with them on securing power, GPUs, and AI workloads.
On this note, Nebius is projected to spend ~9X its estimated 2025 revenue on capex after boosting its 2025 capex forecast by 2.5X to $5 billion, versus its prior view for $2 billion. This capex-revenue ratio is far above what peers such as CoreWeave and even Oracle are spending, at 2.5X and 0.75X. It’s also important to note that the latter two are struggling to in the financing department – CoreWeave is having to take on debt at >9% interest rates, while Oracle’s 520% debt-to-equity ratio has pushed its credit default swaps up to the highest level since 2009.
Financing this capex will be the primary challenge, and it is critical considering the bulk of this capex will go to revenue-generating GPUs. To put this in perspective for 2025 and 2026, here’s what CEO Arkady Volozh explained about capex and Nebius’ connected power targets:
And if we look at it from the CapEx point of view, roughly speaking, it breaks into 3 spending blocks. So first stage, securing land and power. It's pretty cheap. It's around — again, it depends on the scale, but it's around 1% of total CapEx for securing those blocks and electricity. The second stage, building the data centers, building connected power is something around, I don't know, 18%, 20%. And the remaining 80%, the main part is for deploying the actual GPUs. This is the main part of CapEx. So if we want to build as much as our capital will allow us, what should we do?1% of total CapEx for securing those blocks and electricity. The second stage, building the data centers, building connected power is something around, I don't know, 18%, 20%. And the remaining 80%, the main part is for deploying the actual GPUs. This is the main part of CapEx. So if we want to build as much as our capital will allow us, what should we do?
First, we should secure as much capacity as we can because the cost [is] immaterial at this scale. Second, we should build as much as our capital allows us. And third, we will fill GPUs in line with contracted or clearly visible demand. We will need this massive 80% spend [that] will come only when we see real demand. That's why we say that in 2026, we will be securing 2.5 gigawatts total contracted capacity. And we are planning to physically build 800 to 1 gigawatt of connected data centers. This will be done by the end of next year.”
For the updated 2025 capex guide, this would assume ~$50 million towards land, and ~$1 billion towards the physical data center shell and necessary equipment to connect power, and the remaining $4 billion for GPUs. This aligns with management’s forecast to have 220MW of connected power (not yet active) and 100MW of active power by year-end. This would be around ~$10 million per MW of active power based on the comments above, slightly below averages around $12 to 14 million.
Looking ahead to 2026, Nebius is planning to have 2.5GW of contracted power and 0.8-1.0GW of connected power (up 2.5X from a prior view for 1GW contracted). Per management, this includes scaling its existing data centers in the UK, US, and Israel, new data centers under development in the US and Europe, and several large sites with up to hundreds of MW under review, with the chance that some go online by the end of 2026.
Building out this capacity pipeline to reach the connected power targets with powered shells would likely require approximately $3 to $4 billion in capex, while GPUs would likely require $20 billion to $24 billion, potentially higher, depending on mix and how much of that connected power Nebius aims to have active. This is anchored by GPU costs for next-gen hardware now running at $25 billion to $30 billion per GW.
Financing Potential >4X Capex Growth, Still 7-8X of Revenue
There is a likelihood that Nebius’ capex needs for 2026 rise at a multiple of >4X YoY to meet these aggressive capacity expansion targets. This would also be ~7-8X current estimated revenue of $3.45 billion, meaning the company will be unable to break free of this extremely elevated capex cycle next year.
Compare this to Nebius’ balance sheet, which currently show $4.79 billion in cash on hand and $4.1 billion in debt following the company’s recent combined debt and equity offering raising $4.2 billion. This is not likely not even 20% of what the company could need to reach its capacity targets, and thus its revenue targets.
CFO Dado Alonso covered the financing aspect, though it is unlikely that these financing avenues could raise the necessary amount needed for these capacity targets without significantly stressing the company’s balance sheet:
“In order to support our aggressive growth plans in 2026 and to maintain this pace of growth in 2027, we will be utilizing at least 3 sources: corporate debt, asset-backed financing and equity. We are in the process of raising asset-backed debt, which we'll be able to secure with attractive terms supported by creditworthiness of our largest customers. Tomorrow, November 12, we will be putting in place an at-the-market equity program for up to 25 million Class A shares and plan to file a prospectus supplement. We will evaluate the program regularly based on our capital needs. The program enables us to access equity funding on an efficient ongoing basis. However, we will remain dilution sensitive as we prepare to finance future growth opportunities.”
Alonso’s comments suggest that the current cash on the balance sheet likely will go towards other data center opportunities outside of its hyperscaler deals, with the asset-backed debt more likely to fund the Microsoft and/or Meta buildouts in similar fashion to some Bitcoin miners raising substantial cash via asset-secured debt.
The at-the-market program could provide around $2.25 to $2.5 billion in capital around current share prices, if exercised in full between $90 to $100/share, while leading to approximately 10% dilution. Considering management’s goal of remaining dilution sensitive, the ATM program may be utilized at higher share prices to raise more capital, or as a second source behind debt. Again, raising only a few billion via 10% dilution to shareholders is still far from enough from meeting estimated capex needs next year.
While Nebius remains in a better position than CoreWeave at the moment in terms of debt-to-equity, at 0.94x versus 4.85x, there is a very high likelihood that this ratio will move rapidly in CoreWeave’s direction through 2026 given the capital intensity of building this capacity at an accelerated pace. There is also the potentiality for Nebius to be unable to raise $20B+ in capex given that it is approximately equivalent to the company’s current valuation and still 7-8X of revenue.
Why Nebius Must Spend Aggressively – Capacity is Sold Out
The reason that this capex growth is necessary, at least from management’s point of view, is because demand continues to far outstrip the capacity that Nebius can offer. Put another way – it is a spend or get left behind market.
Management emphasized numerous times in Q3’s call that capacity is the main bottleneck to revenue growth, and their current main focus is adding capacity to remove this bottleneck. CEO Arkady Volozh explained that demand was very strong in Q3 with Nebius selling out of all available capacity, and each time capacity was brought online, it was sold. Nebius is currently “selling the remnants of Q4, but [also] now preselling new capacity being delivered in future quarters” in 2026, helping lock in future revenue growth. This would also include the company’s trance of GB300s coming online in Finland in Q4.
One of the more important comments this quarter related to the demand pipeline. Management stated that pipeline generation, or customers wanting to buy capacity, expanded 70% QoQ to $4 billion in Q3, yet they “were only able to convert a portion of that given to the constraints of our capacity.” For context, core AI infrastructure revenue was approximately $131 million in Q3, so the pipeline would be ~30X its current run rate. It makes sense why Nebius is aiming to aggressively grow capacity given it witnessed well over $1.5 billion in sequential growth in the pipeline, as meeting a larger portion of this pipeline via more capacity would quickly translate to revenue growth.
To that point, management said that lead times from power connection and start of GPU deployments to revenue generation range “anywhere from 6 to 12 weeks” or potentially faster in existing facilities, again underscoring why they are willing to pursue this rapid capacity growth through 2026 as they can quickly shift to revenue generation from power connection.
However, this has highlighted a major downside to a capacity-constrained model. Nebius stated that it is “learning to say no to customers as we routinely sell out and have to actually let them down lightly and try to convince them to purchase in the future,” but there is an equal chance that these customers will simply go to CoreWeave or a hyperscaler who has capacity, get locked in to that ecosystem and not return to Nebius.
It also sheds light on the puts and takes of Nebius’ deployment strategy at this small scale. By prioritizing hyperscaler deals with Microsoft and now Meta (though this was ultimately constrained by capacity), Nebius is locking in strong future revenue streams over the next few years, but turning away these smaller startup customers by also locking up a larger portion of its near term capacity to the hyperscalers.
“In the longer term, Nebius believes that its vertical integration with a full stack of AI services will help broaden its customer base, increase platform stickiness and capture higher margin revenue and services. Nebius offers a proprietary cloud platform with managed MLops services, low downtime and high cost efficiency, combined with its inferencing platform AI Studio. With AI Studio, Nebius says it can offer up to 3x token savings with low latency, and up to 4.5x faster time to token versus other competitors in Europe.”offer up to 3x token savings with low latency, and up to 4.5x faster time to token versus other competitors in Europe.”
As such, the company is prioritizing building out its core AI cloud platform and continuously adding new features, with the predominant goal currently being geared towards enterprise adoption. Two main features from Q3 include Nebius’ new enterprise-ready cloud platform, dubbed Aether, as well as Nebius Token Factory.
With Aether, Nebius brings enterprise-grade security and compliance features along with a comprehensive observability suite, developer tools and more, in an effort to make its platform more attractive and accessible for large enterprise customers. Nebius also is focusing on improving reliability of its network with active health checks to reduce maintenance tasks, and boosting performance and storage speeds.
Token Factory builds on Nebius’ AI Studio and embeds enterprise-grade security in a production-scale inference platform, letting customers run open-source AI models from OpenAI, Alibaba, Meta, DeepSeek and others with 99.9% uptime, per the company. Management says Token Factory will help customers “transform open source models into optimized production-ready systems with guaranteed performance and transparent cost per token” and the “best total cost of ownership.” While it is too early to see how Token Factory contributes to monetization, Nebius’ dedication to improve its platform and expand its suite of offerings can serve as a strong differentiation and potentially aid in customer acquisition over rival platforms.
Financials
Revenue to Reaccelerate
Following the deceleration in Q3, Nebius tightened its 2025 revenue outlook, from $450-630 million down to $500-550 million, citing timing of capacity as the primary reason. This is also below current estimates for 372% growth to $555 million.
For fiscal 2026, however, revenue is expected to reaccelerate to 521% to $3.45 billion, with estimates having doubled since Nebius signed the Microsoft deal in September. Nebius said this quarter that it plans to provide full-year guidance for 2026 in the upcoming quarter.
Margins Improving, but Widely Negative
Gross margin was 70.6%, down slightly from 71.3% in the prior quarter and up from 69.2% in the year ago quarter.
Operating margin began to show signs of improvement, coming in at (89.1%), compared to (105.8%) in the prior quarter and (251.1%) in the prior year. At this rate, Nebius could break even in five quarters assuming it can maintain such improvements consistently, though this may be challenging as capacity ramps up rapidly.
Net margin was (81.9%), not comparable to the prior quarter’s 556% on Toloka’s deconsolidation but up from (293.5%) in the year ago quarter. Adjusted net margin was (68.7%), improving from (123.7%) in the year ago quarter. However, it is important to note that net losses has widened (from ($39.7 million) to ($100.4 million) for adjusted net loss) though margins are showing improvement from the rapid revenue ramp.
Adjusted EBITDA improved to just ($5.2 million) or a (4%) margin, up from a (20%) margin last quarter. Nebius noted that its Core AI Infrastructure business continued to generate positive adjusted EBITDA at a nearly 19% margin in Q3, with the metric weighed down by Avride and TripleTen investments.
Nebius lags CoreWeave by a significant degree for adjusted EBITDA, with CoreWeave posting a 61% adjusted EBITDA margin in Q3, down 4 points YoY. This suggests that there is room for substantial expansion over the upcoming quarters as the business scales to a much larger size.
Earnings Remain Far From Profitability
Nebius reported a 23% beat on adjusted EPS in Q3, though the company remains far from profitability and is not expected to reach profitability for quite some time.
Q3 adjusted EPS was ($0.40), beating estimates for ($0.52) but widening slightly from ($0.38) in the prior quarter. Looking ahead to Q4, adjusted EPS is expected to be ($0.58), before widening to ($0.74) in Q1.
For fiscal 2025, adjusted EPS is projected to be ($1.73) before widening to ($2.29) in 2026, likely driven by increasing expenditures to quickly ramp capacity.
Cash Needs Increasing
The challenge for Nebius is very similar to that of CoreWeave, with the neocloud spending significantly on GPUs and raising substantial debt to fund said spending. As a reminder, Nebius spent nearly $1 billion in capex in Q3, up from $510 million in Q2 and representing more than 6X its revenue. Capex is on pace to be >9X of revenue this year and potentially remain at 7-8X of revenue next year.
Operating cash flow was ($80.6 million) for a (55.2%) margin, while free cash flow was ($1.04 billion) for a (709.1%) margin. This widened from free cash flow of ($678.3 million) in the prior quarter as capex surged more than 87% QoQ to $955.5 million.
Cash and equivalents totaled $4.8 billion, while debt was $4.1 billion. As mentioned previously, surging capex this year and the potential for tens of billions next year means Nebius will likely turn to debt markets for significant funding. Debt to equity sat at 0.94X in Q3, though this is likely to worsen significantly moving through 2026 based on estimated capex needs north of $20 billion.
Valuation
Nebius trades at 37x forward PS ratio, slightly above its average of 32x, though data is limited considering its recent launch on the public markets post-Yandex breakup. Shares have traded as low as 8.6x forward PS and as high as 61.5x.
Rapid revenue growth in 2026 is expected to bring forward PS down to 5.9x next year, though this remains a premium to CoreWeave at 3.0x next year’s revenue estimate of $12.07 billion.
Conclusion
Nebius is on a trajectory of high growth-high debt for the foreseeable future, with the company spending nearly $1 billion this quarter on capex alone, in preparation for capacity ramps for Meta and Microsoft occurring in quick succession.
On one hand, revenue growth is expected to accelerate sharply to 750% over the next two quarters and maintain a hypergrowth profile with >380% growth for the next five quarters, while YoY growth is expected to accelerate 148 points to 521% in 2026. However, capex guidance for 2025 was raised to ~9X of revenue, and aggressive capacity expansion targets for 2026 mean capex will likely remain 7-8X of revenue, far above peers and making finding financing a significant challenge.
Ultimately, even if high-beta stocks catch a bid, there are far cleaner and less capital-intensive ways to gain exposure to the AI buildout. Until Nebius can demonstrate that its growth is not being funded by an expanding cash shortfall, we see limited risk-reward and will remain on the sidelines.
Damien Robbins, Equity Analyst at I/O Fund contributed to this analysis.
Please note: The I/O Fund conducts research and draws conclusions for the Fund’s positions. We then share that information with our readers. This is not a guarantee of a stock’s performance. Please consult your personal financial advisor before buying any stock in the companies mentioned in this analysis.
While many investors are wondering whether the AI trend is entering dot-com territory, I believe AI’s most powerful move has not even begun.
In a series of analyses on the incoming AI monetization wave, the I/O Fund has laid out a data-driven case that AI is on the cusp of monetizing; a sharp rebuttal to those who believe AI is topping. Earlier this month, my firm connected the dots on Nvidia’s earnings report, the strongest in nearly two years, and highlighted why Broadcom’s commentary is quietly signaling that the best is yet to come.
In this analysis, however, I turn to what may be the most important clue of all: Meta.
Meta’s stock sits at the center of the AI spending debate, as Big Tech continues to shock markets with outsized AI-driven capital expenditures. What is being overlooked is that Meta’s stock is already reporting a long-awaited return on investment from the AI data center buildout.
Below, I highlight several key metrics from Meta’s latest earnings report that illustrate the company is beginning to offer measurable returns on its AI investments. When viewed alongside our prior analysis on Nvidia and Broadcom, this discussion broadens the perspective to include one of the most closely scrutinized AI stocks in terms of capital expenditure. Although AI remains in a nascent stage, the data presented below provides early evidence that elevated AI capex is starting to translate into a clearer path toward monetization.
Meta Advantage+ Reaches $60 Billion ARR, Outpacing OpenAI by 3X
In the analysis “Nvidia Stock and the AI Monetization Supercycle Nobody is Pricing In” I encouraged investors to look at the evidence the AI Monetization Supercycle is already offering tangible results. For example, we can look at OpenAI’s trajectory from $1 billion in revenue in 2023 to an estimated $20 billion annualized revenue today – which represents the steepest rise in technology history. This was driven almost entirely by inference (API calls and ChatGPT usage). The CEO has stated OpenAI will reach hundreds of billions in annualized revenue by the end of the decade – although this requires ample execution, it’s a hint as to the sheer force of the incoming monetization wave.
What may surprise you is that Meta’s Advantage+ is outpacing OpenAI by 3X and is also offering the strongest AI revenue among the FAAMGs. Unless you track earnings reports as closely as my firm, the information from this past quarter could have easily flown under radar as Meta’s management team offered an update on Advantage+ that nobody was expecting:
“This quarter, we saw meaningful advances from unifying different models into simpler, more general models, which drive both better performance and efficiency. And now the annual run rate going through our completely end-to-end AI-powered ad tools has passed $60 billion.”
The $60 billion run rate was achieved within 3.5 years, which is on par with when OpenAI began to monetize in 2023 through year-end 2025. The last update we got from Meta's management on AI powered ads was in March of 2025 with a stated $20 billion annual run rate – which means AI ads have grown 3X in 7 months' time.
mid
Perhaps an even bigger shocker is that Meta may be ahead of Microsoft for AI revenue. The last update we got from Microsoft is from Fiscal Q2 ending in January, where AI revenue was stated to be $13 billion, growing at a pace of 175% year-over-year.
“This quarter we saw continued strength in Microsoft Cloud, which surpassed $40 billion in revenue for the first time, up 21% year-over-year. Enterprises are beginning to move from proof-of-concepts to enterprise-wide deployments to unlock the full ROI of AI. And our AI business has now surpassed an annual revenue run rate of $13 billion up 175% year-over-year.”
The base case for Microsoft assumes AI contributing approximately 22 points to growth as of fiscal Q1, or around 56% of its YoY growth in dollars. This could imply AI revenue at 26% of Azure’s total revenue, or around $25 to $26 billion on a nearly $100 billion annual run rate for Azure.
Chart illustrating Microsoft’s base case of AI revenue accounting for about 26% of Microsoft Azure revenue. It assumes AI is driving significant Azure growth.
Overall, it would require a step-up from 175% growth YoY to 460% year-over-year for Microsoft to match Meta’s AI revenue – an aggressive growth rate that I believe Microsoft would have already discussed with investors. Therefore, I believe probabilities favor Meta being in the lead on AI revenue, as it stands today. That means Meta would be in second place – second only to Nvidia – on AI revenue.
Meta’s Advantage+ results are one of the clearest real-time signals that the AI monetization wave is already underway, not theoretical.
Subscribe to our free AI & tech newsletter for weekly research and charts on AI monetization across leaders like META, NVDA, and MSFT. Click here.Subscribe to our free AI & tech newsletter for weekly research and charts on AI monetization across leaders like META, NVDA, and MSFT. Click here.
How Meta AI Advantage+ Generates $4.52 ROI Per Dollar
Advantage+ automates campaign targeting, budget allocation, and creative generation, providing advertisers with an easy-to-use tool that integrates generative AI directly into Meta’s ad ecosystem. Advantage+ is powered by Andromeda, which is an internally developed AI system that optimizes ad ranking, recommendation quality and content delivery by leveraging machine learning models more efficiently. By improving how models are executed, Andromeda allows Meta to extract more performance per unit of compute, which is key as the AI powered ads platform seeks high-volume inference.
Meta revealed earlier this year that “for every dollar spent on its AI-enabled Advantage+ products, advertisers generate on average $4.52 in revenue for their businesses,” or an increase of ~22% versus typical campaigns, highlighting how ad performance improves while using the AI-powered platform.
In Q3, Meta emphasized that “Advantage+ continues to drive performance gains, [and] advertisers who run lead campaigns using Advantage+ are seeing a 14% lower cost per lead on average than those who are not.” This compares to a 10% lower cost per lead as of April, showing that the platform continues to drive results while lowering costs per lead.
Meta Stock: $10B Growth Proves AI Advertising Acceleration
There is additional evidence that Meta is seeing tailwinds from AI recommendation models, which in turn drive higher ROI for advertisers and increase time spent across its family of apps.
In Q3, advertising revenue grew 25.6% YoY, accelerating more than nine points since Q1 and marking the fastest growth in six quarters. Ad impressions rose 14% YoY in Q3, accelerating from 11% in Q2 and marking a strong inflection from just 5% growth in Q1. Pricing remained steady, rising just one point to 10% YoY.
Meta Stock Ad Impressions: AI drives 3-point acceleration to 14% YoY in Q3.
However, the dollar growth in advertising stands out more — Meta has delivered its two largest YoY growth quarters on a dollar basis in Q2 and Q3, at $8.23 billion and $10.2 billion, even outperforming Q4 2024’s holiday-boosted growth of $8.08 billion. This high dollar growth is poised to continue in Q4 2025, with guidance pointing to ~$9.3 billion to $10.7 billion in QoQ dollar growth.
Meta ad revenue accelerated to 25.6% YoY growth in Q3, up from 21.5% in Q2, highlighting the success of AI recommendation models.
Put another way, Meta is delivering larger YoY dollar growth in advertising revenue on a larger base – Q3 2025 grew $10 billion YoY off a $40 billion base, versus $7.5 billion growth in Q3 2024 on a $33.6 billion base.
AI Drives Record ARPP Continues to Accelerate Heading into Q4
Perhaps the most important metric for Meta’s ads monetization is ARPP (average revenue per person), with the metric continuing to accelerate in Q3 ahead of the seasonally stronger holiday quarter. ARPP reached $14.46 in Q3, accelerating to 17.7% YoY from 14.8% in Q2. More impressively, this marked a record high for ARPP, surpassing Q4 2024’s seasonally stronger ARPP of $14.25.
Meta ARPP: AI-driven efforts push to a record $14.46 in Q3.
This sets the stage for ARPP to push well beyond $15, potentially to $16 in the upcoming quarter, highlighting that Meta’s AI-driven ad performance improvements and monetization efforts are bearing fruit.
Annual Revenue Revisions Seeing Sharp Increase Since July
What’s notable about the revenue front is the sharp upward revisions to annual revenue estimates, with 2026 and 2027 moving sharply higher since this summer.
Back in July, prior to Q2’s earnings, Meta was expected to generate $215.1 billion in revenue, with that now sitting at $235.1 billion. On a YoY basis, growth has been revised from 14.0% to 17.9%. A smaller uplift considering 2025 comps have toughened, having risen from 14.7% to 21.3% over the same period.
For 2027, Meta was expected to generate $240.6 billion in late July, with that now sitting at $271.7 billion, with YoY growth moving from 11.9% to 15.6% on a higher base.
Chart showing the increase in Meta’s forward revenue estimates.
Meta Ad Performance: Leveraging GEM, Lattice, and Andromeda AI Models
Meta outlined two monetization levers in Q3 – improving ad performance, and an ability to continue delivering engaging content to users.
This first monetization lever stems from improving ad performance for its advertisers, mostly driven by the company’s three foundational models as well as its end-to-end ads automation platform Advantage+. Meta opts for tracking conversions to gauge ad performance, despite it being a complex metric to track considering advertisers can optimize for different types of conversions. CFO Susan Li stated that value-weighted conversion rates showed “very strong” YoY growth in Q3, outpacing impressions.
Meta’s three foundational models all serve a different function, with the same end goal of improving ad quality and conversions to drive higher ROI for advertisers:
GEM (Generative Ads Recommendation Model) is described by Meta as the ‘super brain’ that can rapidly process, catalog and analyze trillions of data points, to then recognize subtle patterns in user activity to provide the most relevant ads at the right time. Meta says GEM was rolled out more broadly earlier this year after initial testing on Reels saw GEM boost conversions by up to ~5%. GEM delivered a 5% increase in conversions on Instagram and a 3% increase on Facebook in Q2, and in Q3 Meta “doubled the performance benefit we get from adding a given amount of data and compute” to continue scaling training capacity at an attractive ROI.
Lattice is described as a ‘giant library’ that generalizes learnings across different campaign objectives (clicks, views, etc), surfaces (Reels, Story, Feed, etc) and subjects, in order to predict an ad’s performance. Lattice increases ad efficiency as it runs fewer models, while the knowledge-sharing effect increases ad quality and conversions – Meta said earlier this year that Lattice has increased ad quality by 12% and conversions by 6%. In Q3, Meta rolled out Lattice to app ads, driving a ~3% gain in conversions on that objective.
Andromeda is described as a ‘personal concierge’, or Meta’s vast ML ad recommendation and prediction system that, at its core, aims to predict exactly which ads a user will find the most interesting. For Andromeda, Meta says, “Imagine having a personal concierge who knows your tastes so well that they don’t just understand that you covet shoes, but that you like to wear red flip flops at the beach.” Meta said that in Q3, it significantly improved Andromeda’s performance by combining retrieval and early-stage ranking models, driving a 14% increase in ad quality on Facebook. Andromeda is also the core engine powering Advantage+ automation tools.
Moving to 2026, Meta discussed that it is “working on combining these 3 major AI systems into a single unified AI system that will effectively run our family of apps and business using increasing intelligence to improve the trillions of recommendations that it will make for people every day.”
A single model that combines the strengths of GEM, Andromeda and Lattice could theoretically understand user preferences and activity at a much deeper level, improve ad ranking quality, relevance and conversions across its family of apps, and save on inference. For example, Meta does not use GEM for inference as its size makes it too cost-prohibitive, rather it transfers knowledge to smaller run-time models; a single model incorporating GEM’s knowledge could potentially run inference in a more cost-effective manner.
Meta AI Lever 2: Reels Reaches $50 Billion ARR Due to Increased Engagement
On the second monetization lever of increasing engagement, Meta is executing quite well, with improvements in its recommendation models helping drive time spent on its apps higher. More time spent then allows ad impressions to grow without substantially increasing ad load, underpinning this reacceleration in impressions growth seen in Q3 and more growth moving forward.
Management pointed out that “overall time spent on Facebook and Instagram grew double digits year-over-year, driven by continued video strength as well as healthy growth in nonvideo time on Facebook.” Video time spent on Instagram was more than 30% higher versus last year, while AI ranking optimizations helped drive 10% more time spent on Threads in Q3. This video growth has pushed Reels to a $50 billion annual run rate in Q3, up 5X from its last update in Q2 2023 when it reached a $10 billion run rate.
Improving ranking models remains a key focus for Meta moving through 2026, with management expecting new model innovations to help “significantly scale up the amount of data and compute we use to train our recommendation models in 2026, yielding more relevant recommendations.”
Meta’s Upcoming Capex Surge and Possible FCF Crunch
Some of the most important quotes from Q3’s call circled back to Meta’s view on capex and why it believes aggressive expansion of capacity and thus capex is a necessity. CEO Mark Zuckerberg believes it is the “right strategy to aggressively front-load building capacity so that way we're prepared for the most optimistic cases” on when AI superintelligence arrives, so Meta is prepared to capitalize on this opportunity.
If building superintelligence takes years longer than expected, Zuckerberg says Meta can “use the extra compute to accelerate our core business which continues to be able to profitably use much more compute than we've been able to throw at it. And we're seeing very high demand for additional compute, both internally and externally.
These comments underscore why Meta is aggressively raising its capex spending this year and next – Zuckerberg believes that the upside potential of superintelligence is so large that it is worth the risk of overbuilding to not fall behind OpenAI or Google (with compute capacity being the main advantage), with Meta able to use extra compute in the meantime to improve core AI ad capabilities and drive growth.
However, the tradeoff for this is lower free cash flow and potential operating margin headwinds. Meta expects capex dollar growth to be “notably larger in 2026 than 2025,” while total expenses “will grow at a significantly faster percentage rate in 2026” driven by infrastructure costs, incremental cloud costs and depreciation, followed by employee compensation.
This implies 2026 capex of at least $103 billion, as current guidance for 2025 at $70-72 billion implies a minimum of ~$32 billion YoY growth. However, considering management’s comments for notably larger dollar growth, there is potential for capex to come in at or above $110 billion, up ~55% YoY, above current estimates for $107.9 billion. Put another way, Meta could spend ~$30 billion more in 2025 and 2026 than it did in 2019 through 2024 combined.
Meta capex is projected at $107.9 billion in 2026 as it prepares to monetize the AI superintelligence opportunity.
The capex surge will potentially cause another free cash flow crunch similar to 2022, with current consensus estimates pointing to FCF of $19.71 billion in 2026, down nearly (50%) YoY and (63.5%) from 2024.
Meta’s AI-driven capex surge will potentially cause another free cash flow crunch in 2026. This mirrors the 2022 crunch when FCF fell to $19.04 billion from $39.12 billion in 2021.
How Meta’s Capex Compares to Other Big Tech Stocks
We recently discussed Big Tech Capex spending following Q3 earnings results in our article, Big Tech’s $405B Bet: Why AI Stocks Are Set Up for a Strong 2026. As seen in the chart below, Meta has the lowest cumulative capex for the years 2023 to 2025E of $138 billion. This figure is lower than that of other Big Tech Companies, such as Alphabet at $177 billion, Microsoft at $234 billion, and Amazon at $261 billion.
Meta has the lowest cumulative capex for the years 2023 to 2025E among the Big Tech Companies
Big Tech companies are now beginning to report their AI revenue in the quarterly earnings results, unlike AI semiconductor companies, which have consistently been providing this figure. During the June quarter, Microsoft revealed that Azure surpassed $75 billion in annual revenue. If we assume that AI revenue constitutes 26% of Azure revenue, Microsoft’s AI revenue would be a base case of $20 billion up to $26 billion if we assume the same growth rate as last year, well below the $60 billion for Meta. I do foresee a scenario where Microsoft is higher than the base case, yet it’s unlikely the growth rate is at the 450%+ growth rate required to pass Meta. Similarly, Alphabet and Amazon who spent far more than Meta are not revealing AI numbers, which theoretically means the numbers are lower than Meta's.
Meta’s Free Cash Flows hit by high Capex
Meta has strong operating cash flows. However, due to high capex to support AI investments, the company’s free cash flows were down (31.5%) YoY to $10.63 billion in Q3. Capex rose 110.5% YoY to $19.34 billion, driven by investments in servers, network infrastructure and data centers. Based on 2025’s capex guide, which was raised to $70-72 billion (up 81% YoY at midpoint), Q4 capex is on track to be ~$21 billion, up 41.5% YoY. Meta is expected to see a steep free cash flow crunch moving through 2026 as a result of surging capex and would be a risk item to keep an eye out for in the coming quarters.
Conclusion:
While much attention is given to Nvidia and AI semiconductors for visible AI-driven growth, we are beginning to see an impact in Big Tech’s software segments. Meta’s advertising revenue accelerated to the mid-20% range, and YoY dollar growth surpassed $10 billion in Q3. Revenue forecasts continue to strengthen over the next few years with revisions of up to $30 billion, or up 10-14% since July, underscoring the Street’s confidence in Meta’s ability to leverage AI to improve monetization.
More impressively, Meta’s AI ads automation platform has reached a $60 billion run rate in Q3 in three and a half years from its launch. This is 3X Broadcom’s AI revenue, 3X OpenAI ARR and could even put Meta as the #2 stock by AI revenue ahead of Microsoft. Notably, the I/O Fund is the first firm to point out Meta’s quiet dominance relative to Microsoft, as we consistently find an edge in earnings data that others have overlooked.
However, the thorn in Meta’s side stems from the compute and capex side, as the company is aggressively building data center capacity to prepare itself for the most optimistic scenario of reaching superintelligence. Not only is capex guided to surge to over $100 billion in 2026, potentially creating another cash flow crunch reminiscent of 2022’s metaverse-linked spending spree, but expense growth is also expected to outpace revenue growth by a wide degree and weigh heavily on operating margin.
This year, my firm has 15 positions beating the Nasdaq YTD, up from ten positions last year – helping to cement the I/O Fund as one of the world’s leading AI portfolios. Our cumulative return of 210% over a five-year period would rank us #2 if we were a hedge fund and #5 if we were an ETF – notably, this strong cumulative return does not yet include our 2025 performance.
Want our real-time trade alerts and full AI portfolio positioning, including a newly updated 3,800-word deep dive3,800-word deep dive on Meta’s near-term risks and potential entry points? Join our Advanced plan here.Join our Advanced plan here. Advanced members also receive weekly webinars and full access to our actively managed portfolio of lesser-known AI stocks.
Please note: The I/O Fund conducts research and draws conclusions for the Fund’s positions. We then share that information with our readers. This is not a guarantee of a stock’s performance. Please consult your personal financial advisor before buying any stock in the companies mentioned in this analysis.
While much attention is given to Nvidia and the AI semiconductor ecosystem for visible AI-driven hypergrowth trajectories, there is another quiet AI beneficiary emerging in Meta, with advertising revenue accelerating to the mid-20% range and YoY dollar growth surpassing $10 billion in Q3. Revenue forecasts continue to strengthen over the next few years with revisions of up to $30 billion, or up 10-14% since July, underscoring greater confidence in Meta’s ability to leverage AI to improve monetization.
More impressively, Meta’s AI ads automation platform has quietly reached a $60 billion run rate in Q3 in three and a half years from its launch. This is 3X Broadcom’s AI revenue and also 3X of OpenAI’s projected ARR of $20 billion for 2025, emphasizing how large of a platform Advantage+ is. Compared to Microsoft, AI contributed 16 points of growth in the April quarter, implying a run rate of around $16 billion assuming growth at a similar degree as the January quarter’s 175% YoY to $13 billion.
However, the thorn in Meta’s side stems from the compute and capex side, as the company is aggressively building data center capacity to prepare itself for the most optimistic scenarios of reaching superintelligence. Not only is capex guided to surge to over $100 billion in 2026, potentially creating another cash flow crunch reminiscent of 2022’s metaverse-linked spending spree, but expense growth is also expected to outpace revenue growth by a wide degree and weigh heavily on operating margin.
Advantage+ Reaches $60 Billion ARR
Meta’s flagship AI ads automation platform Advantage+, powered by Andromeda, is also key to the company’s strong ads performance, as Meta has been straightforward about the end-to-end platform driving strong return on ad spend for advertisers. Advantage+ automates campaign targeting, budget allocation, and creative generation, providing advertisers with an easy-to-use tool that integrates generative AI directly into Meta’s ad ecosystem.
Meta revealed earlier this year that “for every dollar spent on its AI-enabled Advantage+ products, advertisers generate on average $4.52 in revenue for their businesses,” or an increase of ~22% versus typical campaigns, highlighting how ad performance improves while using the platform.
In Q3, Meta emphasized that “Advantage+ continues to drive performance gains, [and] advertisers who run lead campaigns using Advantage+ are seeing a 14% lower cost per lead on average than those who are not.” This compares to a 10% lower cost per lead as of April, showing that the platform continues to drive results while lowering costs per lead.
More importantly, Meta disclosed that Advantage+ has surpassed a $60 billion annual run rate, just three and a half years after its launch. CFO Susan Li sees room to continue growing this run rate for Advantage+ and expanding adoption of the platform by focusing on driving continued performance improvements.
First Monetization Lever: Improving Ad Performance
Meta outlined two monetization levers in Q3 – improving ad performance, and an ability to continue delivering engaging content to users.
This first monetization lever stems from improving ad performance for its advertisers, mostly driven by the company’s three foundational models as well as its end-to-end ads automation platform Advantage+. Meta opts for tracking conversions to gauge ad performance, despite it being a complex metric to track considering advertisers can optimize for different types of conversions. CFO Susan Li stated that value-weighted conversion rates showed “very strong” YoY growth in Q3, outpacing impressions.
Meta’s three foundational models all serve a different function, with the same end goal of improving ad quality and conversions to drive higher ROI for advertisers:
GEM (Generative Ads Recommendation Model) is described by Meta as the ‘super brain’ that can rapidly process, catalog and analyze trillions of data points, to then recognize subtle patterns in user activity to provide the most relevant ads at the right time. Meta says GEM was rolled out more broadly earlier this year after initial testing on Reels saw GEM boost conversions by up to ~5%. GEM delivered a 5% increase in conversions on Instagram and a 3% increase on Facebook in Q2, and in Q3 Meta “doubled the performance benefit we get from adding a given amount of data and compute” to continue scaling training capacity at an attractive ROI.
Lattice is described as a ‘giant library’ that generalizes learnings across different campaign objectives (clicks, views, etc), surfaces (Reels, Story, Feed, etc) and subjects, in order to predict an ad’s performance. Lattice increases ad efficiency as it runs fewer models, while the knowledge-sharing effect increases ad quality and conversions – Meta said earlier this year that Lattice has increased ad quality by 12% and conversions by 6%. In Q3, Meta rolled out Lattice to app ads, driving a ~3% gain in conversions on that objective.
Andromeda is described as a ‘personal concierge’, or Meta’s vast ML ad recommendation and prediction system that, at its core, aims to predict exactly which ads a user will find the most interesting. For Andromeda, Meta says, “Imagine having a personal concierge who knows your tastes so well that they don’t just understand that you covet shoes, but that you like to wear red flip flops at the beach.” Meta said that in Q3, it significantly improved Andromeda’s performance by combining retrieval and early-stage ranking models, driving a 14% increase in ad quality on Facebook. Andromeda is also the core engine powering Advantage+ automation tools.
Moving to 2026, Meta discussed that it is “working on combining these 3 major AI systems into a single unified AI system that will effectively run our family of apps and business using increasing intelligence to improve the trillions of recommendations that it will make for people every day.”
A single model that combines the strengths of GEM, Andromeda and Lattice could theoretically understand user preferences and activity at a much deeper level, improve ad ranking quality, relevance and conversions across its family of apps, and save on inference. For example, Meta does not use GEM for inference as its size makes it too cost-prohibitive, rather it transfers knowledge to smaller run-time models; a single model incorporating GEM’s knowledge could potentially run inference in a more cost-effective manner.
Second Monetization Lever: Increasing User Engagement
On the second of increasing engagement, Meta is executing quite well, with improvements in its recommendation models helping drive time spent on its apps higher. More time spent then allows ad impressions to grow without substantially increasing ad load, underpinning this reacceleration in impressions growth seen in Q3 and more growth moving forward.
Management pointed out that “overall time spent on Facebook and Instagram grew double digits year-over-year, driven by continued video strength as well as healthy growth in nonvideo time on Facebook.” Video time spent on Instagram was more than 30% higher versus last year, while AI ranking optimizations helped drive 10% more time spent on Threads in Q3. This video growth has pushed Reels to a $50 billion annual run rate in Q3, up 5X from its last update in Q2 2023 when it reached a $10 billion run rate.
Improving ranking models remains a key focus for Meta moving through 2026, with management expecting new model innovations to help “significantly scale up the amount of data and compute we use to train our recommendation models in 2026, yielding more relevant recommendations.”
AI Aiding Meta’s Advertising Growth Flywheel
On a positive note, Meta is already seeing tailwinds from AI recommendation models driving higher ROI for advertisers and increasing time spent across its family of apps, fueling stronger advertising revenue growth.
In Q3, advertising revenue grew 25.6% YoY, accelerating more than nine points since Q1 and marking the fastest growth in six quarters. Ad impressions rose 14% YoY in Q3, accelerating from 11% in Q2 and marking a strong inflection from just 5% growth in Q1. Pricing remained steady, rising just one point to 10% YoY.
However, the dollar growth in advertising stands out more — Meta has delivered its two largest YoY growth quarters on a dollar basis in Q2 and Q3, at $8.23 billion and $10.2 billion, even outperforming Q4 2024’s holiday-boosted growth of $8.08 billion. This high dollar growth is poised to continue in Q4 2025, with guidance pointing to ~$9.3 billion to $10.7 billion in QoQ dollar growth.
Put another way, Meta is delivering larger YoY dollar growth in advertising revenue on a larger base – Q3 grew $10 billion YoY off a $40 billion base, versus $7.5 billion growth in Q3 2024 on a $33.6 billion base.
ARPP Continues to Accelerate Heading into Q4
Perhaps the most important metric for Meta’s ads monetization is ARPP (average revenue per person), with the metric continuing to accelerate in Q3 ahead of the seasonally-stronger holiday quarter. ARPP reached $14.46 in Q3, accelerating to 17.7% YoY from 14.8% in Q2. More impressively, this marked a record high for ARPP, surpassing Q4 2024’s seasonally stronger ARPP of $14.25.
This sets the stage for ARPP to push well beyond $15, potentially to $16 in the upcoming quarter, highlighting that Meta’s AI-driven ad performance improvements and monetization efforts are bearing fruit.
Meta’s Upcoming Capex Surge and Possible FCF Crunch
Some of the most important quotes from Q3’s call circled back to Meta’s view on capex and why it believes aggressive expansion of capacity and thus capex is a necessity. CEO Mark Zuckerberg believes it is the “right strategy to aggressively front-load building capacity so that way we're prepared for the most optimistic cases” on when AI superintelligence arrives, so Meta is prepared to capitalize on this opportunity.
If building superintelligence takes years longer than expected, Zuckerberg says Meta can “use the extra compute to accelerate our core business which continues to be able to profitably use much more compute than we've been able to throw at it. And we're seeing very high demand for additional compute, both internally and externally.
These comments underscore why Meta is aggressively raising its capex spending this year and next – Zuckerberg believes that the upside potential of superintelligence is so large that it is worth the risk of overbuilding to not fall behind OpenAI or Google (with compute capacity being the main advantage), with Meta able to use extra compute in the meantime to improve core AI ad capabilities and drive growth.
However, the tradeoff for this is lower free cash flow and potential operating margin headwinds. Meta expects capex dollar growth to be “notably larger in 2026 than 2025,” while total expenses “will grow at a significantly faster percentage rate in 2026” driven by infrastructure costs, incremental cloud costs and depreciation, followed by employee compensation.
This implies 2026 capex of at least $103 billion, as current guidance for 2025 at $70-72 billion implies a minimum of ~$32 billion YoY growth. However, considering management’s comments for notably larger dollar growth, there is potential for capex to come in at or above $110 billion, up ~55% YoY, above current estimates for $107.9 billion. Put another way, Meta could spend ~$30 billion more in 2025 and 2026 than it did in 2019 through 2024 combined.
The capex surge will potentially cause another free cash flow crunch similar to 2022, with current consensus estimates pointing to FCF of $19.71 billion in 2026, down nearly (50%) YoY and (63.5%) from 2024.
Expense Growth to Meaningfully Outpace Revenue Growth in 2026
Tying into capex is Meta’s expectation for expense growth to be significantly faster in 2026 versus 2025, which means expense growth will outpace revenue growth by a wide margin, potentially as much as a factor of 2x.
For perspective, Meta is forecasting total operating expenses of $116-118 billion this year, up 22-24% YoY, marginally outpacing estimated revenue growth of 21.3%. This is crucial heading into next year as a lack of meaningful gross margin expansion means this growth will directly pressure operating margin.
If expenses grow at ~30% YoY in 2026, this would project total expenses in the range of ~$151-153 billion, significantly outpacing expected revenue growth of 17.9% to $234.7 billion. This would also project out to an operating margin of ~35%, marking a relatively sharp contraction back to the lowest levels since early 2023.
If expenses grow faster, at say 2X estimated revenue growth or ~35% YoY, this would project expenses in the range of ~$157-159 billion. While only slightly higher than the ~30% growth forecast, this would bring operating margin down to 32.5%-33%.
JP Morgan’s Doug Anmuth questioned management about this capacity expansion strategy and how this spending ties to earnings and cash flow:
“I appreciate the strategy to front load capacity for superintelligence. Can you just talk about your thought process and kind of triangulating the Capex dollar growth and the significantly faster expense growth next year with core growth in the business and then the impact on earnings and free cash flow? And do you have targets that we should be thinking about for cash on hand or net cash overall?”
CFO Susan Li offered a lengthy discussion in response that offered no clarification on earnings or cash flow impacts, and hinted that Meta may not be worried about those two line items in this buildout:
“But to date, we keep on seeing this pattern where we build some amount of infrastructure to what we think is an aggressive assumption. And then we keep on having more demand to be able to use more compute, especially in the core business in ways that we think would be quite profitable than we end up having compute for.
So I think that, that suggests that being able to make a significantly larger investment here is very likely to be a profitable thing over some period… Now I mean, it's, of course, possible to overshoot that, right? … And then the kind of the very worst case would be that we effectively have just prebuilt for a couple of years, in which case, of course, there would be some loss and depreciation, but we'd grow into that and use it over time.”
On the point of Meta’s 2026 budget still being put into place, reports surfaced that Meta is considering making budget cuts of up to 30% in its metaverse division, Reality Labs, which is currently burning about ~$20 billion per year. This could save several billion if put into place, though there is potential for that money to simply be reallocated towards data center capex.
Financials
Revenue Growth Accelerates to 26%
Meta reported revenue of $51.24 billion in Q3, accelerating more than 4.5 points to 26.2% YoY, the highest growth since Q1 2024. This also marked an impressive reacceleration from 16% growth in Q1 2025.
For Q4, management guided to revenue between $56 to $59 billion, up 18.8% YoY at midpoint, driven by expectations for strong ad revenue growth, partially offset by lower YoY revenue in Reality Labs from lapping the Quest 3S introduction. For 2025, revenue is expected to grow 21.3% to $199.5 billion, before decelerating to 17.7% growth to $234.7 billion in 2026.
Annual Revenue Revisions Seeing Sharp Increase Since July
What’s notable on the revenue front is the sharp upward revisions to annual revenue estimates, with 2026 and 2027 moving sharply higher since this summer.
Back in July, prior to Q2’s earnings, Meta was expected to generate $215.1 billion in revenue, with that now sitting at $234.7 billion. On a YoY basis, growth has been revised from 14.0% to 17.7%, a smaller uplift considering 2025 comps have toughened, having risen from 14.7% to 21.3% over the same period.
For 2027, Meta was expected to generate $240.6 billion in late July, with that now sitting at $271.0 billion, with YoY growth moving from 11.9% to 15.5% on a higher base.
Key Metrics
Meta’s key metrics strengthened broadly in Q3. Ad impressions growth accelerated three points to 14% YoY, its fastest growth since Q1 2024. Pricing has remained relatively stable at 10% YoY in Q3, up one point sequentially, driven by increased advertiser demand fueled by improved ad performance.
Family of apps daily active people (DAP) also accelerated to 7.6% YoY to 3.54 billion, up from 6.4% growth last quarter and marking its fastest growth since Q4 2023.
Operating Margins Contracts Sequentially
Despite the topline reacceleration in Q3, Meta’s operating margin contracted as expenses grew 32% YoY, six points faster than revenue growth.
Gross margin was 82% in Q3, up 0.2 points YoY but down 0.1 points QoQ.
Operating margin was 40%, down 2.7 points YoY and 3.0 points QoQ. Aside from Q4 typically being seasonally stronger, the expense guide for next year suggests operating margin could return to the mid-30% range.
Net margin was 5.3%, negatively impacted by a one-time, non-cash income tax charge of $15.93 billion; excluding this charge, net margin would’ve been 36.4%, down 2.3 points YoY and 2.2 points QoQ.
Earnings
Due to the income tax charge, Meta reported $1.05 in GAAP EPS; adjusted for this charge, EPS was $7.25, compared to estimates for $6.67.
Looking ahead, GAAP EPS growth is expected to remain approximately flat for the next three quarters due to the margin pinch from rising expenses:
Q4 GAAP EPS estimated at $8.17, up 1.9% YoY.
Q1 ’26 GAAP EPS estimated at $6.32, down (1.7%) YoY.
Q2 ’26 GAAP EPS estimated at $7.08, down (0.8%) YoY.
For FY25, Meta is expected to deliver a (2.2%) decline in GAAP EPS to $23.34, with the decline primarily due to Q3’s income tax charge-related miss. Earnings growth is expected to rebound to 27.3% to $29.72 in 2026.
Cash and Balance Sheet
Operating and free cash flow margins expanded sequentially, though Meta is expected to see a steep free cash flow crunch moving through 2026 as a result of surging capex (which also does not reflect the company’s true spending on data center infrastructure).
Operating cash flow was $30.0 billion in Q3 for a 58.5% margin, down from a 60.9% margin in the year ago quarter but up from a 53.8% margin in Q2.
Free cash flow was $10.63 billion for a 20.7% margin, down sharply from a 38.2% margin in the year ago quarter but up from 18% in Q2.
Q3 capex rose 110.5% YoY to $19.34 billion, driven by investments in servers, network infrastructure and data centers. Based on 2025’s capex guide, which was raised to $70-72 billion (up 81% YoY at midpoint), Q4 capex is on track to be ~$21 billion, up 41.5% YoY.
Creative Funding Solutions Not Appearing in Capex, Saving Cash
Another important point to cover is Meta’s use of creative financing solutions to build out its large scale data centers, such as its joint venture with Blue Owl to fund its Hyperion data center in Louisiana. The additional costs are not appearing in capex but rather in ‘other investing cash flows’.
Under the JV deal, Blue Owl will own 80% and Meta will retain a 20% stake, overseeing construction and ultimately renting the data center once operational. However, concerns are rising about the deal structure, as the WSJ points out that the facility is “financed with debt, and neither the data center nor the debt will be on [Meta’s] own balance sheet.”
Truist analysts questioned CFO Susan Li about the JV and how it will appear in and affect capex:
“And then Susan, how do you see the on-balance sheet versus off-balance sheet financing of your AI initiatives? You've recently struck a deal with Blue Owl for the Louisiana data center. Is that part of the CapEx guide for '26? And if it's not, how significant will that way of funding be for Meta going forward? And basically, would that slow down your CapEx growth past 2026?”
CFO Susan Li: “So the JV that we announced with Blue Owl is sort of an example of finding a solution that enabled us to partner with external capital providers to codevelop data centers in a way that gives us long-term optionality in supporting our future capacity needs just given both the magnitude, but also uncertainty of what the capacity outlook in future years looks like.
In terms of how that is recognized as Capex, our prior Capex reflected a portion of the data center build cost prior to the joint venture being established. Going forward, the construction cost of the data center will not be recorded in Capex as the data center is constructed, we will contribute 20% of the remaining construction costs required, which is in line with our ownership stake, and those will be recorded as other investing cash flows.”
Valuation
Meta’s shares are trading slightly above its median forward PS valuation since the start of 2024 at 8.1x, though this has compressed from 9.4x in prior to Q3 earnings in late October after shares sold off.
On the bottom line, Meta is valued at around a 25x forward PE, slightly above its 5-year median of 22.2x, though the company had traded as low as the single-digits in late 2022 and early 2023 when its metaverse spending spree cut into operating and net margins. Looking out to 2026, Meta trades at ~22x current EPS estimates, slightly above its average of 20.7x since the start of 2024.
However, where the valuation gets stretched is on the free cash flow side – looking ahead to 2026 and the projected $19.7 billion in free cash flow (subject to change with capex forecasts), Meta trades at 85x estimated 2026 FCF. This would represent a significant deterioration of this multiple from the current 38.3x and represent the most expensive Meta has traded on an FCF basis since shortly after its IPO.
Conclusion
The most recent earnings report proves that Meta is using AI internally to materially move the needle. Meta’s Advantage+ automation tools continue to drive measurable improvement in advertising efficiency with an updated annual run rate that exceeds $60 billion – a substantial run rate considering this was launched only three years ago.
Across the board, there was a noticeable reacceleration in impressions, and ARPP was at a fresh record despite it not being the company’s seasonally strongest quarter. Plus, Reels is also up 5X in two years, reporting a $50 billion run rate following improvements in the AI-driven video content recommendation system.
However, the main risks to Meta’s thesis lay within its ambitious capacity expansion plans, with management laying the framework for easily over $100 billion in capex in 2026 and notably stronger expense growth. This is not only expected to create a large FCF crunch similar to 2022, back to <$20 billion, but also a substantial headwind to operating margins and thus EPS.
There’s an ongoing glass-half-full versus glass-half-empty debate in AI — enormous potential on one side, significant cost on the other. We remain firmly in the glass-half-full camp. But if the market chooses a glass-half-empty view, we also know that lower prices often create some of the best long-term opportunities.
Damien Robbins, Equity Analyst at I/O Fund contributed to this analysis.
Please note: The I/O Fund conducts research and draws conclusions for the Fund’s positions. We then share that information with our readers. This is not a guarantee of a stock’s performance. Please consult your personal financial advisor before buying any stock in the companies mentioned in this analysis.
Broadcom’s total AI-related orders on hand exceed $73 billion, nearly half of the company’s consolidated $162 billion backlog. The $73B backlog is expected to ship over the next 18 months. This backlog includes not only XPUs but also networking components. Most of the earnings call was management explaining the $73 billion is a baseline for the next 18 months.
Notably, there’s been a significant amount of hype around custom silicon challenging Nvidia, thus, the bar was set high going into this earnings report. For Broadcom, the words “steady as you go” come to mind.
Next quarter, AI revenue is expected to double year-over-year to $8.2 billion. During fiscal year 2025, AI revenue grew 65% year-over-year to $20 billion, leading to semiconductor revenue seeing an all-time high of $37 billion. During the fiscal year, the Infrastructure Software segment posted 26% growth to $27 billion, led by strong adoption of VMware Cloud Foundation, which represents enterprise software monetization.
Management emphasized that AI has now grown more than 10x over the past 11 quarters, illustrating how rapidly Broadcom has scaled this business. Custom accelerators, or XPUs, more than doubled year-over-year, primarily driven by Google’s TPUs as Big Tech now turns toward monetizing their platforms through inference APIs and AI-driven applications.
The report was fairly neutral as Broadcom struggled to live up to the recent custom silicon hype; yet it’s also clear Broadcom is in pole position to be a large beneficiary of the incoming AI Monetization Supercycle. You can view my free coverage here, where I connect the dots on why the AI trade’s best years are still up ahead.
Regarding this earnings report, the main topics can summed up by the expanding customer list, the margin compression expected from XPUs, and the strength of Tomahawk 6.
$73 Billion Visible Backlog and Expanding Customer List
In the opening remarks, Hock Tan provided an update on the backlog, stating “And all these components combined with XPUs, bring our total order on hand in excess of $73 billion today, which is almost half Broadcom's consolidated backlog of $162 billion. We expect this $73 billion in AI backlog to be delivered over the next 18 months. And in Q1 fiscal '26, we expect our AI revenue to double year-on-year to $8.2 billion.”
The earnings call was essentially a series of questions dissecting this statement. Overall, Tan implied this is more of a baseline, stating: “And obviously, this is as of now, I mean, we fully expect more bookings to come in over that period of time.”
Broadcom has an expanding customer list that is quite impressive, including Google, Meta, Bytedance, Anthropic and now a fifth customer (analysts asserted the 5th customer is OpenAI, management declined to comment). The fourth customer, Anthropic, placed a $10 billion order for the TPU Ironwood racks with an additional $11 billion placed in the latest quarter. In the earnings call, management made sure to state they are building server racks for Anthropic and not only chips – stating it was “a system sale.”
The market is suddenly taking notice of custom silicon (despite it being debated as a risk to Nvidia for over a decade) because an R&D lab is turning to TPUs and also now that Ironwood v7 is the first generation of TPUs to be specifically designed for inference.
Tomahawk 6
Broadcom’s Tomahawk 6 is an Ethernet switch built to address the scaling limits of AI clusters as they move beyond single-rack deployments by allowing hyperscalers to interconnect tens of thousands of accelerators with predictable performance, high bisection bandwidth, and tighter cost and power control.
Tomahawk 6 delivers up to 102.4 Tbps of switching capacity and effectively doubles bandwidth versus the prior generation, enabling large-scale GPU and custom XPU fabrics to scale out while preserving low latency and power efficiency. Broadcom is making a bet that AI systems will increasingly rely on Ethernet for cluster expansion rather than proprietary fabrics (such as Nvidia’s NVLink).
According to management, the new Ethernet switch is ramping quickly over the past 3 months and the current order backlog for AI switches exceeds $10 billion:
“And frankly, we see that bookings not just in XPUs, but in switches, DSPs, all the other components that go into AI data center. We have never seen bookings of the nature that what we have seen over the past 3 months, particularly with respect to Tomahawk 6 switches. This is one of the fastest-growing products in terms of deployment that we've ever seen of any switch products that we put out there. It is pretty interesting and partly because it's the only one of its kind out there at this point at 102 terabits per second. And that's that exact product needed to expand the clusters of the latest GPU and XPUs out there.”
XPUs will Lead to Margin Compression
If I were to point to why there is weakness after hours, it’s likely a combination of the $73 billion not meeting the high bar the custom silicon hype set for the company, but also the discussions around XPUs leading to margin compression over time.
The company will have to pass-through more third-party components such as memory, optics, and power infrastructure, which will lead to gross margins contracting. However, management was clear that gross profit dollars and operating income dollars will continue to rise due to scale and operating leverage.
According to the CFO: “And so those gross margins will be lower. However, overall, the way Hock said it, gross margin dollars will go up, margins will go down, operating margins — because we have leverage operating margin dollars will go up, but the margin itself as a percentage of revenues will come down a bit.”
Financials
Revenue grew by 28%
Broadcom’s FQ4 ending October 2025 revenue grew by 28.2% YoY and 12.9% QoQ to $18.02 billion, beating estimates by 3.2%. Revenue growth accelerated by 6.2 percentage points from 22% growth reported in FQ3. The strong growth was primarily driven by a surge in AI revenue and growth in Infrastructure software revenue.
Management also provided a strong FQ1 revenue guide of $19.1 billion, implying a YoY growth of 28.1% and 6% QoQ, beating estimates by 4.3%. The expected strong growth is primarily driven by AI revenue, which is expected to double YoY to $8.2 billion. Analysts expect strong growth to continue, with revenue expected to grow 26% YoY to $18.91 billion in FQ2 and accelerating 49.3% YoY growth to $23.82 billion in FQ3.
For FY2025, ending October, revenue grew by 23.9% YoY to a record $63.89 billion. The strong growth was primarily driven by AI revenue and VMware. Looking forward, analysts expect revenue to grow 35.7% YoY to $86.1 billion in FY2026 and 33.1% YoY to $114.59 billion in FY2027.
Key Segments
Semiconductor Solutions
FQ4 semiconductor solutions revenue grew by 35% YoY to $11.07 billion, primarily driven by strong AI revenue. Revenue growth accelerated by 9 percentage points from 26% growth reported in FQ3. Management expects semiconductor revenue growth to further accelerate 15 percentage points to 50% YoY, reaching $12.3 billion in FQ1, driven by a surge in AI revenue. For FY2025, semiconductor revenue grew by 22% YoY to a record $36.9 billion.
FQ4 AI revenue grew by 74% YoY and 25% QoQ to $6.5 billion and was higher than the management guide of $6.2 billion. CEO Hock Tan said in the earnings call, “And this represents a growth trajectory exceeding 10x over the 11 quarters we have reported this line of business. Our custom accelerated business more than doubled year-over-year, as we see our customers increase adoption of XPUs, as we call those custom accelerators in training their LLM and monetizing their platforms through inferencing APIs and applications.” It further highlights the point that we have discussed in our article here that Broadcom is a silent beneficiary of the AI Monetization trend.
Management also highlighted that these XPUs have also been extended to other LLMs, “best exemplified at Google, where the TPUs use in creating Gemini, have also been used for AI cloud computing by Apple, Coherent and SSI as an example. And the scale at which we see this happening could be significant.” Management confirmed that the $10 billion order from the fourth customer they mentioned in the last earnings call was from Anthropic and that they received an additional $11 billion order this quarter for delivery in late 2026. Broadcom also announced a fifth XPU customer this quarter, who has placed a $1 billion order to be delivered in late 2026.
Management also provided a strong AI revenue guide for FQ1 of $8.2 billion, implying a 100% YoY and 26% QoQ growth. The expected strong growth is primarily driven by custom AI accelerators and Ethernet AI switches. For the FY2025, AI revenue grew by 65% YoY to $20 billion. Management expects AI revenue to accelerate in FY2026 and drive most of Broadcom’s growth in FY2026.
Non-AI semiconductor revenue in FQ4 grew by 2% YoY and 16% QoQ to $4.6 billion primarily driven by favorable wireless seasonality. As seen below, the gap between AI and non-AI revenue is widening as AI growth accelerates. Management expects non-AI-semiconductor revenue to be flat YoY to $4.1 billion and down sequentially in FQ1 due to wireless seasonality.
Infrastructure Software
FQ4 Infrastructure software revenue grew by 19% YoY to $6.9 billion, above the management guide of $6.7 billion. Bookings continue to be strong, with total contract value booked in FQ4 exceeding $10.4 billion compared to $8.2 billion in the same period last year.
The Infrastructure Software backlog was $73 billion compared to $49 billion in the same period last year. Management expects renewals to be seasonal in Q1 and expects Infrastructure Software revenue to be $6.8 billion, down (2%) sequentially and up 1% YoY.
For the FY2025, Infrastructure Software revenue grew by 26% YoY to $27 billion, primarily driven by strong VMware revenue. Management expects Infrastructure Software revenue to grow in the low double digits in FY2026.
Margins
Broadcom reported better margins than expected, primarily due to higher software revenue than expected, operating leverage, and better product mix within the semiconductor revenue. As discussed earlier in our article that AI revenue will lead to lower gross margin in the coming quarters. However, management was clear that gross profit dollars and operating income dollars will continue to rise due to scale and operating leverage.
FQ4 gross profits grew by 36.1% YoY to $12.25 billion, with a gross margin of 68%, an improvement of 390 basis points YoY and 90 basis points sequentially. Adjusted gross margin was 77.9%, up 100 basis points YoY and down 50 basis points sequentially. It was better than the management guidance of 77.7% primarily due to higher software revenues than expected and better product mix within semiconductors. Management expects FQ1 adjusted gross margin to be down 100 basis points sequentially to 76.9% primarily due to higher mix of AI revenue.
FQ4 operating income grew by 62.3% YoY to $7.5 billion. Operating margin improved 8.8 percentage points YoY and 4.8 percentage points sequentially to 41.7%, primarily driven by operating leverage. The adjusted operating margin was 66.2%, compared to 62.7% in the same period last year and 65.5% in the previous quarter.
Net income grew by 102.6% YoY to $8.5 billion with net profit margin of 47.3% compared to 30.8% in the same period last year. Adjusted net income grew by 39.5% YoY to $9.7 billion, with an adjusted net profit margin of 53.9% compared to 49.6% in the same period last year.
FQ4 adjusted EBITDA grew by 34.4% YoY to $12.2 billion with an adjusted EBITDA margin of 68% and was better than the management guide of 67%. For FQ1, management expects adjusted EBITDA margin to be down 100 basis points sequentially and YoY to 67%.
For FY2025 gross margins came at 67.8%, an improvement of 480 basis points YoY. Similarly, operating margin improved by 13.8 percentage points to 39.9%. The adjusted EBITDA margin was 67% compared to 62% last year.
Adjusted EPS grew by 37%
FQ4 GAAP EPS grew by 93.3% YoY to $1.74. While adjusted EPS grew by 37.3% YoY to $1.95, beating estimates by 4.3%. Analysts expect adjusted EPS to grow by 23.3% YoY to $1.97 in FQ1 and 28.7% YoY to $2.03 in FQ2.
Strong adjusted EPS is expected to continue in the coming years and analysts expect FY2026 adjusted EPS to grow by 39.1% YoY to $9.39 and 35.6% YoY to $12.72 in FY2027. However, these estimates are conservative, as the ramp-up of recent deals is expected to provide a further boost to the bottom line in the long term.
Cash Flow and Balance Sheet
Broadcom’s cash flows are improving, driven by higher profits.
FQ4 operating cash flows grew by 37.5% YoY to $7.70 billion with an operating cash flow margin of 42.8% compared to 39.9% in the same period last year.
FQ4 free cash flows grew by 36.2% YoY to $7.47 billion with a free cash flow margin of 41.4% compared to 39% in the same period last year.
Cash was $16.18 billion at the end of FQ4 with debt of $65.1 billion compared to $10.7 billion cash and debt of $64.2 billion at the end of FQ3; cash increased due to higher free cash flows in the recent quarter.
Management also increased the quarterly dividend by 10% to $0.65 or $2.60 for FY2026.
Inventory grew by 4% sequentially to $2.3 billion in FQ4.
Conclusion:
Broadcom provided a solid report with no red flags to speak of. The AI cycle is approaching an inflection point, as a technology long debated will finally begin to move toward monetization, which will be a defining moment for the markets. If I had to guess, after listening closely to the management teams on the front lines, we will see major progress on inference in 2026 with more economic impact in 2027-2028.
That makes 2025 the AI crux as many companies are spending an ungodly amount on building AI infrastructure with little immediate return on investment. When revenue and profits begin to catch up to these investments, the impact could be significant. I believe Broadcom will have a front row seat for that moment.
You can read previous discussions around Broadcom’s custom silicon opportunity and networking opportunity in the deep dive on the Networking/ASICs Giant, the analysis covering the $110B backlog, and also This Stock is Set to Surge from AI Inference.Networking/ASICs Giant, the analysis covering the $110B backlog, and also This Stock is Set to Surge from AI Inference.
I/O Fund Equity Analyst Royston Roche contributed to this analysis.
Please note: The I/O Fund conducts research and draws conclusions for the company’s portfolio. We then share that information with our readers and offer real-time trade notifications. This is not a guarantee of a stock’s performance and it is not financial advice. Please consult your personal financial advisor before buying any stock in the companies mentioned in this analysis. Beth Kindig and the I/O Fund own shares in AVGO at the time of writing and may own stocks pictured in the charts.
When discussing the AI Monetization Supercycle, I would be remiss not to highlight Broadcom. The AI accelerator market will inevitably widen beyond Nvidia’s GPUs – the keyword is widen. More players will sell more AI systems as the market expands, and that growth supports both the clear leader (Nvidia) and those already in pole position, such as Broadcom.
Last week, amidst a flurry of noise in the AI market, my firm wrote an article on the AI Monetization Supercycle that is not being priced in. The analysis suggested the predominant risk is not an AI dot-com bubble or various headlines weighing on sentiment, but rather the risk investors face is missing out on what may be one of the strongest investing opportunities of our lifetime: what I’ve dubbed the AI Monetization Supercycle catalyzed by the inference phase.
While many refer to this as the “AI Supercycle,” I believe Monetization is a critical word missing from that description. The hallmark of the next phase will not be the architectural leap toward AI superintelligence (although important) – but rather, it will be defined by the ability to monetize this very expensive technology. As an investor, I am obligated to care more about the latter.
“Broadcom has already benefited from both increasing compute and networking needs – but the surge in inference demand will disproportionately (and positively) flow to Broadcom’s top line and bottom line. This is because custom silicon’s cost advantages and ability to drive lower inference serving costs at scale creates a strong value proposition for Big Tech. As more and larger clusters are deployed to serve exploding inference demand, there will be additional long-term tailwinds for the Ethernet networking giant.”
The inference phase – what I'm calling the Monetization Supercycle – is squarely in front of us. While many will understandably point toward companies like OpenAI as the biggest beneficiaries, it is one of the market’s greatest misconceptions that platform owners always outperform suppliers (hardware stocks). During the mobile era, Broadcom’s stock outperformed Apple precisely because it supplied RF and connectivity components to the iPhone giant.
Below, we look more closely to see if the “silent winner” Broadcom stock can repeat that outperformance again.
Stock Price Comparison Chart: $AVGO vs $AAPL. Broadcom Stock significantly outperformed Apple stock in the 10-year cycle of the mobile boom era, delivering a return of 1,490% compared to Apple’s 623%. Source YChartsYCharts
Google TPU Ironwood v7: The Custom AI Chip Built for Inference
Last April, Google announced that its upcoming seventh-gen TPU Ironwood is its “most performant and scalable custom AI accelerator to date, and the first designed specifically for inference.” Individual Ironwood TPUs are interconnected into larger units called pods, coming in two sizes, a 256-chip pod and a 9,216-chip Superpod, with the larger size offering up to 42.5 exaflops of performance. Notably, the Superpod would deliver 24x the compute of El Capitan, the largest supercomputer in the world. The rack-scale architecture offers 64 TPUs compared to Nvidia’s racks with 72 GPUs, with a small cluster being four pods connected through an optical circuit switch network. While TPUs may excel at driving down costs on certain workloads, Nvidia’s GPUs still lead when it comes to processing performance.
mid
Google adds that Ironwood offers 2x the performance per watt as last-year’s generation Trillium, with 6x more HBM and 4.5x the HBM bandwidth; versus TPU v5p, released in 2023, Ironwood brings a more than 10x improvement in peak performance per chip and per pod. The substantial increases in memory and bandwidth are critical for maintaining high performance when processing larger data sets while the improvements in power efficiency allows inference workloads to be run in a cost-effective manner.
It’s widely understood that Broadcom supplies Google with its custom TPUs. The incoming inference growth curve, that the I/O Fund detailed here, has led CEO Hock Tan to state Broadcom may witness an acceleration of XPU demand into the back half of 2026. He said, “In fact, what we've seen recently is that they are doubling down on inference in order to monetize their platforms. And reflecting this, we may actually see an acceleration of XPU demand into the back half of 2026 to meet urgent demand for inference on top of the demand we have indicated from training.”
Something similar was echoed in the FQ3 call, with Tan stating: “But also as for these guys, they got to be accountable to being able to create cash flows that can sustain their path. They [are] starting to also invest in inference in a massive way to monetize their models.” On that note, Google’s TPU business received a significant vote of confidence recently with Anthropic signing a deal for up to one million TPUs, including Ironwood, coming online in 2026. The deal is said to be worth tens of billions.
For Broadcom, the TPUs are expected to be the primary driver of AI revenue growth in fiscal 2026 – estimates from HSBC earlier this summer projected Google’s TPUs to represent ~58% of Broadcom’s ASICs shipments at 1.79 million, but account for ~78% of ASICs revenue at $22.1 billion. This is because Google’s TPUs were estimated to carry a significant price premium at $13,000 per chip versus Broadcom’s other projects at $5,000 per chip. However, this is still less than half the cost of Nvidia’s chips at $30,000 to $40,000 for a solo B200 ($60,000 to $70,000 for a GB200).
Looking beyond fiscal 2026, projections for TPU shipments are surging. Morgan Stanley now expects 5 million TPUs to be shipped in 2027, a 67% rise from its prior estimate for 3 million; for 2028, the firm estimates shipments as high as 7 million, a 120% increase from its prior estimate. This would project YoY growth of 40% from 2027 to 2028, a substantial increase from 6% previously, and will represent more than 2X growth in two years.
The I/O Fund first covered TPUs versus GPUs back in 2019 and revisited the topic in February 2024 in our analysis, Broadcom: Networking/ASICs Giant and the Second Largest by AI Revenue. Since then, we’ve provided quarterly coverage for two years. Broadcom: Networking/ASICs Giant and the Second Largest by AI Revenue. Since then, we’ve provided quarterly coverage for two years.
If you want cutting-edge insights on AI stocks early in the cycle — including our take on Broadcom’s earnings this evening — sign up now.sign up now.
Broadcom Stock’s AI Edge: Custom Silicon & Massive Hyperscaler Deals
Broadcom’s stock has been strong this year, outperforming the Nasdaq by nearly 50-points and SMH by 20-points. This strong performance is partly due to custom accelerators that are often multiples cheaper than Nvidia’s GPUs for inference tasks and also due to custom silicon becoming increasingly performant with each generation. By optimizing algorithms (software), Big Tech can drive higher performance from large language models — which helps to drive down costs while also increasing output for specific workloads.
For example, a rough idea as to how much it costs Nvidia to make merchant GPUs is estimated around $3,000 to $6,000 whereas the company charges $30,000 to $40,000 – hence the AI leader’s excellent margins. Reducing Nvidia’s high pricing power is what Big Tech is after and this can be accomplished both in the hardware costs but also through optimizing the workloads for specific use cases – for comparison, Ironwood is expected to cost around $13,000 per chip.
Big Tech is prominent in Broadcom’s custom silicon customer list, which includes Google and Meta. ByteDance reportedly emerged as the third customer last summer. The company announced its fourth customer in FQ3 with a $10 billion XPU order. Hock Tan said in the FQ3 earnings call, “Last quarter, one of these prospects released production orders to Broadcom, and we have accordingly characterized them as a qualified customer for XPUs and, in fact, have secured over $10 billion of orders of AI racks based on our XPUs.”
In late October, Anthropic signed a deal with Google worth tens of billions to access up to 1 million TPUs to bring online more than 1GW of capacity in 2026, although it has not explicitly confirmed if Anthropic is the mystery fourth customer.
Furthermore, OpenAI and Broadcom announced in October a strategic collaboration to deploy 10 gigawatts of OpenAI-designed AI accelerators. OpenAI and Broadcom will co-develop systems that include accelerators and Ethernet solutions from Broadcom for scale-up and scale-out. Broadcom plans to deploy racks of AI accelerators and network systems starting in the second half of 2026 and completed by the end of 2029.
The OpenAI deal represents a substantial three-year revenue ramp for Broadcom stock and further solidifies its position in the AI silicon market. Citi estimates the deal with OpenAI could bring in $100 billion in sales and $8.00 in earnings per share over the next few years; however, Mizuho highlighted that the deal to deploy 10GW of OpenAI's custom ASIC, code named Titan, could be even larger at an estimated $150 billion to $200 billion deal over multiple years.
The enviable customer list is showing up in Broadcom’s results. This quarter, management guided Q4 AI revenue to $6.2 billion, which would represent ~19% sequential growth and eleven consecutive quarters of YoY growth.
Broadcom did not lay out a FY25 AI revenue target, yet FQ4 ending in October 2025 implies Broadcom is guiding for $19.9 billion in AI revenue for the year, up 63% YoY from $12.2 billion in FY24. Mizuho estimates that AI revenue will grow 103% YoY to $40.4 billion for the FY2026 and nearly double to $78 billion in FY2028. However, given the growing customer list, these estimates could prove to be too low.
Additionally, Hock Tan will be duly rewarded should AI revenue targets exceed current expectations. In September, Tan received a performance award of 610,251 shares of common stock as part of a recent contract extension. The award will fully vest if Broadcom reaches $90 billion in revenue from its AI products over any consecutive four-quarter period from FY2028 through FY2030. That award will double if Broadcom earns $105 billion in AI revenue and triple if revenue totals more than $120 billion. If Broadcom fails to hit $60 billion in AI revenue during the period, Tan will forfeit the entire award. This provides investors with a framework for upper targets for the bull case.
Broadcom (AVGO) AI Revenue Forecast: Projected to hit $40.4 billion in FY2026, driven by Google TPUs and custom silicon demand.
Source: Company IR/TheFly/Mizuho
Broadcom’s Tomahawk 6: The Ethernet Switch to Power 1 Million-Plus AI Clusters
Broadcom has been quite vocal about the industry’s path to 1-million-plus accelerator clusters, frequently reiterating how its three hyperscalers and now four “each race towards 1 million XPU clusters by the end of 2027.” This would be multiples larger than current deployments, with xAI’s Colossus supercluster expanding from 100K to 200K GPUs Today, these clusters are 10-20X larger than Ironwood’s 9,216 chip SuperPod, highlighting the depth of AI demand.
Broadcom has continuously re-emphasized this forecast as it represents two major growth opportunities for the company: significant growth in accelerator deployments with inference tailwinds, and even more growth in networking deployments to support these clusters.
The shift to Ethernet and away from Nvidia’s lock-in ecosystem of GPU + InfiniBand is benefiting Broadcom, with the industry pointing to rising Ethernet demand. Arista said that momentum for Ethernet “has really shifted in the last year” while Nvidia touted that its new Spectrum-X Ethernet is annualizing at $10 billion in revenue, or $2.5 billion quarterly.
The company is committed to remaining on the leading edge of networking with its Tomahawk 6 switch, the industry’s first 102.4 Tbps Ethernet switch. The next-gen switch doubled the bandwidth of its predecessor, while offering flexible deployment ability with 1,024 100G or 512 200G SerDes options, reducing switch count.
This raw performance upgrade paves the way for >100K to 1 million accelerator clusters by allowing larger leaf-spine fabrics to be constructed, while drawing less power and keeping latency low. Broadcom exec Ram Velaga said that the demand for the new switch is “unprecedented” with multiple >100K accelerator deployments “using Tomahawk 6 for both the scale-out and scale-up interconnect.”
When discussing Tomahawk 6, management points toward the flattening of the AI cluster as an important catalyst for this product, stating: “[…] Tomahawk 6 enables clusters of more than 100,000 AI accelerators to be deployed in just two tiers instead of three … this flattening of the AI cluster is huge because it enables much better performance in training next-generation frontier models through a lower latency, higher bandwidth and lower power.” The two-tier topology also reduces complexity of cluster construction and reduces congestion choke points significantly, addressing another critical pain point of building larger and larger clusters.
Additionally, in terms of the AI networking opportunity, scale up is 5-10X more than scale out – setting up a nice trajectory as AI clusters grow. Oppenheimer analyst Rick Schafer highlighted that they expect next-gen Tomahawk6 volumes to ramp up in the second half of next year, providing added growth and gross margin boost.
Broadcom FQ4 Earnings Preview: AI Revenue Outlook & OpenAI Deals
Revenue expected to grow by 24.2% YoY and adjusted EPS by 31.7%.
AI Revenue outlook
New customer announcements
Update on AI Serviceable Market for 2027
Broadcom is expected to report FQ4 revenue of $17.46 billion, up 24.2% YoY and a 220-basis points acceleration from the 22% growth reported in FQ3. Adjusted EPS is expected to grow 31.7% YoY to $1.87.
Broadcom (AVGO) FQ4 revenue is expected to grow 24.2% YoY to $17.46 billion, driven by AI Revenue Acceleration.
Source: Company IR/Seeking Alpha
The company’s margins will be a key metric to watch in the upcoming report. Management has done an excellent job in maintaining strong margins. Broadcom has been able to reduce operating expenses through cost controls and operational efficiency. Management expects adjusted gross margins to be down 70 basis points sequentially to 77.7% in FQ4, primarily due to a higher mix of XPUs and wireless. However, they are expected to be up 80 basis points compared to the same period last year. The company’s operating leverage should help to compensate for any sequential weakness in gross margins due to the FQ4 product mix. Management adjusted EBITDA guide for FQ4 is 67%, flat sequentially and up 200 basis points YoY.
Analysts expect strong adjusted EPS growth in the coming years. Adjusted EPS is expected to grow 39.1% YoY to $9.39 in FY ending October 2026 and 35.6% YoY to $12.72 in FY2027. The strong expected EPS growth showcases operating leverage, successful VMware integration, the benefits of higher margin software revenue, and rising AI revenue.
During the last earnings call after winning the $10 billion XPU order from the new customer, Hock Tan said, “And reflecting this, we now expect the outlook for our fiscal 2026 AI revenue to improve significantly from what we had indicated last quarter.” We expect management to provide more details on the AI revenue outlook for FY2026. The Q4 management guide of $6.2 billion implies that Broadcom is guiding for $19.9 billion in AI revenue for FY2025, up 63% YoY from $12.2 billion in FY24. Analysts are pointing to 100% YoY growth in AI revenue in FY2026, with Mizuho estimating that AI revenue will grow 103% YoY to $40.4 billion.
According to a recent report by The Information, Broadcom is in discussion with Microsoft to co-develop custom silicon chips. Analysts will likely ask for more details on this and other customers such as the $10 billion XPU order mentioned during the FQ3 earnings call and the OpenAI deal announced in October. The OpenAI deal is also expected to provide a strong boost to the company’s bottom line as UBS expects “large-scale deployments are expected to ramp later, positioning EPS to reach about $13.50 in 2027 and potentially above $20 by 2028 as projects come fully online.” It highlights that the current consensus adjusted EPS estimates for FY2028 of $15.80 are very low, a 27% difference.
Hock Tan often references the AI Serviceable Market. We could expect Tan to provide an update for 2027 at the next earnings call, as the company has been adding new customers over the past year. Hock Tan had said during the FQ4 earnings call in December last year, “In 2027, we believe each of them plans to deploy 1 million XPU clusters across a single fabric. We expect this to represent an AI revenue Serviceable Addressable Market, or SAM, for XPUs and network in the range of $60 billion to $90 billion in fiscal 2027 alone.”
Conclusion:
This year, Broadcom stock has outperformed Nvidia’s stock despite the two being about $200 billion apart in AI revenue with Broadcom at $20 billion in AI revenue for FY2025 ending in October and Nvidia at $250 billion run rate in the quarter ending in Jan. Nvidia clearly has the scale for R&D purposes to help defend its lead. However, I’ve also argued inference will provide an opening for Broadcom and AMD to meaningfully compete on AI accelerators.
At the I/O Fund, when discussing Nvidia versus Broadcom, the answer is yes and yesyes and yes. We look for fundamental strength, product positioning, supply chain signals, and numerous other proprietary criteria to help us determine if a stock is participating in the AI trend.
I won’t yank your chain by pretending investors must choose one or the other. In a widening market, leadership compounds at the top and radiates outward as exponential demand will lift the entire ecosystem – including a ripple effect for lesser-known AI networking and AI energy names.
As we move deeper into the second half of this AI-driven decade, the investors who stay focused on the bigger picture — rather than react to every speculative headline or force themselves into a false binary — will be the ones best positioned to capture the full opportunity of the AI Monetization Supercycle.
This year, my firm has 15 positions beating the Nasdaq YTD, up from ten positions last year – helping to cement the I/O Fund as one of the world’s leading AI portfolios. Our cumulative return of 210% over a five-year period would rank us #2 if we were a hedge fund and #5 if we were an ETF – notably, this strong cumulative return does not yet include our 2025 performance.
Get real-time trade alerts, weekly webinars and deep dives on lesser-known AI stocks in our Advanced tier. Learn more hereLearn more hereLearn more here
Please note: The I/O Fund conducts research and draws conclusions for the company’s portfolio. We then share that information with our readers and offer real-time trade notifications. This is not a guarantee of a stock’s performance and it is not financial advice. Please consult your personal financial advisor before buying any stock in the companies mentioned in this analysis. Beth Kindig and the I/O Fund own shares in AVGO at the time of writing and may own stocks pictured in the charts.