Skip to content
Logo-main-white.860316a8

I/O Fund

  • Home
  • Free Stock Analysis
  • AI Stocks
  • BEST OF 2025
  • Analysts
  • Nvidia Hub
  • About
    • Case Studies
    • About Us
    • Premium Services
    • Pricing
    • Notable Wins
    • I/O Fund Reviews
    • Media
  • Contact Us

Category: Financial Markets

Slack’s missteps have now made the stock a ‘buy’ at the right price

Posted on September 5, 2019June 30, 2026 by io-fund
Slack’s missteps have now made the stock a ‘buy’ at the right price

Slack Technologies is the fastest-growing software-as-a-service (SaaS) company of all time and a Silicon Valley favorite, yet the direct public offering (DPO) clearly did not go well for public investors.

The shares WORK, +8.03%  opened at $38.50 on June 20, rose to $42 intraday, and have now sunk to a record-low of $26.25 in after-market hours leading into its first earnings report as a public company.

The losses are at 36% from its intraday high, and that occurred when many cloud-software initial public offerings (IPOs) have enjoyed triple-digit returns since going public.

So what went wrong? And, more importantly for growth investors, will things go right for San Francisco-based Slack soon?

Before the company releases second-quarter earnings Sept. 4, here’s insight into its revenue, valuation and competitors.

Slower growth

Slack’s product — an instant-messaging and collaboration system — has massive potential with a 143% net customer retention rate, yet the financials undermine the company’s growth trajectory. For instance, guidance for the current fiscal year is at 47% to 50% revenue growth year-over-year, down from 82% in the prior year. The slower growth, which was revealed in an updated prospectus two weeks before going public, was unlikely to win over many people regardless of how much traction the product has with current users.

Yet, there is impressive traction, with the average user keeping the app open for nine hours on her computer and engaging with it for 90 minutes a day. Compare that with the daily time spent on Facebook FB, +2.60%  58 minutes, Instagram, 53 minutes, YouTube, 40 minutes, Pinterest, 14 minutes, and messaging app WhatsApp, 28 minutes.

As I covered before the DPO, both sides of the debate have valid points when evaluating Slack’s future stock performance. However, due to Slack’s product strength, my prediction is the stock will have a turnaround as user loyalty will overcome the financial turbulence. The questions that remain: timing and valuation for entry.

Divergence in user base

Slack’s revenue grew 110% in fiscal years 2017-2018, and then slowed to 82% in 2018-2019. The company is now forecasting 47%-50% growth in the current fiscal year with revenue between $590 million and $600 million, compared with $400 million in fiscal 2019. This year’s estimated adjusted loss is estimated to be 41 cents to 44 cents a share.

On June 3, Slack released an updated prospectus that showed growth in customers worth over $100,000 in contracts, yet revealed a decline across paid user growth from 9,000 in the year-earlier quarter to 7,000 in the current quarter.

In other words, there is a divergence as overall paid users are declining, while customer accounts worth over $100,000 are growing. That could be because of internal efforts to raise revenue and focus on enterprise-level customers, which is a common strategy leading up to public offerings. More quarterly earnings are needed to ultimately decide which direction this will go, and if the larger accounts will pay off as a primary focus for growth.

Slack provided the net dollar retention rate in the S-1 filing, which depicts what percent of revenue from current customers is retained from the prior year, after accounting for upgrades, downgrades and churn. This is helpful in predicting growth for subscription-based companies.

The formula for the net dollar retention rate is: Beginning of period revenue + upgrades – downgrades + churn = y with y/beginning of period revenue.

If the net dollar retention rate is above 100%, then the growth from the existing customer base offsets the losses. If the number is below 100%, then downgrades and churn exceed growth.

Slack published a net retention rate of 143%, which is very good and outperforms most cloud software IPOs that provided this number in the past. This is due to Slack’s sticky traction and low churn with the current customer base.

One thing to note about the retention rate is that Slack officially launched in 2014, and has a shorter history than other companies on this list with many having launched 10 years prior to IPO compared with Slack’s five years. Typically, the longer the time period, the lower the net retention rate due to more opportunity for customer churn.

See: Beth Kindig runs a forum on tech stocks where she answers readers’ questions.

Valuation

Slack’s valuation is high — there’s no argument there. If we look at the $600 million in estimated revenue for fiscal 2020 at the $14 billion market cap, then Slack has a forward price-to-sales (P/S) ratio of 24.

Of course, we can name a long list of cloud-software companies with comparable price-to-sales or higher, but the difference is that Slack has not won over sell-side analysts, whereas Shopify SHOP, +0.67%, Zoom Video Communications ZM, +1.16%  and Okta OKTA, -0.20%  have. Certainly, returns are healthier if you can beat sell-side analysts to a winning stock. (For instance, my newsletter subscribers beat sell-side analysts to Roku ROKU, +7.67%  for much higher gains.)

We are also seeing some slight exhaustion in the market with regard to cloud-software valuations. Last week, a few companies beat on both top-line and bottom-line estimates, such as Veeva Systems VEEV, -0.82%  and WorkdayWDAY, -0.75%, yet the stocks dipped as much as 6%.

One thing to consider with Slack is that the potential market is nearly impossible to predict as the company is carving out a new category. The global enterprise collaboration market is expected to grow from $34.6 billion to $59.9 billion, with a growth rate of 11.6%.

This is a sizable market for a company with $600 million in revenue. However, it’s hard to determine where Slack’s product fits. Slack CEO Stewart Butterfield alludes to owning 2% of the software market as a force extender for the other 98% of the software market, and that would equate to a market worth $12 billion in annual enterprise software sales.

Okta is a great example of a company that has similar numbers on its profit-and-loss statement, yet Okta earned its market cap through a series of strong earnings reports and gaining the trust of public investors, whereas Slack demanded a record-breaking price-to-sales right out of the gate. TwilioTWLO, +2.02%  also has a similar profit-and-loss statement, but is trading at 16 forward price-to-sales. Slack not only priced itself too high for a new company with slowing growth, but it’s also likely the direct public offering didn’t help.

DPOs

In August 2018, Slack was valued at $7 billion in its last venture round and listed at nearly double that in June 2019 when it was listed on the public market.

Herein lies the problem with direct public offerings, which are heralded as a way of cutting out middlemen and fees: The lack of a lock-up period allows the company to price high on the public markets for the benefit of insiders rather than fairly price the stock with the understanding that insiders will lose if the company is overpriced and the stock attracts downward momentum.

Many investors are aware that IPOs can be risky, although tech companies have a penchant for proving these risk-averse investors wrong with many recent triple-digit success stories. In this case, however, both Slack and SpotifySPOT, +0.03%  have proven that DPOs are not ideal for public investors as the opening valuations have not been sustained in the long term. This could be due to a lack of consequence for listing too high.

Competitors

There are some valid points on the more bearish side of the debate, but using Microsoft MSFT, +1.17%  Team’s 13 million users as the primary weak point is not of them. As with most David and Goliath battles in tech, the market has this backwards.

Slack is a small, relatively unknown brand that has managed to keep pace with one of the world’s most recognized brands — Microsoft. The fact they are almost equal in users at 10 million for Slack and 13 million for Microsoft is a boon for Slack, not the other way around. This proves that Slack is a serious contender and able to attract users with a hundredth of a decimal point in revenue compared with Microsoft’s trillion-dollar market cap.

Slack is a stand-alone app compared with Microsoft’s legacy enterprise software suite, which is now sold as a subscription in the cloud as Microsoft Office 365, yet was originally launched in 1990. Microsoft Outlook has an estimated 400 million users, primarily enterprise.

To say that Microsoft launched Teams in 2017 and has quickly caught up to Slack is not exactly accurate. Microsoft has owned business communications for nearly 30 years and has spent $35 billion in acquisitions to own the messaging space pre-emptively with the acquisition of Skype for $8.5 billion and LinkedIn for $26.2 billion. Those acquisitions occurred around the same time that Microsoft considered acquiring Slack for $8 billion.

Microsoft then leveraged its hundreds of millions of enterprise software customers and copied Slack’s approach. Yet, somehow, Slack should be afraid of Microsoft? I disagree. Investors should be asking themselves why 600,000 organizations are downloading a separate app to hold their business discussions with many being Microsoft Office users.

More importantly, the word Slack is becoming synonymous for business messaging. Like what Kleenex did for facial tissues, “to slack someone” means to send a coworker a message. I do not foresee anyone using Microsoft Teams in this manner, and this is the best free marketing a company can have.

The main product differentiation is Slack’s customization. There are over 1,500 standard integrations with Slack, such as with Zoom video-conferencing and Google Drive. However, there are over 450,000 applications developed internally by Slack customers, according to the CEO. Those applications come from developers who want a more advanced alternative to the closed ecosystem that Microsoft provides.

Conclusion

There is a healthy debate on Slack, and both sides have valid arguments. On the one hand, you have a company with slowing growth, and on the other, you have a product with strong industry key metrics and a highly engaged user base.

When looking at valuation for companies that have similar profit-and-loss statements, it becomes clear that Slack came on too fast and too strong with its valuation. This is a mistake the company has paid for, as the momentum is now downward. Better to have listed at a $10 billion market cap and earned the $14 billion market cap than the reverse, as many public investors can be myopic with tech products and are easily scared off.

For opportunists and visionary investors, however, the downward momentum on a product that is becoming synonymous with business messaging is welcomed for an attractive entry.

This article appeared on MarketWatch September 4th, 2019.MarketWatch September 4th, 2019.
Posted in Cloud Software, Financial Markets, ProductivityLeave a Comment on Slack’s missteps have now made the stock a ‘buy’ at the right price

Uber and Lyft: Unprofitable Powerhouses

Posted on August 9, 2019June 30, 2026 by io-fund
Uber and Lyft: Unprofitable Powerhouses

Ride-share earnings this week proved that if you lower the bar to the ground, any earnings performance can leap over it. Both companies reported staggering losses that were delivered with positive PR spins. 

Lyft reported “record second quarter results” while losing roughly the same amount of money as previous years. Uber had an epic $5 billion loss that is closer to $1.3 billion adjusted. The second number only looks acceptable in the parallel universe where a $65 billion market cap company can report any losses at all, let alone $4 billion per year. 

Likewise, Lyft looks digestible compared to its counterpart at $850M in losses, until you realize these numbers haven’t improved since 2016 when the company reported negative net losses of $692M and net losses of $708M in 2017. There is an improvement from 2018, but again, this depends on how you spin it. To me, it’s cut and dry – Investable companies should have fewer losses as they grow revenue. There may be quarters where a company moves backwards, maybe due to capex or another legitimate reason, but the revenue growth in ridesharing creates losses due to subsidizing, and this is a holistic problem that is not going away. 

The market found it encouraging that Lyft was expected to lose $1.1B but has revised this to $850M for 2019. Profit margins are negative 23%versus negative 37.7%. The price was adjusted for the $200M improvement, which during after-hours resulted in a 11% spike. The spike soon settled when Lyft announced they are moving up the lock-up period from late September to August 19th. 

We see evidence of the holistic problem where Lyft’s losses will marginally improve this year compared to last year. There is no evidence, however, that this is sustainable. If Lyft needs to support R&D on autonomous driving, for instance, then the margins will be deep in the red once again. An important metric to watch is the EBIT margin of -77% compared to -61% a year ago.

Uber’s Q2 resultsare more straight forward to analyze. Adjusted EBITDA was negative 292M in the year-ago period compared to negative 656M in the current period for an increase of 125%. Keep in mind, Uber Eats and Uber Freight help offset the losses. 

As I stated in MarketWatch, I’m not a fan of the price war narrative. Increases in revenue per users is irrelevant if the losses are also accelerating or stagnant. This means the subsidization of rides continues to drive demand, and if both companies raise prices, they will also have more losses. The end of a price war sounds like a PR spin to me and we see no evidence in the financials that this will do anything for profitability.

There are also many other unknowns in how demand will react to higher priced supply. Gross bookings may decrease as people decide to drive to a destination, park at the airport for $8 per day, or hire a regular taxi who is already waiting outside many venues. Also, Uber may pull ahead of Lyft if prices go up as the service has more drivers readily available and is a larger brand. 

I’ve written extensively about these companies and expressed why my readers should steer clear ahead of the IPOs during the exuberant market of April 2019. I highly recommend anyone who wants to invest in the ride-sharing story to consider the liquidity the lock-up expirations will create with more shares flooding the market.  

I won’t repeat everything here, but below are a few bullet points from my previous analysis published March 14th, 2019 – one month before Lyft went public. I’ve also included links to my previous analysis on Uber – both before and after the company went public.

  • Lyft and Uber pay incentives to acquire and retain users. In gaming, a company might spend $8 to acquire a user with a lifetime value of $15 per user for a profit of $7. The problem with ride-sharing apps is that the incentives offered do not cover the costs of the ride, and that is one reason we see strong sales growth mired by substantial net losses.
  • Reuters has some historic information on this dated back to 2015, when Uber passengers paid only 41 percent of the actual cost of their trips. At the time, Reuters reported that this creates an “artificial signal about the size of the market” with Uber releasing limited financial data that showed losses of $708 million per quarter.
  • Lyft and Uber are mobile applications, but the business model is more of a large-cap human resources department with many variables around wages, and potentially regulations due to independent contractor classifications. (There was a recent $20 million settlement due to the misclassification of drivers in California).
  • A paramount risk to both Uber and Lyft is total addressable market. Room for geographic expansion is limited beyond the United States, other than a few outlier countries like Saudi Arabia. Of course, the underlying issue with TAM is a lack of intellectual property with an easy-to-duplicate mobile application that leverages common app features such as GPS location and SMS/voice. For a list of competitors, reference “Lyft: Risky Valuation and No Intellectual Property”

My premium subscribers received a 12-page report on Roku And TTD prior to earnings, Snap prior to earnings and tech trade war plays to hedge their portfolios. Premium researchPremium research members receive updated recommendations and entry/exit scenarios on tech stocks. Learn more hereLearn more here. 

For additional information on Uber: 

Uber IPO: Record-Breaking for All the Wrong ReasonsUber Stock Had Disappointing Q1 Earnings: So Why Did the Price Go Up?

Posted in Consumer Tech, Financial Markets, TravelLeave a Comment on Uber and Lyft: Unprofitable Powerhouses

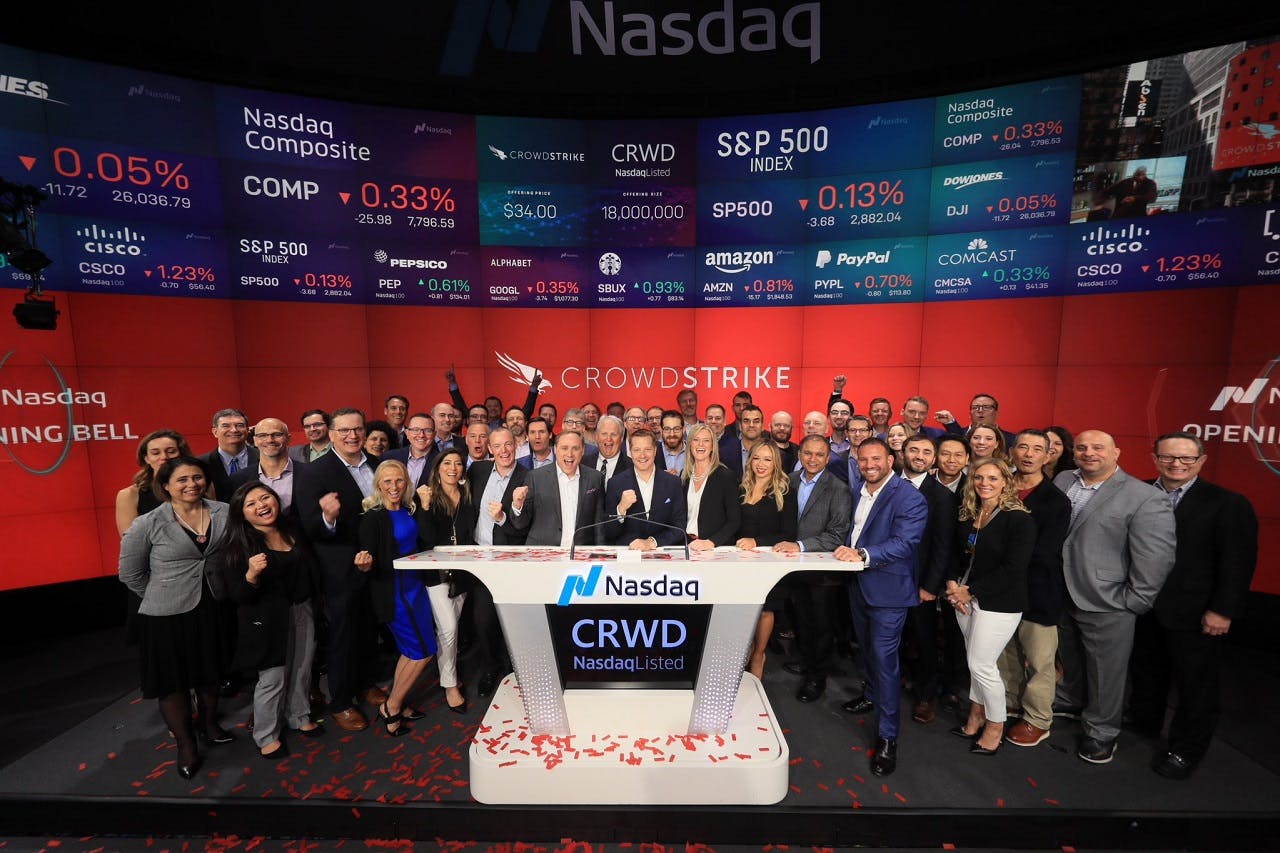
CrowdStrike IPO: Price at 2x Addressable Market

Posted on June 21, 2019June 30, 2026 by io-fund
CrowdStrike IPO: Price at 2x Addressable Market

Crowdstrike is another Silicon Valley startup that recently went public with triple-digits across the board including revenue growth, net retention rate, and annual revenue-run rate, which may have you wondering, how does one tell all of these Silicon Valley IPOs apart? For the Crowdstrike IPO, as with most cybersecurity companies, competitive landscape is crucial and requires bulletproof product differentiation as security is a very crowded space. This analysis will look into the product differentiation between Crowdstrike and its competitors for endpoint security to achieve an understanding of valuation and to form a prediction of how Crowdstrike will perform as a public company. Addressable market will also be taken into consideration as endpoint security has demand limitations.

Overview of Endpoint Security

Understanding the basics around endpoint security is important as Crowdstrike’s strength resides in how the software uses artificial intelligence to detect breaches. Some of the company’s growth may also come from offering multiple cloud modules, which provides various product features for flexibility.

The primary category for Crowdstrike is endpoint security, which secures endpoints on a network, defined as end-user devices, such as mobile devices, laptops and desktop PCs, although endpoint security can also include servers in a data center and IoT devices.  Endpoint security protects the corporate network from remote devices by securing the endpoints on the network. Traditionally, endpoint security consists of security software centrally managed on a server or gateway and software on the client devices. The server authenticates logins from the endpoints and updates the software when needed.

Crowdstrike’s product improves this process by aggregating the data from the endpoints across their entire customer base, while using AI and behavior pattern-matching to stop breaches. According to CrowdStrike, their Falcon product correlates more than 90 billion security events globally to prevent and detect threats. Relying on AI’s detection capabilities for security breaches and fraud is becoming a trend into the foreseeable future. For instance, I recently interviewed Mastercard’s Vice Chairman on how Mastercard uses pattern-matching to detect fraud and unusual behavior on my tech podcast, and has been successful in preventing high-loss activities such as money laundering as these behavioral patterns appear erratic to AI, and become easily detectable. 

Crowdstrike had one offering until 2017 when the company launched multiple cloud modules to provide flexibility, which are all subscription-based. According to Crowdstrike, offering different subscription options has been successful with 47% of customers buying over 4 modules, per the S-1 Filing.

Crowdstrike IPO and S-1 Filing by the Numbers

Crowdstrike has grown at a blistering pace from $37 million in revenue in 2017 to $92 million in 2018 to $219 million in 2019. The numbers published for the Crowdstrike IPO show an undeniable triple-digit growth trajectory, but keep in mind, that cybersecurity is a crowded field with many players dealing in endpoint security – more on this below.

Loads of Competition:

Endpoint security is a crowded space. Not only do you have incumbents like Symantec, but you have small to mid-cap companies – both public and private. The market size for endpoint security was at $6.4 billion in 2018 and will grow to $13.2 billion by 2022, according to Statista. Meanwhile, you have more than 20 companies competing for the $7 billion slice of pie. This is the bigger concern for Crowdstrike. Investors in Crowdstrike will have to believe that crowdsourcing endpoints and scanning for breaches with AI is enough of a differentiator to pull ahead and maintain a lead.

Assuming Crowdstrike claims the entire endpoint security market, the current valuation impedes investor returns. The market cap for Crowdsrike is at $14 billion, at time of writing – or 200% of the current addressable market and over 100% of the addressable market for 2022.

This is not the addressable market in the S-1 filing, however, which is listed at $24.6 billion in 2019 and expectations to reach $29.2 billion in 2021. The addressable market that Crowdstrike claims is a bit distorted, in my opinion, as it aggregates various forms of revenue streams (which are not later broken out in the S-1 filing). For the most part, Crowdstrike is considered an endpoint security product and frequently ranks on analyst reports for this category. There is very little mention of Crowdstrike ranking in any of the other categories which are being used to stretch the addressable market, notably, threat intelligence, security and vulnerability management, IT service management software, and managed security service.

We have some indication that 47% of customers bought over 4 modules, per the S-1 Filing, but it’s unclear if these modules should fall under the endpoint security addressable market rather than under separate addressable markets as these modules cannot stand on their own. This is paramount to valuing the company (is Crowdstrike endpoint security or should it be placed under various categories) as the growth for endpoint security is too lean to have this high of a valuation.

Meanwhile, other cyber security companies such as Carbon Black, Trend Micro and Palo Alto Networks have not don’t particularly well on the public markets recently relative to other tech investments.

  • Carbon Black went public in 2018 in the $23 price range and is now trading at $15 due to a shift to cloud and other challenges required to keep up with competition. CarbonBlack is going through a “significant corporate transition,” consolidating its offerings into a cloud-based security platform, which confirms the competitive environment.
  • Trend Micro is the third-largest vendor in the Endpoint Protection Platforms (EPP) market and has a market cap of about $6.3B and has traded sideways for years between $30-$50 with a peak in September/October this year at $60 but saw a correction and resumed the $45 price.
  • Palo Alto Networks provided weaker guidance in the most recent earnings report and we’ve seen the price drop over the last month from $250 to $195. The company is also transitioning to the cloud and undergoing changes that impacted the recent earnings.

Conclusion

Crowdstrike’s IPO financials sparkle with triple-digit growth percentages across the board, as do many startups going public this year. However, the competitive landscape is fierce and the addressable market of $24 billion provided in the S-1 filing questionable. Perhaps the cloud modules expand the endpoint security addressable market beyond the $7 billion size, but not by much in the current calendar year as endpoint security platforms are more of a value-add than a sum of the aggregate security markets. In addition, cybersecurity is a lukewarm market compared to hotter tech industry verticals. The cloud-level AI aspect to detecting breaches is very interesting for future years, however, I am respectfully on the sidelines for now.

Read previous analysis on 2019 IPOs:

  • Slack: Slack IPO: Pros and Cons  
  • Lyft Lyft: Risky Valuation and No Intellectual Property
  • Uber Uber IPO: Record-Breaking For All the Wrong Reasons
Posted in Cloud Software, Cybersecurity, Financial MarketsLeave a Comment on CrowdStrike IPO: Price at 2x Addressable Market

Uber Stock Had Disappointing Q1 Earnings: So Why Did the Price Go Up?

Posted on June 13, 2019June 30, 2026 by io-fund
Uber Stock Had Disappointing Q1 Earnings: So Why Did the Price Go Up?

Uber’s CEO, Dara Khosrowshahi, is blaming timing and the trade war for the stock’s poor performance in its public market debut rather than focusing on the company’s unprofitability. When Uber filed to go public, the S-1 filing showed a massive operating loss of $3 billion per year. The most recent earnings report on May 30th showed the losses are getting worse at $1 billion per quarter for the “deeply unprofitable” company. Revenue is slowing down with growth of 20 percent to $3.1 billion in the most recent quarter compared to 25 percent revenue in the year-prior quarter. This was Uber’s slowest growth since it began disclosing results in 2017.

Meanwhile, Uber stock has received a unanimous buy rating from financial analysts and many positive press headlines. This analysis will look closer as to why the current stock price does not reflect the clear evidence of diminished value as of the Q1 earnings report.

Uber Stock: Prospectus and S-1 Filing

If you’ve read my previous analysis on Uber’s IPO and Lyft’s IPO, then you can skip this section on the prospectus and S-1 filing. Notably, I provided accurate predictions on both of these public offerings before the market knew how the companies would perform – and I was very clear on the risks around these two stocks prior to Lyft dropping 20% from its IPO price and Uber stock becoming the worst IPO performance in history.

My newsletter subscribers get this information first. Sign up My newsletter subscribers get this information first. Sign up here.

In years prior, Uber’s prospectus points towards “an accumulated deficit of $7.8 billion” in the years ending December 31, 2017 and 2018. In 2017, Uber posted $4 billion in operating loss and negative $2.6 billion in adjusted EBITDA with losses of about $3 billion in 2018. This upcoming year of 2019, Uber is on track to reverse backwards on operating losses to the $4 billion mark with no improvement in profitability despite demanding a large cap valuation.

Notably, for anyone glancing over the prospectus, Uber sold some operations in Russia and Asia, which provided one-time income, and caused the company to post $1 billion in net income. This is why net income should be ignored when looking at the financials as it does not reflect the operating income or adjusted EBITDA.

Uber’s Core Platform Contribution Margin also worsened, dropping from negative 3% in Q4 2018 to negative 4.5% in Q1 2019 (most recent quarter not shown on the graph below).

Uber states that the reason the Core Platform Contribution Margin goes through periods of decline is due to competition in ridesharing. As my previous analysis pointed out, Uber has to subsidize rides in order to drive demand. This causes artificial supply and is the primary risk for investors.

Uber Eats is mentioned often in earnings reports and in the press. To be clear, Uber Eats only contributed $165 million in adjusted net revenue in Q4 2018 compared to ride sharing at $2.3 billion in adjusted net revenue; which again, the ridesharing is what places the profitability in question.

Evidence That Uber Stock Price is Too High

The primary risk of the ride-sharing business cannot be offset by new ventures, although the company has attempted to offset these losses by lumping users from Uber Eats and Uber Freight into a “platform.” These native apps are not a platform; this is a loophole to hide the numbers on ride-sharing as Uber Eats likely has a healthy user base, totaling $7 billion in sales annually.

Uber and Lyft subsidize rides which is why revenue grows and losses accelerate. The more business these companies do, the more money they lose. We do not know the true cost of ride-sharing as customers are not paying fair market value, and instead venture capital dollars are providing a cheaper ride than what supply and demand dictates. This is essential to understanding the metrics pictured below.

Mobile applications typically break down a few key metrics for investors to analyze. Uber does not offer monthly active users or daily active users. The company focuses on gross bookings, which is at a staggering $50 billion gross bookings annually, although this does not address why there are also staggering losses.

Data can easily be presented in favorable terms, and therefore, more than one source is recommended when drawing conclusions. In February, Adam Blacker of Apptopia, a provider of app intelligence, wrote a blog on various modes of transportation and estimated “decreases in active usage for Uber and Lyft, while seeing increases in public transportation.” The article goes on to state “From January 2018 to January 2019, Uber and Lyft lost a combined 1.2 million average DAUs in the United States.”

The majority of the DAU loss would have come from Uber due to the relative size of the company compared to Lyft, therefore, we can generously assume Uber lost 600,000 DAU, or about half the amount Apptopia reported. According to other sources, Uber completes about 14 million trips per day, so losing 600,000 DAUs is substantial as it represents a minimum loss of about 5% (this percentage of DAU likely higher as not all 14 million trips come from DAUs).

Former Uber growth marketer, Andrew Chen, has pointed out that DAU and MAU for Uber is not a meaningful number as infrequent airport rides are a strong driver of revenue growth, for instance, and these users are not reflected in DAU or MAU.  However, when looking at past DAU compared to current DAU, this is a very meaningful number as it shows us relative churn and retention.

Uber Stock Lock-up Expires in November – Mark Your Calendar

If the S-1 numbers show massive losses of $3 billion and the Q1 earnings reports even worse losses of $1 billion per quarter, then why is Uber stock trading higher? My theory is that just like bitcoin, Uber has whales keeping the price steady until the lockup period expires. Before either ride-sharing company went public, I emphasized both IPOs would be liquidity events and to be especially cautious of the press, as PR is a cheap expense to protect the $60 billion that has been sunk into this startup. 

When Uber’s lock-up expires in November, the true valuation of Uber will surface in the months that follow. It can take up to two years for a public offering to settle after the lock-up period. While I do not expect an immediate dump on day one of the lock-up expiring in November, I believe there will be a noticeable unwinding in the months that follow. As more shares become available, the stock price will undergo dilution. If you think I’m wrong about the overall fundamentals, and you want to invest in Uber and Lyft, I would urge you to wait beyond the lock-up.

Check out my analysis on Zoom published prior to the IPO, where I called it the Best Silicon Valley IPO of the Year.

Posted in Consumer Tech, Financial Markets, TravelLeave a Comment on Uber Stock Had Disappointing Q1 Earnings: So Why Did the Price Go Up?

Slack IPO: Pros and Cons

Posted on June 6, 2019June 30, 2026 by io-fund
Slack IPO: Pros and Cons

June 20th is the official date of the Slack IPO, although the technical term is not an IPO but rather a DPO for Direct Public Offering. Of the cloud software companies to go public over the last few years, Slack may be Silicon Valley’s pet favorite. You can think of Slack as a cloud-based messaging and delivery hub for teams as email is ineffective for frequent communication and projects. The product is simply amazing in terms of productivity and team work flow. From a customer perspective, the cost of the paid product is offset by the time employees save by eliminating collaboration friction such as long email threads and lost files. With that said, there will be plenty of product bias on this stock from Slack power users.

Prior to the Slack IPO (or DPO to be exact), I had cautioned that cloud software is pricey right now and is breaking records from the dot-com era on price-to-sales ratios. Cloud software has carried the Nasdaq rally from December lows with some cloud software stocks seeing 100% returns compared to 13% on average from mega-cap FANG stocks over the last six months.

IPOs in the cloud software category have been especially rewarding over the last two years with PagerDuty, Okta, Twilio, Zoom and a few others trading at triple percentages from their IPO price. By simply breathing the same air as the cloud software vertical, Slack is likely to see a healthy bump when the company officially begins to trade. Notably, Class B shares are trading privately between $21 and $31.50 over the past four months with a volume weighted average of $26.38, which represents a 142% increase in value from the last private valuation of $7 billion in August of 2018.

Keep in mind, we saw the fragile ground cloud software companies are on with Zuora, which reported disappointing earnings resulting in an overnight loss of 30% in value with stock price dropping from $20 to $14 on May 31st.

Setting aside my affection for Slack (I’m logged in on two separate accounts as I write this), there are a couple of issues that require more visibility. One paramount issue is that direct listings are risky as there is no lock-up period and this didn’t go well for Spotify. The financials also reveal paid users are decreasing even though paid accounts over $100,000 are increasing. Ideally, these two metrics would both be in an uptrend. Net dollar retention rate is strong with Slack, although it has the benefit of being a fairly young company with the product having launched in 2014, and this puts the retention rate in Slack’s favor compared to prior IPOs in the same category.

You can read my analysis on Spotify here – which also had a direct listing.

1. Slack IPO Pro: The Product is Awesome

First and foremost, Slack is an exceptional product in a high-growth category and has a loyal user base. Slack currently holds the title of fastest-growing SaaS startup in history. Enough said.

2. Slack IPO Con: Direct Listing

Slack is not looking to raise money, and has chosen a direct listing as opposed to a traditional initial public offering. This means insiders will initially sell their stock and there will be no lock-up period. Eliminating the lock-up period creates even more risk than usual compared to traditional IPOs that have six-month lock-up periods.

There is quite a bit of information about Slack’s direct listing available, as well as Spotify’s direct listing, and therefore, I will not go into an exhaustive analysis of the pros and cons (there are primarily cons for public market investors). You can read my analysis on Spotify stock here when I said the stock was too high at $185 and is now priced at $127.

The issue with a direct listing for Slack is that the company should be raising money with the level of competition the company is currently facing from Microsoft globally (Microsoft is technically in the lead, according to Gartner and a few other sources). In addition, Slack has partnered with other collaborative cloud software products, such as Atlassian and Oracle, but both of these companies are much larger than Slack and are able to copy what Slack offers.

Slack has 10 million customers which is not much considering Microsoft is already in the lead and some startups may nip on their heels such as Asana. In addition, we see in the financials that Slack’s cost of user acquisition with around 50-60% of revenue spent on sales and marketing over the last two years. If this number is not improving, then Slack should be raising money to expand its reach.

3. Slack IPO Con: Net Losses Not Improving

Slack’s prospectus reports “good enough” financials that will satisfy most growth investors. Revenue grew from about $105 million in 2017 to $220 million in 2018 to $400 million in 2019 representing growth of 110% and 82% respectively. International represents one-third of the revenue. The net losses were relatively flat, ranging between $138 million to $146 million for all three years, although Slack’s prospectus states the “net losses have been decreasing as a percentage of revenue over time as revenue growth has outpaced the growth in operating expenses.” This is true, but the decrease in operating expenses is due to cutting back on R&D as a percentage of revenue rather than sales and marketing. Relative to revenue growth, we see that the cost of acquisition remained the same with sales and marketing at about 64% of revenue in 2018 and 58% of revenue in 2019. As pointed out above, Slack should be spending on R&D to remain competitive in the cloud collaboration space.

On June 3rd, Slack released an updated prospectus that does not show any improvement in the net losses although the revenue grew to $134M in the most recent quarter compared to $80M in the year-ago quarter. In fact, the net losses of $38M in the most recent quarter are higher than the year-ago quarter of $26M.

Notably, according to the updated Prospectus, Slack shows growth in customers over $100,000, yet shows a decline across all paid user growth from 9,000 in the year-ago quarter compared to 7,000 in the current quarter. In other words, there is a divergence as overall paid users are declining while customer accounts over $100K is growing with the current quarter growing 24% compared the year-ago quarter. More quarterly earnings will be needed to determine which direction this will ultimately go.

4. Slack IPO Pro: Net Dollar Retention Rate

Slack provided limited key metrics in the S-1 filing although the company did provide net dollar retention rate. Net dollar retention rate depicts what percent of revenue from current customers is retained from the prior year, after accounting for upgrades, downgrades and churn. The formula for net dollar retention is:

Beginning of period revenue + upgrades – downgrades + churn = y with y / beginning of period revenue

If net dollar retention is above 100%, then the growth from the existing customer base offsets the losses. If the number is below 100% then downgrades and churn exceed growth.

Slack’s Net Retention Rate at 143% is very good and outperforms most cloud software IPOs that provided this number in the past. As mentioned in the introduction of this analysis, Slack has power users and a loyal brand following, which is reflected in the retention rate.

One thing to note about the retention rate is that Slack officially launched in 2014, and has a shorter history than other companies on this list with many having launched ten years prior to IPO. Typically, the longer the time period, the lower the net retention rate due to customer stabilization.

Conclusion: Slack will likely make a good trade due to brand appeal, traction and the current strength of cloud software in the market. The company knows how to make the financials look good by reducing R&D and maintaining similar levels of user acquisition as the year prior. For a long-term trade, I’d wait to see if the net losses improve and if Slack can prove that a direct listing was the best thing for the longevity of the company rather than in the best interest of the insiders. For Spotify, a direct listing did not fare well for early investors (including George Soros). With that said, Slack has stronger fundamentals than Spotify and is likely to be a very hot IPO. Follow me for updates, as the total addressable market for cloud collaboration is at $24 billion and with one or two strong quarterly earnings reports, Slack could transition from a solid short-term trade into a solid long-term holding.

Posted in Cloud Software, Financial Markets, ProductivityLeave a Comment on Slack IPO: Pros and Cons

Pinterest Stock: Price-to-Sales Risky

Posted on May 16, 2019June 30, 2026 by io-fund
Pinterest Stock: Price-to-Sales  Risky

Despite Pinterest’s stock climbing from its initial public offering last month, analysts are expecting a first-quarter loss of 16 cents a share, adjusted, compared to a 10-cent loss in the year-ago quarter. With that said, analysts are expecting revenue of $197 million, reflecting growth of 50%, however there are discrepancies between the user base that is growing and the user base that is monetizing, which is what is causing the losses.

Last month, I wrote an article on how mobile application companies hide user attrition and how Pinterest and Snap bury important key metrics in 10-Ks and S-1 filings. One thing I stated is that financials in tech companies can be misleading when not accompanied by scrutiny of the underlying business.

The key metrics to watch for when evaluating Pinterest stock include monthly active users (MAU), daily active users (DAU) and average revenue per user (ARPU). I’ll review some information here from my last analysis before I go into why Pinterest is seeing an increase in revenue yet a slight decrease in net income.

Pinterest Stock: Company Struggles to Monetize International Audiences

Thus far, Pinterest has struggled to monetize global users. The difference in average revenue per user (ARPU) in the United States compared to the global users is astonishing – and uncommon for social media. We see the United States users monetize at $9 average revenue per user while the international users monetize at a mere 25 cents per user. This is what the graph looks like:

The user growth in the United States shows saturation in previous quarters with flat to declining growth between Q1 2018 to Q4 2018. This means the areas where there actually is user growth (international) does not contribute to profits as the costs of operations likely exceeds 25 cents per user annually. Facebook’s international ARPU is currently at $7 and has never been below $1.50 as a public company even with the stock struggled in 2012. Twitter has seen below $1 international ARPU as reported in 2017 but was also hovering at 5 price-to-sales during some of this time period compared to Pinterest’s 20 price-to-sales (more on this below).

Meanwhile, Snap which is a more direct comparable as both companies are newer to the public markets, shows nearly 1500% more ARPU in the Rest of World region. Yes, you read that right – 1500% with 9 cents from Pinterest ROW compared to $1.24 ROW.

This helps complete the issues Pinterest faces globally as the user growth is coming regions which result in losses. I believe this may be the culprit as to why Pinterest is expected to post 50% revenue growth yet slightly higher losses from -10 cents per share to -16 cents per share. You’ll see below that the United States has stagnated.

According to data from Apptopia, a provider of app intelligence that partnered with Bloomberg in February, Pinterest downloads in Brazil surpassed United States downloads for the first time on Android. This gives us a glimpse as to where the user growth is coming from; which are regions that create a loss.

The information above means investors are doing one of the two:

  1. Betting the United States will monetize higher than $9 per user
  2. Betting the global audience will monetize higher

My best guess is that number one is likely to occur while number two will present a challenge. The issues here are surmountable and we may see some progress here in the next earnings report; however, I do not believe we will see enough from this quarter’s earnings to justify Pinterest’s stock price due to the flat United States base and the lack of revenue coming from the international base. This leads me to ask how overpriced is Pinterest stock?

Pinterest Stock Trading 30-50% Too High

Pinterest’s IPO stock price was originally $15-$17 and went public at $19. My analysis points to this pricing being correct while the current trading price of $28.50 at time of writing is 30-50% too high due to the constraints of social media valuations.

With total revenue at $775 million in 2018 and a market cap of about $15 billion, Pinterest stock is at a 19.3 price to sales ratio. When adjusted for 50% revenue growth this quarter, Pinterest will have about $100 million more in revenue for the past twelve months, which puts the price to sales at 17.14 – if the price remains the same. If investors run up the price after earnings due to revenue growth, we will be right back where we were with a 19 or 20 price-to-sales ratio. This will be on revenue of about $197 million with 50% growth same-quarter YoY.

Meanwhile, Facebook is at 8.8 price-to-sales with 26% same-quarter YoY revenue growth at $15 billion per quarter, Twitter at 8.8 price-to-sales with 20% same-quarter YoY growth on $787 million quarterly revenue and Snap with 39% same-quarter YoY growth on $320 million quarterly revenue at 10.8 price-to-sales.

Historically, Facebook did trade at a price-to-sales above 15 between 2013 and 2016, however, we see that the time period when Facebook was able to command a price-to-sales above 15 was when the company had crossed 1.2 billion monthly active users and was growing towards 2 billion monthly active users. At that time, the company posted 63% YoY growth with $1.5B to $3.0B in profits. With this user base, Facebook is an outlier. Pinterest’s stock is a better comparable to Twitter and Snap with all three social media companies having users in the 270-325 million monthly active user range, with Pinterest being the smaller user base of all three.

Twitter’s price-to-sales history has also been at a high price-to-sales ratio over 15 when posting over 75% growth (Pinterest is expecting growth at 50%). Even with solid growth, Twitter’s price-to-sales did not last long at the 15-20 range and the price was down nearly 50% within two quarters. The second time Twitter tried to get above 10 price-to-sales in early 2018, the price again corrected the following quarter to below 10 price-to-sales.

Snap has met a similar fate of having a short-lived price-to-sales above 15 before correcting to 10 or below where it has been for the last few quarters. Again, the correction in price-to-sales happened despite Snap reporting 50% YoY quarterly growth.

Takeaway: Do you remember Twitter at $50? Snap at $20? Pinterest at $28-$30 is kinda like that. Social media companies with a 10 or higher price-to-sales ratio have not fared well in the immediate quarters that followed with both Twitter and Snap seeing their value cut in half when reaching the price-to-sales where Pinterest is at today.

The market has created a valuation that will be hard for Pinterest to live up to. Pinterest priced correctly at the IPO as I believe the price should be in the $15-$19 range as this would be in the reasonable 8-10 price to sales range. Even if Pinterest beats expectations and we see a bump up in price, I stand by my analysis that the stock’s price-to-sales is 30%-50% too high – and the valuation will be short-lived.

Posted in Financial Markets, Social Media, Tech StocksLeave a Comment on Pinterest Stock: Price-to-Sales Risky

Uber IPO: Record-Breaking For All the Wrong Reasons

Posted on May 9, 2019June 30, 2026 by io-fund
Uber IPO: Record-Breaking For All the Wrong Reasons

By now, investors know that Lyft’s ride-sharing IPO didn’t reach $100 per share like many of the media talking heads stated it would, and this will likely weigh on Uber’s IPO. Two weeks prior to Lyft’s IPO, I had warned that the risk listed in the prospectus, which warned Lyft may not become profitable, was more than fine print. Ride-sharing companies use investment money to lower the cost of the ride to create demand, which means the ride you take in a Lyft or Uber is not profitable, and will likely never be profitable.

Not one analyst rated Lyft as a sell going into earnings despite earnings estimates that called for accelerating net losses from negative $3.16 EPS to negative $3.97 EPS. Going into earnings this week, twelve analysts had rated Lyft as a buy compared to eight who rated it as a hold (What is wrong with these analysts?!).

With the most recent earnings, we have confirmation that my analysis, which detailed why Lyft can increase revenue yet cannot stop the losses, was accurate with expectations of an estimated $1.1 billion in losses this year.

Reuters published in 2015 that Uber passengers pay only 41 percent of the actual cost of their trips. At the time, Reuters warned that this creates an “artificial signal about the size of the market” when Uber released limited financial data that showed losses of $708 million per quarter. Four years later, little has changed.

How Uber’s IPO Compares to other IPOs:

Uber is an IPO that has been covered extensively. You may have heard comparisons of Uber’s IPO to Facebook or Alibaba. Uber is raising $9 billion in this week’s IPO, Facebook raised $16 billion in 2012 and Alibaba raised $25 billion in 2014. Facebook and Alibaba are both doing great, seems to be the logic OR many tech companies are not profitable at the time of IPO is another costly mistake when comparing Uber to other IPOs.

Of course, these “big tech” comparisons don’t tell the whole story. Facebook had $1.75 billion in operating income, and $1 billion in net income in the year prior to the 2012 IPO. Alibaba had $1.7 billion in operating income, $1.3 billion in net income, and $2.6 billion in adjusted EBITDA in 2013, the year prior to its IPO. To compare, Uber has a $3 billion operating loss, and negative $1.8 billion adjusted EBITDA.

Notably, for anyone glancing over the prospectus, Uber sold some operations in Russia and Asia, which provided one-time income, and caused the company to post $1 billion in net income. This is why net income should be ignored as it does not reflect the operating income or adjusted EBITDA. To summarize, Uber’s prospectus points towards “an accumulated deficit of $7.8 billion” in the years ending December 31, 2017 and 2018. The year prior (2017), Uber posted $4 billion in operating loss and negative $2.6 billion in adjusted EBITDA.

Chicken and the Egg – Both Broken:

Most investors know there have been numerous lawsuits against Uber with many examples listed on page 28 of the prospectus. Here is a sample of what it says:

“We are involved in numerous legal proceedings globally, including putative class and collective class action lawsuits, demands for arbitration, charges and claims before administrative agencies, and investigations or audits by labor, social security, and tax authorities that claim that Drivers should be treated as our employees (or as workers or quasi-employees where those statuses exist), rather than as independent contractors.”

This paragraph is followed by a list of class action lawsuits and state-level Supreme Court rulings that Uber has been involved with and the various legislation or judicial decisions that could have an adverse effect on the business and financial condition of the company.

Although being sued often comes with the territory for disruptive startups, this is unique as the work force is going on strike during the IPO (this is not a competitor suing over intellectual property, etc). The drivers and customers are a chicken-and-egg scenario and Uber struggles to pacify both to successfully operate. On one hand, Uber is subsidizing rides at up to 60% to lure the customers, and on the other hand, the workers are retaliating. This is not a good formula. Most importantly, Uber has no profit to absorb a change in business model, such as being required to pay minimum wages or health care.

Here are some charts:

If you need some charts, to prove what I’m saying, there is an overabundance of charts that show the issues Uber has with subsidizing rides “to create artificial signals about the market” (Reuters words, not mine).

Core platform is the margin Uber generates after direct expenses. As the prospectus states, “Core Platform Contribution Margin is a useful indicator of the economics of our Core Platform, as it does not include unallocated research and development and general and administrative expenses.” Here is what the margins look like:

uber core platform contribution margin

The reasons Uber states the Core Platform Contribution Margin goes through periods of decline is due to competition in ridesharing (translation: Uber has to subsidize rides to remain competitive) and they also state it’s due to planned investments in Uber Eats. The problem is that Uber Eats only contributed $165 million in adjusted net revenue last quarter compared to ride sharing at $2.3 billion in adjusted net revenue, and therefore, the majority of the decline is likely due to the issues I stated above (rides are priced too low for profits but price of rides must remain low for demand).

Here’s another chart that shows you what it looks like when a company subsidizes purchases with the capital it has raised.

relationship between demand and profits - Uber

And here’s another one – perhaps the most critical as it shows the relationship between sales and profits:

ridesharing profits

As sales go up, gross bookings per trip goes down. This is a good indication that the business model requires the price of the ride to remain below fair value in order to drive demand. Although some reporters and analysts like to talk about Uber Eats, the issue is that Uber is valued at $90 billion+ and Uber Eats is a very small percentage of revenue. You can’t conclude that Uber Eats is a good investment opportunity as it makes up about 5% of Uber’s revenue and this won’t absorb the ride-sharing losses.

Notably, the chart which shows the unprofitable relationship between ridesharing trips and ridesharing gross bookings per trip is on page 106 of the Prospectus. On page one, we are presented with a sky-rocketing hockey stick chart based off the number of rides Uber has booked from 1 billion in March 2016 to 10 billion rides today. This 10x chart doesn’t tell the whole story like the charts above.

AVs – Long Ways Off:

This is where the story gets even more risky as the solution to the upset drivers is that these drivers will not be needed soon due to autonomous driving. Any company who is publicizing autonomous driving right now as a near-term way of driving profits is a good company to run from – and quickly.

We saw Lyft use this tactic to distract from their disappointing earnings this week with PR timed to the earnings report that “Waymo and Lyft partner to scale self-driving robotaxi service in Phoenix.” On closer look, Waymo will only add 10 vehicles to the Lyft app in their Arizona testing sites in Phoenix.

That aside, let’s go into the time machine for a minute to revisit stock prices relative to important product releases. Apple was priced at $11 in 2009, two years after the iPhone came out, and was priced at $35 in 2010, when the economy was doing a little better. Facebook was priced in the $25 range for years after they pivoted to a native mobile app and launched Messenger, both of which greatly contributed to the data collection and ad targeting that drives ad revenue today. Amazon was priced under $100 for nearly three years after the company launched AWS.

Point being, not only are autonomous vehicles a long way off from being commercially deployed to the public and able to generate profits, (and there is a ton of competition), but to invest in tech before it hits the market is high-stakes speculation. There is not one example where it made sense to invest in the company years before a tech product was released. Meanwhile, there are many examples where the stock price and valuations were low even after profitable products had gained traction. I’m not saying you want to be late to the market for AVs, rather I’m saying it can be just as costly to be this early – especially with companies that have ten digit losses.

Note: If you’ve read any of my previous analysis, you’ll know that I’ve been writing about the realities for autonomous vehicles for awhile now and how this does not match investors’ expectations. I won’t repeat my AV bubble thesis here but you can read quite a bit of this under my profile.

Don’t Get Duped on Uber IPO:

Sometimes investors get it wrong. We see this on the public markets frequently when a legendary investor goes all-in at the wrong time or a darling stock has a sudden drop. Well, guess what? Private investors get it wrong too sometimes. And the venture capitalists who invested in Uber and Lyft really got it wrong with ride-sharing. Their eyes lit up with the promise of a serviceable available market (SAM) and total addressable market (TAM) that would replace personal car ownership around the world. User growth is phenomenal and the brand is ubiquitous. VCs kept fueling more and more capital into the leaky ride-sharing business model and something prevented these VCs from using discipline to require proof of the following:

Question: will charging below a fair market price and subsidizing rides at up to 60% create a profit margin? Answer: No

Question: if we charge a fair market price to stop the losses, will there be enough demand? Answer: No.

The ride-sharing business model as we know it today will never be profitable. Meanwhile, the venture capitalists who bought into the world’s most valuable startup want their money back. Do you want to donate to the “pay VCs their $90-$120 billion” charity cause? If so, shares will be available Friday.

Posted in Consumer Tech, Financial Markets, TravelLeave a Comment on Uber IPO: Record-Breaking For All the Wrong Reasons

Update on $ROKU – Will Roku Miss Earnings?

Posted on May 8, 2019June 30, 2026 by io-fund
Update on $ROKU – Will Roku Miss Earnings?

Will Roku miss earnings? I believe Roku will miss earnings at times, but for the big picture, Roku is at the center of an important trend in advertising and this will make for decent returns now and sizable returns in the future. I also don’t play the earnings game often with stocks as my analysis does not change monthly or quarterly. My conviction on Roku is high and can withstand trade war news or a fledgling quarter, which is normal for smaller companies on the edge of incipient trends.

What Investors Got Wrong With Roku

The first thing Wall Street got wrong with Roku is that investors thought Roku was a hardware player. Although it is clear now that the ad platform is what will drive the profits, this wasn’t evident in the financials for a few earnings reports. My three pieces of analysis in 2018 were the opposite; I made my readers aware the ad platform was where the growth potential was.

The second thing Wall Street gets wrong is assuming Google or Amazon can dominate over-the-top television because they are Big Tech and smaller companies don’t have a chance. Google struggles here and recently raised the prices on YouTube television to $49, which for the most part, negates the purpose of cord-cutting when you add a few subscriptions like Netflix or HBO Go, and end up at the monthly cost of cable. Amazon is pushing into ads for OTT, however, there will be privacy regulations to face as the data powering those ads is being brokered without consent from e-commerce and Prime purchases. You can ask Facebook how that is going for them.

Roku has all of the pieces to the stack. The hardware is a razor-razor blade model that locks in their ad-supported platform. They’re OTT-only, and this prevents privacy issues for the data they collect from the device (this is why Apple is always in the clear with privacy issues – data stay s on the device).

Also Read : Prediction: Here’s Why Roku Will Be The Next Tech Darling

Analyst Expectations Low for Q1 2019

Interestingly, the consensus EPS forecast for Roku is negative $0.24 compared to negative $0.07 same quarter last year with analyst expectations of declining growth. Meanwhile, Roku had posted EPS of $0.05 last quarter. Here’s a screenshot of Roku’s earnings per share vs. consensus:

TradeDesk is also a Connected TV advertising player and reports on May 9th with analysts expecting declining growth from the previous quarter with estimates at $0.07 per share.

With that said, advertising is driving record profits for many companies who have already reported this quarter, such as Facebook and Twitter. This is why I’m surprised (and don’t necessarily agree with) the low analyst expectations for both Roku and TradeDesk as these expectations of -$0.24 for Roku and $0.07 for TradeDesk are some of the lowest in these stocks’ earnings histories (1+ year or more).

Also Read : Roku Q3 Earnings: Choppy But Unshakeable Long-Term

My Opinion “Long on Roku Even if They Miss Q1 Earnings”

That was my headline last May in 2018 even though Roku did not miss Q1 2018 earnings. My stance on this stock remains the same. Roku is a core holding of mine because of the mega trend towards Connected TV advertising. To put it simply, and as I wrote before Q1 2018 earnings were reported, Roku beating or missing earnings is not my focus for a long strategy based on an important trend. I fully expect tech companies to miss earnings from time to time (this creates better buying opportunities). This won’t change my conviction that Connected TV advertising is on an important upward trajectory.

Here’s some more information on the Connected TV market:

“Two of the big trends in digital media aren’t compatible: The drive to enforce viewability standards and the shift to mobile, particularly apps.” – Digiday

Viewability issues are a serious issue for big brands who are averse to mobile in-app advertising because it’s too challenging to track. In addition, many big brands do not need immediate purchases which is called “purchase intent” – which is mobile’s main value over television.

For instance, Coca-cola doesn’t expect you to buy a soda immediately after seeing an ad. Audi doesn’t expect you to buy a car immediately either. So, a lot of the benefits of mobile aren’t worth the downside to these big brands. Advertising budgets shifted to mobile because they had to find audiences, not because it’s a superior method to advertise.

 Here’s how the two compare:

  • Pay TV has high completion rates as viewers are comfortable in their homes and better prepared to receive advertisements.
    undefinedundefined
  • Mobile offers audience data to better target viewers based on individual preferences.
    undefinedundefinedundefined

Connected TV advertising, which is Roku’s specialty, combines the best of both television and mobile. It offers 100% viewability and completion rates with the audience data and dynamic ad insertion found on mobile. Forbes covered this in a recent article which stated Ad Supported OTT is the future reporting OTT ads have a 97% completion rate and 100% viewability.

In a recent study by FreeWheel, 200 billion video starts found OTT ads had ballooned from 2% to 32% in a four-year period due to heavier investments from advertisers.

In the Q2 2018 Video Advertising benchmark study released by Extreme Reach, a tech platform for video ad campaigns, connected TV impressions overtook mobile, accounting for 38 percent of all video ad impressions down from 33 percent in Q1.

Also Read : Roku’s Stock Price: Will There Be Another Pullback?

Here’s a quote from Extreme Reach:

“CTV is clearly on the path to becoming the dominant platform for media consumption, and premium inventory is the most sure-fire audience draw.”

– Mary Vestewig, Senior Director, Video Account Management at Extreme Reach.

AppNexus, the world’s leading independent advertising technology company, announced in July of 2018 that advertiser spend in its connected TV marketplace grew 748% year-over-year versus the second quarter of 2017 and 68% quarter-over-quarter. AppNexus currently sees 20 billion monthly connected TV impressions per month.

From an investment standpoint, the implications of attracting more advertising dollars than mobile is enormous. Big brand budgets have been looking for a solution to traditional television that isn’t confined to the attention span and limited screen size of mobile viewers. With Roku, that option is finally here.

Please note: I’ve also covered TradeDesk, another stock doing well by capturing the Connected TV advertising trend. You can read that analysis here on FATrader and why the risks with TradeDesk have personally kept me from buying the stock although many of my readers have seen 400% returns on $TTD.

This analysis is not an earnings call. The purpose of this article is to revisit a few trends and predictions I made around this time last year in regards to Roku.

Posted in Ctv, Financial Markets, Media, Svod, Tech StocksLeave a Comment on Update on $ROKU – Will Roku Miss Earnings?

Why Robotaxis in 2020 Are Impossible and More Truths About Autonomous Vehicles

Posted on May 3, 2019June 30, 2026 by io-fund
Why Robotaxis in 2020 Are Impossible and More Truths About Autonomous Vehicles

This last week, we saw Tesla take advantage of the lack of information available on autonomous vehicle technology. Unfortunately, the facts around autonomous vehicles are elusive as PR copywriters fuel journalists, who are churning out content to meet deadlines.

For starters, to get machines to respond like humans, within milliseconds, is one of the most difficult problems that technologists have aimed to solve. The truth about autonomous vehicles includes regulations, production cycles, and delays in implementation. I predicted when I wrote my analysis six months ago, that the gap between investor expectations (perception) and commercial deployments (reality) had created an autonomous vehicle bubble that would pop in 2019.

One example is Intel, which has been propped up under hope that AV is close to deployment. “How Intel Plans to Win Self-Driving Cars,” is a headline published by Motley Fool and there are dozens of more like it. Meanwhile, six days ago, Intel laid off dozens from the autonomous vehicle program in Palo Alto.

In my updated analysis, I want to dive deep into the reality around autonomous vehicles, and draw some important conclusions as to why it is impossible to deliver robotaxis in 2020.  This will help investors and consumers understand a few basics around what needs to happen for full autonomy so that both constituents can make better, informed decisions. Investors should especially pay close attention because for the handful of companies who are overhyped and pushing for sky-high valuations too early, there are many more quality small cap and mid cap stocks that are underhyped and perfectly timed relative to valuation.

Truth Number One: Driver-Assisted Vehicles

We are at level 2 autonomy and all auto manufacturers are halted at this level. Tesla cannot release more advanced features than what Ford, Mercedes, or BMW have on the roads today. On that note, autonomy is a misnomer as Level 2 is considered “driver-assisted.”

Please note: I wrote about the disconnect between SAE’s AV levels and reality around commercial deployment long before it appeared in the press. My previous analysis is a must-read for anyone interested in more information on the AV bubble or AV software.

Here is an overview from my analysis published in October of 2018:

Level 0-1: No automation and driver assistance.
Level 2: Partial automation. The vehicle assists with steering and accelerating functions.
Level 3: Conditional automation: The vehicle controls the monitoring of environment using sensors. The driver’s attention is critical but the AV system runs the safety critical functions. Does not require human attention under 37 miles per hour
Level 4: High automation: Vehicle is capable of steering, braking, and accelerating, as well as responding to events and changing lanes. Vehicle cannot determine dynamic instances such as traffic jams or merging onto the highway.
Level 5: Complete automation. No human attention required. No need for pedals, brakes or a steering wheel. The AV controls all critical tasks, monitoring of the environment and identification of unique driving conditions like traffic jams.

Level 2 (where we are today) and Level 3 (where we might be in 2-3 years from now) are not considered autonomous. These levels are considered “driver-assisted.” Audi, not Tesla, was going to be the first to commercially deploy a Level 3 autonomous vehicle in January of 2019 with the Audi A8 Traffic Jam Assist, but has been delayed due to “foggy federal regulatory framework, infrastructural differences, and a lack of consumer understanding of self-driving technology.”

As of January 2019, any presentations on releasing Level 3 driver-assisted technology (again, the next level is not categorized as autonomous) would be remiss to not address the regulatory framework that is preventing deployment of Level 3 at this time. The presentation would also be remiss to not discuss why regulations would skip Level 3 and go to Level 4 – or as robotaxis would require, Level 5 commercial deployment.

Truth Number Two: AVs Heart 5G

5G was absent from Tesla’s recent presentation on autonomous vehicles, which is odd to say the least. 4G speeds are simply not fast enough for the sensors on a vehicle to react or brake in milliseconds. We need the network capacity of 5G for machines and vehicles to think as fast as humans, and to remove latency in critical moments.

On my podcast about 5G, I recently interviewed Anthony Pellegrino from a disruptive startup called Mutable, which provides edge computing for microdata centers. Microdata centers are miniature data center racks that enable faster, easier and a more cost-effective way to build and deploy applications at the network edge. Because 5G microdata centers will be more omnipresent, so to speak, and located closer to the device or vehicle, you can improve response time from 60 milliseconds to 20 milliseconds. In the case of braking for a pedestrian, these 40 milliseconds are crucial.

Pellegrino provided the following example in the podcast, “Think about Ford, if they want to do autonomous vehicles, are they going to put redundant compute literally in thousands of locations, or are they going to, when a car comes by in the neighborhood, and you’re connected to 5G, send a request across? You can just spin up an instance of these applications on demand, and use it when it’s needed … that’s very cost effective.”

At MWC in Barcelona this past year, a semi company called Einride, set up a simulator for autonomous driving that allowed attendees to demo driving an 18-wheeler from roughly 3,000 miles away. The speed was limited to 5 kilometers per hour for safety purposes andEricsson provided Einride with a 5G network for the successful simulation.

Although 5G has deployed in two cities, Chicago and Minneapolis, we will need the semi-ubiquitous presence of 5G for the commercial deployment of personal-use vehicles on public roads. For instance, one critical feature of 5G is that the signal from connected devices do not need to travel to a cellular tower first in order for vehicles to quickly send and receive information. One reason many auto companies are putting the next level of AV deployment at 2022 when many optional autonomous features will be released, is that 5G networks will be available. However, fully autonomous (without human driver) will still have serious hurdles as 5G is an urban technology rather than a rural technology – and privately owned robotaxis, without a human driver, deployed outside of urban areas is skipping many crucial levels and steps, that it should not even be discussed right now.

Keeping this in mind, we are more likely to see 5G-enabled autonomous transportation within urban areas for mass transportation before you or I have the ability to buy an autonomous vehicle from a dealership. China hopes to do this by 2022 through a partnership with Mobileye/Intel, Beijing Public Transport Corporation (BPTC), and Beijing Beytai.

China's autonomous bus transportation

Truth Number Three: Driverless is Prohibitively Expensive

Notably, there are vehicles that have all of the data onboard and do not need to communicate with IoT sensors or the cloud to brake or respond to obstacles. Caterpillar is currently operating driverless machinery today although these machines drive in areas where there are few unknown obstacles, such as pedestrians or bicyclists. However, self-driving with computing resources built into the machine or vehicle is prohibitively expensive today for personal vehicles and for most industries outside of the manufacturing industry or defense industry.

Historically, autonomous vehicle technology was first developed for the military to prevent deaths from roadside bombs. I spoke with Michael Fleming of Torc Robotics in a separate podcast interview, who has been developing AV software for the defense industry for over a decade, and is the software provider for the Caterpillar driverless machinery currently operated today.

Here is what Fleming said about the current state of AV software “Self-driving is a very difficult problem. It’s a very complex problem, but in reality, think of the software architecture as hundreds of different software modules all being interconnected, which is pretty incredibly complex. Now, we’ve been working in this space for over 12 years, and these complex technologies do not come together in short order. And for that reason, I think it’s important that the organizations take a slow and methodical approach to not only developing, but deploying self-driving vehicles.”

In the podcast, Fleming also pointed out that “defense vehicles and mining vehicles are a little bit more expensive than the consumer car that you and I would buy, so they can justify a higher price point for autonomy.”

Elon Musk is priming people to rent out their cars “while they sleep” because full self-driving that doesn’t rely on 5G edge computing will be too expensive to sell to consumers for personal use. This doesn’t address the more holistic issue which is the battery of the vehicle may not be able to handle autonomous workloads with reasonable battery life.

As Pellegrino pointed out, “So with autonomous vehicles, when you have cars, you can fill them up with batteries, and you can go from point A to point B. But the more compute that you have on the car, or servers that you have on these cars, the less you’ll travel because you’re now using that energy not just to move the car, but to make decisions.”

Truth Number Four: Very Little Differentiation Right Now

Tesla’s Autonomous Investor day revealed basically two things: the company has built an in-house AV chip and the company does not plan to rely on lidar sensors. Instead, Tesla will rely on cameras. Musk emphasized that the hardware was ready to deploy.

Keep in mind Waymo has had the hardware ready for nearly a decade and has already tested the hardware and software with over 10 million miles recorded, with a human driver on board to intervene when needed. Waymo will not be commercially deploying AVs for the public anytime soon because the software is the challenging part, and the AVs they are testing with beta testers in Arizona are confused by pedestrians and rain storms.

The cars released today with connectivity features have the computing power of 20 personal computers and feature over 100 million lines of programming code. Next decade’s semi-autonomous cars will have 300 million lines of code, and the distant future of fully autonomous will have 1 billion lines of code. The challenge is in the software – not the hardware.

Security is another challenge that needs to be solved before AVs can be commercially released to the public. This is because the electrical components in a car (known as the electronic control units, or ECUs) are connected via an internal network. The peripheral ECU introduces vulnerabilities such as the vehicle’s infotainment center, which means WiFi or Bluetooth can grant access to core systems such as the brakes and transmission.

Regarding AV-specific chips, Qualcomm has been doing some interesting things in the AV chip space with the Qualcomm 9150 C-V2X chipset solution launched in 2017 which enables C-V2X technology or cellular-to-vehicle everything. This is the technology of choice for China’s Intelligent Transportation System and Connected Vehicles, and Ford plans to roll out C-V2X in global fleets by 2022. C-V2X uses LTE networks to enhance driver safety by allowing vehicles and infrastructure to communicate (machine to machine communication), although 5G networks is where true autonomy can occur. C-V2X can offer direct communications outside of cell networks, although features are limited in this transmission mode, as ideally traffic lights and pedestrian crosswalks communicate with the vehicle rather than relying on the vehicle to discern these situations without IoT communication. Audi, Ford and Ducati motorcycles with C-V2X chips were on display this year at CES 2019.

Truth Number Five: Autonomous Vehicle Leaders Work Together for Public Safety

Companies developing AV technology are being irresponsible if they are not working together for public safety before they work towards individual company gains. We’ve recently seen what can happen when a veteran like Boeing rushes the deployment in transportation. Today, there are 6 million auto collision per year in the United States and 2 million permanent injuries. The risks are too great to rush deployment for AVs, and a company acting alone can become the target for lawsuits and negative sentiment following the first high-profile accident.

At CES 2019 this year, a new coalition called PAVE was formed which stands for Partners for Automated Vehicle Education. The purpose of PAVE is “to bring realistic, factual information to policymakers and the public so consumers and decision-makers understand the technology, its current state and its future potential – including the benefits in safety, mobility and sustainability.” The partnership list is lengthy and includes Audi, Daimler, General Motors, Toyota, Waymo, Volkswagen, Nvidia and Intel.

Notably, Tesla is missing from the list of Autonomous Vehicle Education (PAVE) participants.

Conclusion:

Rather than write a new conclusion, I’ll copy what I had written in October of 2018, as my analysis written then is even more pertinent today.

“Short sellers of Tesla this year and last year may have been basing their calls on the CEO’s behavior but we are now about to enter major technology road blocks and consolidation that unbiased analysts predict will put even the highest performing AV companies to the test – which many low performing AV companies will not survive. The current shorts [October 2018] are not wrong, they are simply too early in the maturation process for AVs and [the shorts] have had a bumpy ride because of this.

Telsa shorts were right but their timing was off. We are in a Level 2 AV bubble, and it will burst as Level 3 and Level 4 experience growing pains (lots of cash has poured in with too high of expectations on when AV will start to turn a profit). Tesla, a luxury electric car company, will struggle greatly in the competitive hurricane for reliable and safe automation. Therefore, I’m considering a short on Tesla in 2019 or 2020, which I plan to time with the AV bubble bursting.”when AV will start to turn a profit). Tesla, a luxury electric car company, will struggle greatly in the competitive hurricane for reliable and safe automation. Therefore, I’m considering a short on Tesla in 2019 or 2020, which I plan to time with the AV bubble bursting.”

As I posted on FATrader, I entered my short at $300 in early March 2019 based off my understanding of the AV bubble and expectations vs reality. It surprised me to see an Autonomous Investor Day scheduled and occur this month, as although it supports my thesis, it is also disappointing that the misinformation has reached this level.

My overall advice would be to question any company who is making big AV claims and to look for small companies who are designing a workforce around testing right now or supply a critical piece to the stack for driver-assisted and autonomous. Look for industries that can justify the high price for vehicles to carry AV load or look for pure plays in the 5G market at very low prices.

I am updating my analysis on Xilinx, which I consider a solid investment. Xilinx is well diversified in 5G, AVs and my favorite – AI and data centers. My original analysis called for a 20% pullback and we hit a 15% pullback this earnings season. I have not built a position in Xilinx yet but am patiently waiting to do so.

You can read my previous analysis on autonomous vehicles here:

Autonomous Vehicle Bubble:
The Level 2 Autonomous Vehicle Bubble
GM Stock Risky Due to Autonomous Vehicle Bubble
Why Apple Will Never Buy Tesla: Autonomous Vehicles 101
Autonomous Vehicles: Fact Vs. Fiction at CES 2019

Security in Autonomous Vehicles:
Top 5 Security Risks for Connected Cars
Cybersecurity in Connected Vehicles Becomes Safety Feature for New Cars

Posted in AI Stocks, Autonomous Vehicles, Financial MarketsLeave a Comment on Why Robotaxis in 2020 Are Impossible and More Truths About Autonomous Vehicles

Smoke and Mirrors: How Snap and Pinterest Hide User Attrition

Posted on April 23, 2019June 30, 2026 by io-fund
Smoke and Mirrors: How Snap and Pinterest Hide User Attrition

Social media companies today are using smoke and mirrors to hide an important key metric. I’m going to pick on Pinterest first because the social media company recently revealed these issues in its S-1 Filing, and meanwhile, Pinterest stock saw a 25% pop on the day of its public debut. To be fair, this 25% IPO pop pales in comparison to Snap’s 135% stock price increase from December lows.

My best guess is that investors are hoping for the next Facebook, or perhaps they aren’t reading beyond the financials, which are on page 13 of the prospectus, compared to the social media metrics located on page 70. This is one reason I recommend following an unbiased tech analyst, such as myself, to avoid reading long S-1 filings 

As important as the financials are to the value of the stock, they can be misleading when not accompanied by scrutiny of the underlying business. For example, there are a couple of terms that are important to social media growth. I italicized growth because I presume investors will demand growth at both Pinterest and Snap’s outsized valuations. The first is monthly active users (MAU) or daily active users (DAU). The second is average revenue per user (ARPU). On the surface, Pinterest has healthy MAU numbers with 265 million monthly active users in the most recent quarter. For comparison, Snapchat has about 300 million MAU and Twitter has just over 325 million as of Q4 2018.

In regards to ARPU, a company with a healthy metric would be Twitter, for example, which has an average revenue per user (ARPU) of $9.48 and the revenue is split roughly 50/50 between international users and domestic users in the United States. For instance, in the most recent quarter Q1 2019, Twitter generated $317 million globally and $363 million in the United States. Contrast this with Pinterest and Snap with ARPU in the $2-$3 range. Investors in both Pinterest and Snap are speculating these social sites can increase ARPU significantly – meanwhile, there are issues of attrition in Pinterest’s and Snap’s user base.

(See more on Snap below, which reports earnings today.)

PINTEREST – CAN’T MONETIZE GLOBALLY

One issue with looking at ARPU holistically is that not all regions are created equal. This is especially true for monetizing on mobile. The United States spends a lot of money on social media compared to other regions, while Europe spends a reasonable amount of money. Other regions, such as India, spend very little money and can actually cause a social media company to lose money as providing a free service to users who do not monetize well – by advertising or purchases – creates low to negative operating margins. (You may be able to tell that I am foreshadowing here.)

Pinterest has monetized the United States beautifully. The 80 million or so users in the United States generate $9 average revenue per user. We see evidence this is saturated, however, as the user growth has been stagnant for many quarters.

Venture capitalists like to see 10% month-over-month growth with mobile application users or website users. (Actually, the prefer to see 30% month-over-month growth). Pinterest has struggled to achieve 10% year-over-year growth in the United States with some declining quarters.

However, Pinterest has achieved a 10% QoQ benchmark globally – and this graph looks much better. But there’s a catch …

Here’s the problem. The international audience doesn’t monetize. The regions where Pinterest is growing are only monetizing at 25 cents per user annually, which is not enough for a profit margin let alone an operating margin.  Compare this to the $9 average revenue per user in the United States, and you can see why the average ARPU for Pinterest drops significantly to $2-$3 annually.

To put it simply: the high average revenue per user regions have flat to declining growth (United States) of 80 million to sometimes 75 million, while the regions with adequate growth are not contributing to profits. If you are invested in Pinterest, you are either:

  1. Betting the United States will monetize higher than $9 per user – which is possible as Facebook is peaking at $26-$28 per user but all other social media platforms have hit a ceiling at $9 per user. (Facebook also uses data in questionable ways, which I’ve covered extensively from an ad-tech level, and California has numbered those days by passing laws for 2020).
  2. Betting the global audience will monetize higher

In the last quarter, the global audience contributed $17 million to revenue compared to $273 million from the United States audience. Annually, this puts the global audience at $41 million in revenue and the United States at $715 million in revenue.

Takeaway on Pinterest: On one hand, you could congratulate Pinterest on monetizing the United States users very effectively – although I am not certain how much more they can squeeze out of this audience as the user growth has stalled. I like to keep things fairly simple – if the numbers don’t add up, then I don’t invest. In this situation, the average revenue per user (ARPU) of the growing audience (global) is too low to turn a profit at 25 cents ARPU and the audience that is monetizing (United States) is stalled.

SNAP – FLAT TO DECLINING USER BASE

My thoughts on $SNAP:

Snap is priced to perfection as the “largest U.S. company to have more than doubled in 2019” with a rise totaling 135% in the last six months from a low of $4.99 on December 21stto $11.75 going into earnings. The speculation around this stock is in sharp contrast to the declining user base from previous quarters in 2018.

You’ll see below that the user base has struggled to break out over 191 million daily active users and has declined to flat for three straight quarters. Meanwhile, the stock has outperformed the S&P 500 10x in the last three months. It bears mentioning the business of social media is virality and engagement, and therefore, the user base is a paramount metric.

On April 4th, Snap announced a programmatic offering called Audience Network, which copies Facebook’s strategy of selling user data for third-party ads across multiple applications (Snap even copied the name – that should be interesting for trademark attorneys). Snap’s Audience Network could revive revenue in future quarters, however, the user base will continue to be a problem as there is a competitor from China, TikTok, that is taking market share of the Millennial audience. For specific months last year, such as September 2018, TikTok beat Facebook, Instagram and YouTube as the number one downloaded app.

Keep in mind, Snap’s user base is more transparent for analysis purposes than Pinterest, as the latter hides their stagnant domestic growth with 25-cent global growth. Overall, attrition in the regions driving revenue typically doesn’t make for a good investment in mobile or internet companies where audience is everything.

Regarding Snap’s earnings today, I’d keep a close eye on the declining to flat user base – regardless if they beat or miss on revenue. In the future, Snap’s Audience Network may help revenue quite a bit, but it will be short lived as California passed the California Consumer Privacy Act that go into effect in 2020 – more on this later.

Update: On April 23rd, 2019, Snap reported 190 million DAU which is a 1 million user decline from year-ago quarter of 191 million DAU. 

Posted in Applications, AR, Consumer, Financial MarketsLeave a Comment on Smoke and Mirrors: How Snap and Pinterest Hide User Attrition

Posts navigation

Older posts

Recent Posts

  • The IPO Glut of 2020: Why Valuations Have Gone Too Far
  • Zoom Discusses Two Important Catalysts In Q1 Earnings
  • Three Risk Management Tools the I/O Fund Offers
  • Micron Is Up 900%. Here’s Why the AI Memory Trade May Still Have Room to Run
  • Credo: Reliability Leader Aggressively Moves into Optics

Recent Comments

No comments to show.

Archives

  • June 2026
  • May 2026
  • April 2026
  • March 2026
  • February 2026
  • January 2026
  • December 2025
  • November 2025
  • October 2025
  • September 2025
  • August 2025
  • July 2025
  • June 2025
  • May 2025
  • April 2025
  • March 2025
  • February 2025
  • January 2025
  • December 2024
  • November 2024
  • October 2024
  • September 2024
  • August 2024
  • July 2024
  • June 2024
  • May 2024
  • April 2024
  • March 2024
  • February 2024
  • January 2024
  • December 2023
  • November 2023
  • October 2023
  • September 2023
  • August 2023
  • July 2023
  • June 2023
  • May 2023
  • April 2023
  • March 2023
  • February 2023
  • January 2023
  • December 2022
  • November 2022
  • October 2022
  • September 2022
  • August 2022
  • July 2022
  • June 2022
  • May 2022
  • April 2022
  • March 2022
  • February 2022
  • January 2022
  • December 2021
  • November 2021
  • October 2021
  • September 2021
  • August 2021
  • July 2021
  • June 2021
  • May 2021
  • April 2021
  • March 2021
  • February 2021
  • January 2021
  • December 2020
  • November 2020
  • October 2020
  • September 2020
  • August 2020
  • July 2020
  • June 2020
  • May 2020
  • April 2020
  • March 2020
  • February 2020
  • January 2020
  • December 2019
  • November 2019
  • October 2019
  • September 2019
  • August 2019
  • July 2019
  • June 2019
  • May 2019
  • April 2019
  • March 2019
  • February 2019
  • January 2019
  • December 2018
  • November 2018
  • October 2018
  • September 2018
  • August 2018
  • July 2018
  • June 2018
  • May 2018
  • April 2018
  • February 2018
  • January 2018

Categories

  • 5G
  • About
  • Accounting Tips
  • AdTech
  • Ai Platforms
  • Ai Platforms
  • Ai Platforms
  • Ai Platforms
  • Ai Platforms
  • Ai Platforms
  • Ai Platforms
  • Ai Platforms
  • Ai Platforms
  • Ai Platforms
  • Ai Platforms
  • Ai Platforms
  • Ai Platforms
  • Ai Platforms
  • Ai Platforms
  • Ai Platforms
  • AI Stocks
  • AI Stocks
  • Analysts
  • Application Monitoring
  • Application Monitoring
  • Applications
  • Applications
  • Applications
  • Applications
  • Applications
  • Applications
  • Applications
  • AR
  • Audit Reports
  • Autonomous Vehicles
  • Autonomous Vehicles
  • Autonomous Vehicles
  • Autonomous Vehicles
  • Autonomous Vehicles
  • Autonomous Vehicles
  • Autonomous Vehicles
  • Avod
  • Avod
  • Battery Charging
  • Bear Market
  • Bitcoin
  • Bitcoin
  • Bitcoin
  • Bitcoin
  • Bitcoin
  • Bitcoin
  • Bitcoin
  • Blockchain
  • Blockchain
  • Blockchain
  • Blockchain
  • Blockchain
  • Blockchain
  • Blockchain
  • Broad Market Today
  • Bull Market
  • Bull Market
  • Chainlink
  • Chainlink
  • Chainlink
  • Chainlink
  • China Stocks
  • Cloud
  • Cloud Infrastructure
  • Cloud Infrastructure
  • Cloud Infrastructure
  • Cloud Infrastructure
  • Cloud Infrastructure
  • Cloud Infrastructure
  • Cloud Infrastructure
  • Cloud Platforms
  • Cloud Platforms
  • Cloud Software
  • Cloud Software
  • Cloud Software
  • Cloud Software
  • Cloud Software
  • Cloud Software
  • Cloud Technology
  • Company
  • Company
  • Console Gaming
  • Console Gaming
  • Console Gaming
  • Consumer
  • Consumer
  • Consumer
  • Consumer
  • Consumer
  • Consumer
  • Consumer
  • Consumer
  • Consumer
  • Consumer
  • Consumer
  • Consumer
  • Consumer
  • Consumer
  • Consumer Tech
  • Corrections
  • Crypto Investment
  • Ctv
  • Ctv
  • Ctv
  • Ctv
  • Ctv
  • Ctv
  • Ctv
  • Ctv
  • Ctv
  • Ctv
  • Cybersecurity
  • Cybersecurity
  • Cybersecurity
  • Cybersecurity
  • Cybersecurity
  • Cybersecurity
  • Cybersecurity
  • Cybersecurity
  • Cybersecurity
  • Cybersecurity
  • Cybersecurity
  • Cybersecurity
  • Data
  • Data Analytics
  • Data Analytics
  • Data Analytics
  • Data Center
  • Data Center
  • Data Center
  • Data Center
  • Data Center
  • Data Center
  • Data Center
  • Data Center
  • Data Center
  • Data Center
  • Data Center
  • Data Center
  • Data Center
  • Data Center
  • Data Center
  • Data Center and Processing
  • Data Warehousing
  • Data Warehousing
  • Data Warehousing
  • Data Warehousing
  • Databases
  • Databases
  • Databases
  • Databases
  • Dating
  • Defi
  • Digital Ads
  • Digital Ads
  • Digital Ads
  • Digital Ads
  • Digital Ads
  • Digital Ads
  • Digital Ads
  • Digital Ads
  • Digital Ads
  • Digital Ads
  • Digital Ads
  • Digital Ads
  • Digital Ads
  • Digital Ads
  • E-Commerce
  • Earning Updates
  • Earning Updates
  • Earning Updates
  • Earning Updates
  • Earning Updates
  • Earnings Report
  • Earnings Report
  • Earnings Report
  • Earnings Report
  • Earnings Report
  • Earnings Report
  • Earnings Report
  • Earnings Report
  • ECommerce
  • Electric Vehicles
  • Electric Vehicles
  • Electric Vehicles
  • Electric Vehicles
  • Electric Vehicles
  • Electric Vehicles
  • Electric Vehicles
  • Energy Stocks
  • Enterprise
  • Enterprise
  • Enterprise
  • Enterprise
  • Enterprise
  • Enterprise
  • Enterprise
  • Enterprise
  • Enterprise
  • Ethereum
  • Events1
  • Events1
  • Exchange
  • Faq
  • Finance
  • Financial Analysis
  • Financial Analysis
  • Financial Analysis
  • Financial Analysis
  • Financial Analysis
  • Financial Analysis
  • Financial Analysis
  • Financial Analysis
  • Financial Analysis
  • Financial Analysis
  • Financial Analysis
  • Financial Analysis
  • Financial Markets
  • FinTech
  • Fundamental Analysis
  • Gambling
  • Gaming
  • Genomics
  • Glossary
  • Green Energy
  • Growth Stocks
  • Growth Stocks
  • Growth Stocks
  • Headsets
  • Headsets
  • Health Tech
  • Hydrogen
  • Identity
  • Identity
  • Identity
  • Inflation
  • Inflation
  • Inflation
  • Internet of Things
  • Interviews
  • Interviews
  • Interviews
  • Interviews
  • Investing
  • Investing
  • Ltbh
  • Ltbh
  • Ltbh
  • Ltbh
  • Ltbh
  • Macro Trends
  • Macro Trends
  • Market Trends
  • Market Trends
  • Market Trends
  • Market Trends
  • Market Trends
  • Market Trends
  • Market Trends
  • Market Updates
  • Market Updates
  • Market Updates
  • Market Updates
  • Market Updates
  • Market Updates
  • Market Updates
  • Market Updates
  • Market Updates
  • Market Updates
  • Media
  • Membership
  • Mining
  • Mobile
  • Mobile
  • Mobile
  • Mobile
  • Mobile Gaming
  • Mobile Gaming
  • Mobile Gaming
  • Multimedia
  • Music Streaming
  • NVDA | NVIDIA Corporation
  • Performance Updates
  • Pin Content
  • Podcasts
  • Podcasts
  • Podcasts
  • Portfolio
  • Premium Research
  • Press Releases
  • Press Releases
  • Productivity
  • Productivity
  • Productivity
  • Productivity
  • Productivity
  • Productivity
  • Productivity
  • Reports and Whitepapers
  • Research Services Preview
  • Resources
  • Resources
  • Semiconductor Stocks
  • Semiconductors
  • Semiconductors
  • Semiconductors
  • Semiconductors
  • Semiconductors
  • Semiconductors
  • Semiconductors
  • Semiconductors
  • Semiconductors
  • Semiconductors
  • Semiconductors
  • Semiconductors
  • Semiconductors
  • Social Media
  • Social Media
  • Social Media
  • Social Media
  • Social Media
  • Social Media
  • Social Media
  • Software
  • Software
  • Software
  • Software
  • Software
  • Software
  • Software
  • Software
  • Software
  • Software
  • Software
  • Software
  • Software
  • Software
  • Software
  • Solar
  • Solar
  • Stock Analysis PDFs
  • Stock Updates
  • Stock Updates (Blogs)
  • Supplychain
  • Supplychain
  • Supplychain
  • Supplychain
  • Supplychain
  • Supplychain
  • Svod
  • Svod
  • Svod
  • Svod
  • Svod
  • Svod
  • Tech Podcast
  • Tech Stock News
  • Tech Stock News
  • Tech Stock News
  • Tech Stock News
  • Tech Stock News
  • Tech Stocks
  • Tech Stocks
  • Tech Stocks
  • Tech Stocks
  • Tech Stocks
  • Tech Stocks
  • Tech Stocks
  • Tech Stocks
  • Tech Stocks
  • Tech Stocks
  • Tech Stocks
  • Tech Stocks
  • Tech Stocks
  • Tech Stocks
  • Technical Analysis
  • Telehealth
  • Telehealth
  • Telehealth
  • Telehealth
  • Testing Equipment
  • Testing Equipment
  • Top Tech Stock News
  • Travel
  • Trends Report
  • Tutorials
  • Uncategorized
  • Updates
  • Updates
  • Updates
  • Video
  • Video
  • Video
  • Video
  • Video Footage
  • VR
  • Webinar Alerts
  • Webinar Alerts
  • Webinars
Proudly powered by WordPress | Theme: iofund by iofund.co.uk.