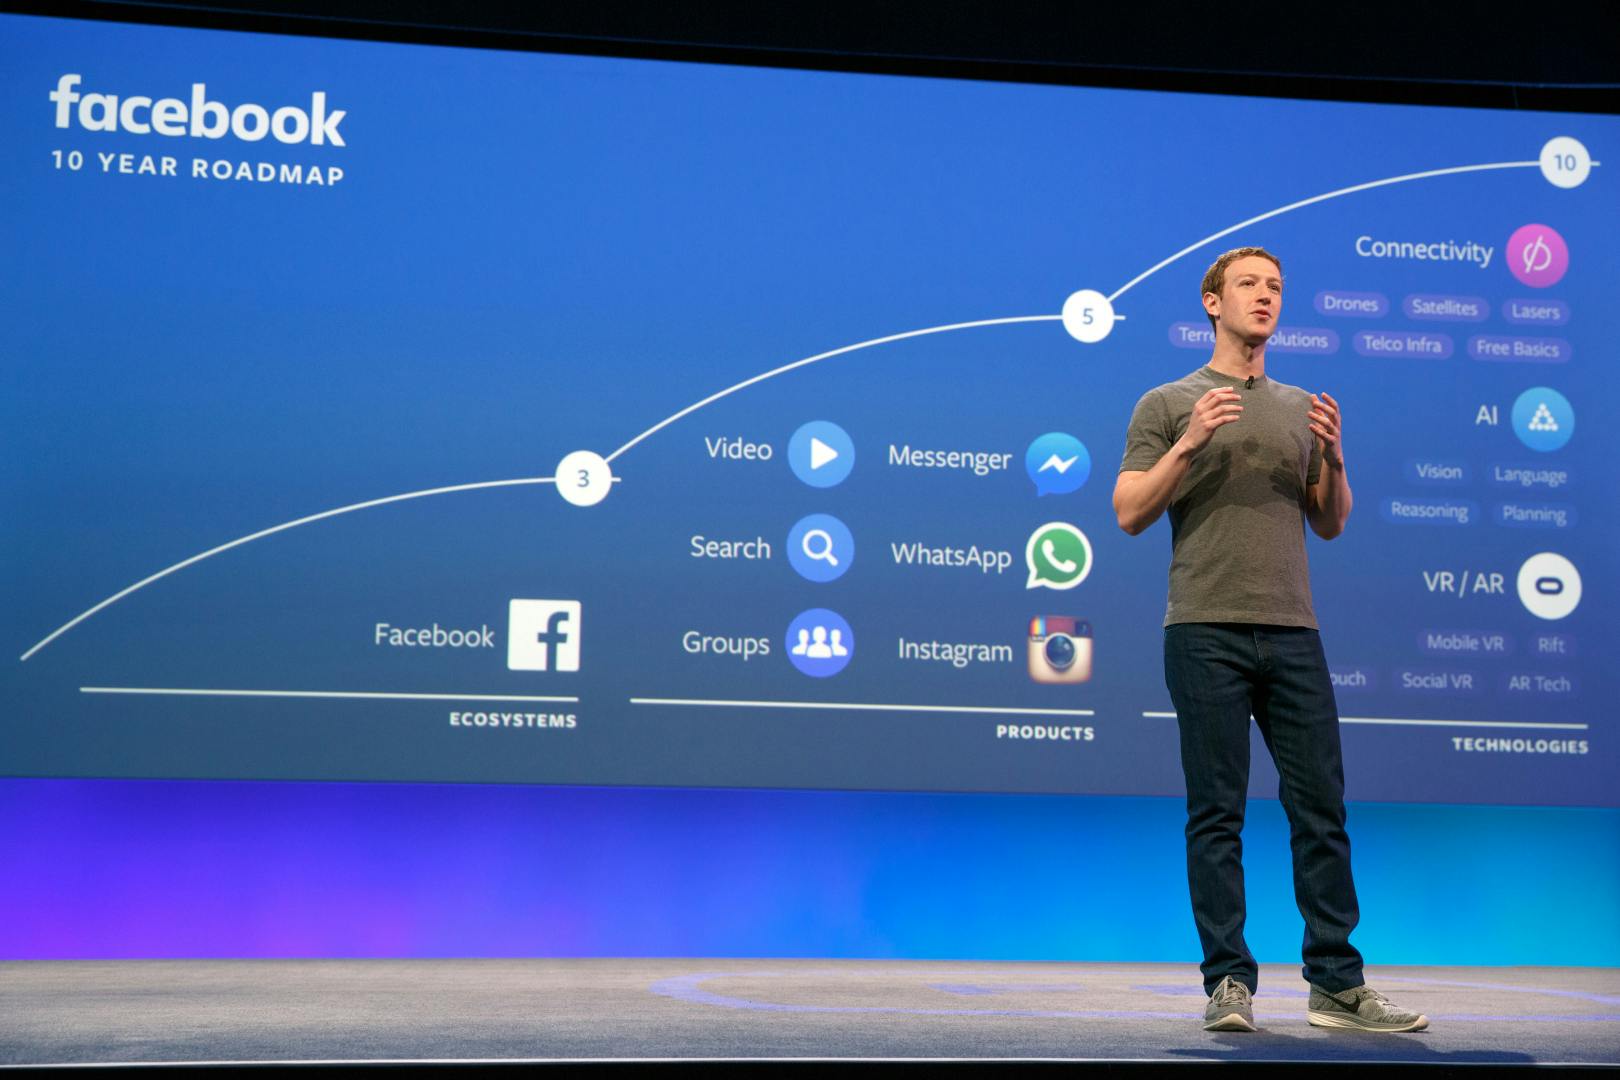
Facebook’s earnings call today may be the most anticipated call of Q3. The stock has tumbled since the last quarterly earnings call from a high of $217 in July to a low of $142. Three months ago, Street analysts did not think this was possible – and many still have price targets at $200. I believe bullish financial analysts are distracted by Facebook’s security costs, news feed fatigue and Instagram while underestimating the most important number on Facebook’s earnings call tomorrow –user growth rate.
Background on Facebook’s User Growth Trajectory
Facebook’s rampant growth from 2004-2017 was due to a viral coefficient formula which is also known as the k-factor. The k-factor equation was taken from epidemiology, in which a virus that has a k-factor greater than 1 indicates exponential growth. The equation for virality for websites and applications describes the growth rate:
k = i * c
i = number of invites
C = conversion rate
When K is equal to one or greater, you have viral growth.
Facebook’s growth rate trajectory was exponential because people found the network more rewarding when more people they knew joined the network. The same will be true for Facebook’s deceleration, as well. As people start to spend less time on the social network, there will be viral deceleration.
To illustrate, a loss of 1 million users in the United States to Facebook is not a 1:1 loss, like it would be for Netflix or Google, where users are isolated from each other in a “silo.”
If I stop using Google, your search results are not affected.
If I stop using Netflix, your programming choices are not affected.
Even Twitter can withstand user loss as the platform is not based on a reciprocal following structure. This is why a celebrity can have 60 million followers, yet only follow 135 people in return.
If 1 million users close their Facebook accounts in the United States, however, it will be subject to a negative k-factor. These 1 million people who delete their accounts weaken the content on the platform for the 50 million-500 million people who were connected to them (assuming each user has at least 100 friends and some are inter-connected).
Now, if 2 million of the subsequent 50-500 million start to use Facebook less due to the impact the original 1 million had, then another 500 million to 1 billion will have a less enjoyable experience, which will reduce time on site. If 5 million from those 500 million find the platform less interesting because their favorite people have left the platform, the affects will continue to spiral.
My newsletter subscribers get this information first. Sign up here.My newsletter subscribers get this information first. Sign up here.here.
This is why Snap has been a popular short. Snapchat continues to lose daily active users on a quarter-over-quarter basis in North America and Europe. Only last May, Snap began to report a sinking growth rate of 2.13 percent – which was its slowest ever at the time compared to 5 percent in Q4 2017. See below for how Facebook’s user growth rate compares.
It should be noted that this was once Facebook’s strength and Twitter’s weakness. New users on Facebook had a low barrier to entry because total friend count grew relative to how much you reciprocate and follow back. Twitter, on the other hand, has had a tough time attracting new users because there is no reciprocation.
Facebook Reported Slowest-ever User Growth Rate in Q2 2018
The viral-coefficient-in-the-reverse explains why the most important metric for investors to pay attention to in Facebook’s earnings report is the user growth rate. Last quarter, Facebook’s monthly user count grew 1.54 percent compared to 3.14 last quarter. Daily active users grew even slower at 1.44 percent, compared to 3.42 percent last quarter. Previously, the slowest daily active user growth rate was 2.18 percent in Q4 2017. If this number becomes stagnant, the social media platform can decelerate very quickly. This is also why it’s possible for Facebook to report strong earnings and there still be a sell-off. If and when this number goes into the red, Facebook will have reached its peak as a social media platform –and profits will soon follow this trailing decline.
Disclosure: I shorted this stock in April of 2018 and have a put option on this stock as of October 2018 as I expect the user growth rates to continue to decline in the near future. Readers should also note these declines are more likely to occur in high average revenue per user markets (ARPU) such as the United States, Canada, and in Europe.
It’s understandable if you missed the headlines that Apple may buy Tesla. That piece of speculative news, like most news about Tesla, has been overshadowed by the PR storm that surrounds the CEO’s behavior rather than based on the technology behind the product.
Here’s some background information for those who missed it. Simultaneously with the CEO’s investigation for violation SEC law 10b-5, rumors began to circulate that Apple may buy Tesla. Some of these rumors were started by Ross Gerber, a Tesla investor, while others sourced the VC firm Loup Ventures, and the gossip is still being echoed a month later. Essentially, the prediction is that if Tesla fails to become profitable, “Apple gains the upper hand and becomes the most likely investor or buyer.”
From a technical standpoint, the theory of an Apple acquisition is nearly impossible. The authors oversimplify (or don’t even address) where Apple is in the development stack, where autonomous vehicles (AV) are in the maturation cycle, and the ongoing failure points in AV technology that Tesla is not able to solve.
I understand there are a lot of Elon fans rooting for him, and perhaps some satisfied Tesla owners who will read this, but stock investors are in a different class. They can’t afford to follow a fad because returns are at stake. With that said, here are three blatant reasons as to why Apple won’t touch Tesla, and why I won’t either. (There is information on shorting Tesla below).
My newsletter subscribers get this information first. Sign up here.My newsletter subscribers get this information first. Sign up here.here.
1. Apple Makes The World’s Best Software– Not Vehicles
Apple will not buy Tesla for the very fact that Apple doesn’t need to manufacture a car in order to capture the autonomous vehicle (AV) market. Apple is a computer and software company and AVs will require powerful computing systems. The cars released today with connectivity features have the computing power of 20 personal computers and feature over 100 million lines of programming code. Next decade’s semi-autonomous cars will have 300 million lines of code, and the distant future of fully autonomous will have 1 billion lines of code. Apple will not limit itself to the 200,000 cars that Tesla sells annually, (or even 320,000 if the current quarter is to be sustained), while at the time assuming the overhead, cyclical sales and incumbent competition of an auto manufacturing when it can capture a piece of the 82 million vehicles sold globally through the core business of supplying software. Keep in mind, Tesla is one among many who have achieved Level 2 autonomy with no indication they can safely release beyond Level 2. This makes the small amount of production Tesla actually does even less impressive from an acquisition standpoint (more on this below).
2. Apple Vs. Google: Nothing New Here Folks
The cars that Apple and Google have on the market are used to test the operating system and nothing more. These vehicles are not necessarily trying to compete with GM, Ford, Volkswagen or Audi. That’s why Apple and Google are seeking partnerships with them – they’re not competing with them. For instance, Google has run tests with Lexus/Toyota, and Jaguar Land Rover, and Apple has partnered with Volkswagon. Even still, we are at least a decadeaway from having full autonomous vehicles on the road due to technical mishaps, security vulnerabilities and government regulations. Of these, security will be the biggest hurdle to overcome as you can’t test for every possible scenario. This is because the electrical components in a car (known as the electronic control units, or ECUs) are connected via an internal network. The peripheral ECU introduces vulnerabilities such as the vehicle’s infotainment center, which means WiFi or Bluetooth can grant access to core systems such as the brakes and transmission.
AVs closest comparable for security today is the smartphone, with roving mobile sensors and signals, and iOS is challenging to hack. Can GM and other Detroit manufacturers duplicate the level of secure, computing power which Apple has perfected over the last 40 years with a closed ecosystem and the last 10 years with roving mobile signals? It’s not likely Detroit will compete with Cupertino on the machine learning required for 300 million lines of code or more, combined with full-system security, and it’ll take only one car hack before this is realized. (GM’s On Star was hacked in 2015).
This is true in the reverse, as well. Cupertino and Mountain View don’t have the talent recruits or experience that Detroit and Munich have in car manufacturing. Tesla most certainly doesn’t as the CEO is a mobile payments entrepreneur from Paypal (yes, he led a team that launched rockets — but there are no competitors here – except NASA which only spends money – therefore this is irrelevant for what Tesla faces).
3. Baby Steps: Connected Car, then Semi-Autonomous, then Fully-Autonomous
As Tim Cook said, “[Autonomous Systems] are probably one of the most difficult AI projects to work on.” There are six levels to autonomous vehicles as published by SAE International. The cars released today are primarily “connected cars” featuring driver assistance (level 1) or partial automation (level 2). Tesla’s Autopilot is a Level 2 system.
What will it take to get to a Level 3? Level 3, also known as conditional automation, is hands-off and eyes-off, but still requires a human. The first to market (and only vehicle to reach the public market as of yet) is the Audi A8 featuring Traffic Jam Pilot which continues to see delays in the United States. This is why it may be at least a decade before we see level 4, high automation, or level 5, full automation. (This is despite Elon Musk tweeting that Tesla will release full automation by 2019 – but at this point, it’s safe to say we should not put your money behind these tweets).
Gartner, one of the most trusted sources for predicting technology development cycles, has placed autonomous vehicles at more than 10 years out on their most recent hype cycle graph. This hype cycle graph predicts the maturation phases for new technologies and is hauntingly accurate in predicting the ebb and flow of tech and startup fads. Remember the wearables crash? Yes, Apple Watch survived but many did not – including Google Glass despite its backing. How about Virtual Reality – especially fan favorite Oculus? As you can see in the chart below, we have just exited the peak of inflated expectations and are on the way towards the trough of disillusionment. Short sellers of Tesla this year and last year may have been basing their calls on the CEO’s behavior but we are now about to enter major technology road blocks and consolidation that unbiased analysts predict will put even the highest performing AV companies to the test – with many low performing AV companies will not survive (see where Tesla is rated below). The current shorts are not wrong, they are simply too early in the maturation process for AVs and have had a bumpy ride because of this.
4. Would you Bet On a Horse in Nineteenth Place?
In a recent report released in Q1 2018 by Navigant Research, automated driving systems were rated on 10 criteria: go-to market strategy, partners, production strategy, technology, sales, marketing and distribution, product capability, product quality and reliability, product portfolio, and staying power. Of the nineteen companies that Navigant objectively analyzes, Tesla came in last place at number nineteen.
There is a “cost and complexity” once you take a “human driver out of the control loop,” as Navigant states, and it is my belief that the partnerships which are forming between software companies and auto manufacturers will continue to outrank Tesla in product capability, reliability and security (something Navigant did not report on) – not to mention the basics of production cycles and manufacturing vehicles at scale.
Here are the top 10 from the Navigant leaderboard:
Top 10 Vendors:
GM
Waymo
Daimler-Bosch
Ford
Volkswagen Group
BMW-Intel-FCA
Aptiv
Renault-Nissan Alliance
Volvo-Autoliv-Ericsson-Zenuity
PSA
Conclusion:
Apple has many opportunities to enter the connected car and semi-autonomous vehicle market, and the best card to play will be the through the OS in the level 1-2 category similar to Google’s recent announcement that the Android OS and Google Assistant will be featured across the Renault-Nissan-Mitsubishi Alliance. Taking these baby steps now is a much smarter move for Apple than acquiring a horse that is in nineteenth place with the race heating up to reliably and safely reach Level 3 and Level 4 autonomy. In this regard, there is nothing to here to acquire.
Although there is no doubt that Waymo is ahead of Apple (and everyone, really) in the race towards automation, if Gartner and many other unbiased sources are correct, Apple has time to develop a driving system in-house (or perhaps acquire a machine learning automation startup) as we are at least 10 years from full automation.
Beth.Technology Prediction: Telsa shorts were right but their timing was off. We are in a Level 2 AV bubble, and it will burst as Level 3 and Level 4 experiences growing pains (lots of cash has poured in with too high of expectations on when when AV will start to turn a profit). Tesla, a luxury electric car company, will struggle greatly in the competitive hurricane for reliable and safe automation. Therefore, I’m considering a short on Tesla in 2019 or 2020, which I plan to time with the AV bubble bursting.
Summary: Infrastructure as a service (IaaS) is the fastest growing cloud segment and will continue to be with AI, machine learning and connected cars. Gartner, an authority in tech analysis, placed Oracle in the “niche player quadrant” (not the leader quadrant) for Infrastructure as a Service (IaaS) May 22. In addition to IaaS, Oracle’s Data as a Service business model will weaken as marketers fail to get proper consent for ad targeting.
Cloud infrastructure is hot right now and for good reason. The world increasingly relies on cloud data centers due to server virtualization, smartphones, movies and entertainment, chatbots, office productivity, software as a service, and social media, to name a few.
Gartner predicts the worldwide public cloud services market will grow to 21.4 percent in 2018 to $186.4 billion. The fastest growing segment is infrastructure as a service (IaaS) forecast to grow 35.9 percent in 2018. As we store more data in the cloud from AI and machine learning, this sector will continue to expand. For instance, fully automated cars will produce an estimated 25 Gigabytes of data per hour or 300 TB per year. Therefore, any savvy investor should place bets in this sector for 2021 and beyond.
No Medal for 4th Place in Cloud Infrastructure
Oracle (ORCL) is a long-time enterprise cloud powerhouse with billions invested in engineering and strategic acquisitions. On the quest to build and defend a range of cloud services, the company is expanding hybrid-cloud technologies, investing in customer-success programs, and benefiting from a less-than-expected decline in on-premise revenue. On the other hand, the transition to the cloud is taking longer than expected, according to Keybanc analysts, and is at risk for lagging behind Amazon (AMZN), Microsoft (MSFT) and Google (GOOG) in the Infrastructure as a Service category, the fastest growing category in public cloud services.
Last quarter, Oracle beat earnings estimates but came in slightly below expectations for revenue at $9.77 billion vs. $9.78 billion. The adjusted earnings of 83 cents beat the consensus estimate of 72 cents and was up 20% for its fiscal third quarter, which ended February 28. The better than expected earnings were not enough to convince investors in Q3 as the stock fell 4 percent after earnings were reported, then fell an additional 8 percent in pre-market trading. The stock is at $46.16 today compared to $52.90 before Q3 earnings.
One major concern is Oracle’s low share of cloud infrastructure and platform revenue, which came in at $415 million with 28 percent growth compared to Amazon at $5.11 billion revenue at 45 percent growth. It doesn’t help that Gartner, an authority for accurate tech analysis, placed Oracle in the “niche player quadrant” in the Magic Quadrant (not the leader quadrant) for Infrastructure as a Service (IaaS). Notably, financial analysts from JP Morgan and Murphy lowered Oracle targets yesterday, however, Gartner published this magic quadrant on May 22nd and it is likely what these analysts based their predictions on.
Meanwhile, in another category, cloud software (SaaS) revenue was up 33% last quarter for Oracle at $1.15 billion with notable competitors SAP and SalesForce. The remaining revenue is primarily on-premise revenue of $6.42 billion, and software license revenue of $1.39 billion.
While Oracle has maintained a name for itself in cloud services, it’s offerings are not strong enough to earn a medal as a front runner, which will spell trouble for earnings as Data as a Service (DaaS) undergoes regulations.
DaaS: Programmatic Will Crash
Oracle pursues many strategies and acquisitions for cloud services because it knows it has to be seen as a cloud company in order for Wall Street to invest in its future. However, one of Oracle’s main market positions is Data as a Service (DaaS). From 2012 to 2014, Oracle went on a tear of acquisitions to increase their marketing stack and to cement their position in the digital advertising space. In May of 2012, Oracle bought social marketing solutions provider Virtue for an estimated $300 million, the marketing automation firm Eloqua for $810 million in December of 2012, Responsys for $1.5 billion which is a business to consumer solution and the data management platform, BlueKai, for $400 million in 2014. This totaled an estimated $3 billion in collective marketing tech acquisitions to enhance DaaS.
Programmatic is the automatic trading of advertising which is augmented by data for superior digital advertising. Oracle’s DaaS is essentially a way for companies to upload their data and potentially enrich their data by anonymously sharing and matching data sets. Oracle calls this “making your data smarter.”
Notably, BlueKai was a private company that captured the data boom with 9,245% growth from 2009-2012 – although competitors in the market saw a whopping 21,337% revenue growth (Data Xu). BlueKai was originally a buyer and seller of consumer data and pivoted to become a seller of data analytics and management technologies. These acquisitions were designed to help Oracle enable private data sharing. This is where the marketing ecosystem ingests first-party data and brokers marketing communications (MarCom) and advertisements in a second- party data transaction. While the data is not being sold, the information is being shared to third-parties without consent for the purpose of more advertisements.
My newsletter subscribers get this information first. Sign up here.My newsletter subscribers get this information first. Sign up here.here.
As the Oracle BlueKai deck states, here are some examples:
Hotel chain sharing data with a bank to target customers who do not have bank rewards cards
Online broker sharing data with a social media site for audience based targeting
Social media site sharing data with a technology company
While Oracle Blue Kai may not come directly under regulation because they are the middleman, and not the company with a direct relationship to the user, their business model is likely to weaken due to the way the data is being used. Marketing platforms and data management platforms will increase a marketers liability if they choose to transfer and trade private, first-party data. For these marketers, under the GDPR, consent must be given for each processing operation need and cannot be bundled together. Therefore, there will be less advertising and Marcom data to process, lowering Oracle’s revenue.
My Prediction: Cloud infrastructure will continue to grow as data storage increasingly provides the infrastructure for technological advancement. Amazon, Microsoft and now Google have been upgraded while Oracle has been downgraded during a key growth stage for IaaS. In addition, Oracle acquired many companies in the DaaS space which will continue to wane as regulations increase on customers using Oracle for targeted data. Couple this with fierce competitors in the IaaS and SaaS space, and Oracle will see lower than expected earnings this year.
Summary: This analysis answers the following questions:
Search is a large driver of revenue and doesn’t require data but what other portions of Alphabet’s advertising model will be affected by the GDPR?
How much revenue do the higher risk methods currently contribute to earnings?
Where is Alphabet most likely to incur GDPR fines?
How will non-personalized ads affect earnings and network sites?
Alphabet (GOOG) was announced in 2015 as a holding company to help separate Google’s advertising business from the sprawling investments in Fiber internet, cloud computing, smart home products and connected car products. While these new gadgets and the promise of AI have helped successfully rebrand Google’s search and advertising business, it’s important to remember that Alphabet is still an old-fashioned advertising company with nearly 90% of Q1 2018 revenue, or $26.6 billion, coming from advertising and only 15%, or $4.6 billion, coming from these other ambitions.
Therefore, understanding the nuances of advertising especially as it relates to data regulations is going to be key for any savvy Alphabet investor. While you can invest in Alphabet for AI or connected cars, we are in the beginning of the hype cycle for these technologies, whereas the current stock price reflects advertising. Unfortunately, top-rated analysts struggle to understand Alphabet’s business model as it relates to the GDPR and CEO Sundar Pichai did not offer any answers. In the Q1 2018 earnings call, Mark Mahaney of RBC Capital Markets asked if the “GDPR or other regulation is likely to impact materially the targeting capabilities that advertisers have on Google?” The CEO replied:
“You know, above everything else as we are working through GDPR we are making sure we are focused on getting that user experience right for our users and our partners. But to clarify your question further, you know, first of all, it’s important to understand that most of our ad business is Search, where we rely on very limited information, essentially what is in the keywords to show a relevant ad or product. And so, you know, we’ve been preparing this for 18 months and I think I think, you know, we have focused on getting the compliance right. It will be a years’ long effort and, you know, we are helping not just us, but our publishers and partners. But overall, we think we’ll be able to do all that, you know, with a positive impact for users and publishers and advertisers, and so our business.”
This answer was over-simplified at best. Yes, Search is a large driver of revenue but what are the other portions of the advertising machine which will be affected? And how much revenue do the higher risk methods currently contribute to earnings?
In addition, while Alphabet has been preparing for 18 months, they recently dropped new terms and conditions on publishers only 8 weeks before the GDPR took effect – and publishers are not happy about it.
Publishers are essential for quite a few elements to the Alphabet’s advertising machine as they provide additional surface area for ad space. By installing Google’s ad software onto websites and applications, publishers allow Google to advertise on their sites.
Most importantly, because this relates to ad revenue from networks outside of Google-owned properties, this portion of revenue is what holds the highest risk in this new era of data regulations – and the revenue is sizeable enough to lead to missed earnings in the future.
Alphabet & Data Regulations: The Good, The Bad and The Ugly
The Good: Search Doesn’t Need Data; Gmail, Chrome and Google Maps Have User Consent
Quite a few of Google’s data-driven applications and services such as Gmail, Chrome and Google Maps can easily obtain user permission in exchange for the services these applications and browser provides. In addition, Google AdWords, which is based off search intent, will provide a safe haven Google’s advertising revenue as this does not require the company to harvest private data. However, even search is not immune as it’s been enriched with data such as location to enhance search results.
The Bad: Android OS Collects Surveillance-Level Data without User Consent
In one study of 850,000 internet users last year, mainly in the U.S. and Europe, Google tracked 64% of all pages loaded by mobile and web browsers
It’s hard to know where to start when looking at Google’s sprawl of potential data regulation issues. We could start with the fact they have a deal with data brokers that gives them access to 70% of our purchases made with credit cards and debit cards (without consent). The company is literally in your bank account. This is for the purpose of letting advertisers know if you completed a sale following an ad seen on one of Google’s properties. Another place to start is implicit data for advertising purposes, which uses your search history to target ads to you outside of Google search. This is why when you privately email your friend about a trip to Rome, you mysteriously get advertisements for flights to Rome on other websites.
While online tracking and conversion tracking are both invasive, the Android operating system is a surveillance-level behemoth with over 2 billion devices in circulation while littered with millions of applications leaking data to Alphabet’s advantage. Exponentially speaking, Android is impossible to contain. One study by the French research organization Exodus Privacy and Yale University’s Privacy Lab found that more than three in four Android apps contain a third-party tracker which extracts personal information, including location and in-app behavior. The apps the trackers were discovered includes Uber, Twitter, Spotify, and Tinder. The Privacy Lab found the in-app trackers revealed “an extensive data mining market buried within the mobile app ecosystem” enabling physical surveillance including through the use of WiFi, Bluetooth and ultrasonic sound inaudible to the human ear to track geolocations in real time.
Takeaway: Android will be the most likely source for fines by the European Union as it will be challenging to partition device IDs by geographies. Some have conjectured Alphabet will risk fines before voluntarily reducing their cyber intelligence. The fines are 1.6% of annual global revenue, or $4.4 billion for Google.
The Ugly: Walking the Razor’s Edge Between Data Violations and Non-Personalized Ads
Data collected from the Android OS augments and enriches data science modeling for Alphabet to monetize the data elsewhere. That “elsewhere” is Adsense, AdX and AdMob. Google’s AdSense and AdX Networks enable non-Google websites to incorporate Google display advertising, and this is what current publishers are in an uproar about.
To summarize, Alphabet is attempting to become a co-controller for data in some instances and a processor in other instances. It’s unknown how the European Union will view data leaks from publishers to Alphabet.
Source: Quora
The level of involvement Google has as either a co-controller or processor is important for investors to understand as these regulations continue to play out. This may be hard to imagine today, but if data collection returns to property-owned data collection only, then the premium price advertisers pay for Google ad inventory may diminish as Google will struggle to differentiate itself from other advertising options from a campaign ROI standpoint if or when it fails to get the proper consent to collect the data and broker the ads.
The worst case scenario here is that Google has to display “non-personalized” ads where consent isn’t obtained – which Google is already prepared to do: “As previously announced, we’re also launching a Non-Personalized Ads solution (DFP/AdX, AdMob, AdSense) to enable publishers to present EEA users with a choice between personalized ads and non-personalized ads (or to choose to serve only non-personalized ads to users in the EEA).”
As mentioned above, this is where the premium price can potentially recede. By being forced to serve non-personalized ads, the competitive advantage Google has will diminish in this circumstance.
Bottom Line:
While Search is intact, there are many layers to data collection and ad targeting which will lower ROI campaign performance as the data Alphabet is allowed to collect continues to wane. In this article, we’ve discussed that the Android OS is leaky and the most likely part of Alphabet’s business to be fined. As far as revenue is concerned, non-personalized ads is the potential weakness especially on network sites as $17.59 billion was earned from network sites annually in 2017.
Summary: Despite knee jerk volatility, Roku will become a large cap stock in OTT (over-the-top) within 2-5 years. While Pay TV operators continue to bleed subscribers, Roku has the best business model to capitalize on these losses compared to highly fragmented OTT and SVOD competitors. In addition, Roku has maintained competitive vigor as the number one streaming device in the United States while remaining vendor agnostic. Going global will cement this position.
Roku (ROKU) stock prices have fluctuated wildly from being one of the hottest stocks in 2017 with a 400% return from the IPO price of $14 to a high in December of $56. From there, the streaming device maker saw shares drop 42% where it’s been range-bound at $31-$34 per share. That is, except when Amazon (AMZN) announced a fairly irrelevant partnership with a dying brick-and-mortar Best Buy (BBY) resulting in an 11.8% drop.
Or, the announcement of Roku offering access to ESPN+, which bumped the shares up 12%. While some are still confused on Roku’s value proposition, one thing is for certain, Roku’s stock is volatile and will continue to test investors’ technological depth on how exactly a hardware company plans to stay profitable … except, Roku is not a hardware company. Wall Street just (mistakenly) thinks it is.
This article originally appeared May 8th on Seeking Alpha.
Ahead of earnings this week, KeyBanc placed a $42 price target on the stock at about 27% above current levels of the shares. Notably, many short sellers lost the gamble when the lock-up expired six months after the IPO date in March with false expectations the market would be flooded with shares. The stock has seen about an 11% decline since March from the price of $39 – not the crash short investors were hoping for. Meanwhile, Roku’s short interest has dropped 38% since its peak from 10 million shares shorted at the end of March to 6.2 million shares shorted by mid-April.
Roku’s stock will continue to be volatile as the company expects to continue losing money in 2018 aiming to operate “at, or near, break-even on an operating cash flow basis.” Yet bulls continue to focus on the huge upside potential as the number one streaming device in the United States with $90 million in revenue coming from the ad-supported platform.
Looking beyond the knee-jerk volatility, here are the top reasons Roku will be a large cap stock in OTT (over-the-top) within 2-5 years.
1.Blood In The Water:
The peak for pay TV in the United States occurred in 2010/2011 when it began a predictable erosion. The number of pay-tv subscribers fell by 8,000 in 2012 and accelerated to 164,000 subscriber losses in 2014. Last year, the erosion neared deterioration with the top 10 pay TV operators losing a staggering 3 million linear subscribers in 2017 according to Leichtman Research.
Roku is the most synonymous business model with cable and satellite TV providers and can capitalize long-term on this massive subscriber loss by leveraging its advertising, audience development and content distribution services, which make up 89% of gross margins from the platform. In fact, if Roku was a traditional cable company, it would be the third largest distributor of content in the United States behind Comcast (CMCSA) and AT&T (T) with 19 million active subscribers.
2.Vendor Agnostic:
Roku critics cite too much competition for this mid-cap stock to carry the growth needed for long-term gains, especially from Apple (AAPL), Google (NASDAQ:GOOG) (GOOGL) and Amazon who all have a play in the hardware market for OTT video streaming services. However, this weakness is actually Roku’s strength. The Roku operating system, Roku OS 8, is a robust, reliable option for OTT streaming and has attracted partnerships with 1 in 5 smart TVs in the United States.
Meanwhile, operating systems like Samsung’s (OTC:SSNLF) Tizen continue to be plagued with bugs. But by being vendor-agnostic, Roku has still been able to secure a partnership for their free ad-supported channel with competing OSs like Samsung/Tizen. In addition, by remaining agnostic, Roku has maintained a full menu of original programming while corporate spats between Google (YouTube) and Amazon Prime restrict content choices.
Roku has also built a formidable catalog of 5,000 channels that even Google has not even come close to rival. This is where the discussion as to Roku being a hardware company should curtail as the “player” revenue will soon be eclipsed by the platform revenue (platform revenue stood at 45% in Q4 2017). It’s the latter where the company is making its largest investments including OTT advertising measurement tools, launching the free Roku channel, growing licensing fees and partnering for live TV.
3. There’s More To OTT Than Highly Fragmented Subscriptions:
Previously, viewing data and ratings on SVOD (subscription video on demand) such as Netflix (NFLX), Hulu Plus and Amazon Prime and other OTT content was not disclosed even by Nielsen (NLSN). However, in a recent interview, Nielsen COO Steve Hasker revealed four previously undisclosed statistics about SVOD such as 89.5% of SVOD content is primarily viewed on the television glass whereas 11.5% is viewed on smartphones and tablets.
Of this time, 80% is spent on catalog programming whereas 20% is spent on original content. Meanwhile, as competition increases, the costs for original programming are escalating with Netflix spending $8 billion in 2018 in order to remain competitive for a small piece of the pie (20% of how time is spent). Meanwhile, Roku has held firm on not creating original programming and the statistics support this. The costs for original programming are likely to escalate as HBO, Showtime, and now Apple will continue to compete for this space.
In addition, subscribers pay for quite a few premium $8+ subscription channels, which will eventually lead to subscription fatigue – not to mention mitigate the reason cord-cutters leave pay TV services – which is to lower costs. For a subscriber with YouTube TV ($40) and three premium channels ($24-26), they are paying $65+ per month. This pricing will meet resistance by cord cutters and ad-supported video on demand (AVOD) will be the answer.
Most importantly, original programming will consolidate or bundle (like it has on cable) and Roku is the perfect middleman to do this.
4. Global Potential:
This point ties into the previous two points where agnosticism in hardware and operating system along with building out a free, ad-supported channel will help Roku crush global expansion – especially in the emerging markets. The low price point for both the hardware and free content is desirable for global adoption, plus the 5,000 channels that Roku offers caters to differences in cultural viewing preferences.
Roku has shown competitive vigor by maintaining the lead as the top streaming media player in the United States claiming 37% of devices with nearly 40 million U.S. customers use Roku once per month. It’s only a matter of time until they take this success to the billions of people overseas who can’t afford pay TV or want to reduce pay TV costs.
5. Purely OTT Play:
In reference to the first point, there is an opportunity to capitalize due to massive pay TV subscriber losses such as last month when Charter (CHTR) lost 12% of market cap after reporting 112,000 subscriber losses and Comcast reported a loss of 98,000 in video users compared to a gain of 41,000 one year ago in Q1 2017.
This bloodbath from attrition will continue to accelerate through 2025 when even TV networks are expected to experience a 41% revenue loss. Roku is a very desirable purely OTT mid-cap choice with 19 million users and a $3.29 billion market cap that narrows in on this staggering market trend. Compare this to Charter Communications, which has a $65 billion market cap and only 16 million users.
Conclusion:
In the next 2-5 years, Roku will outpace competitors globally as it continues to be the cheapest, agnostic option with the most channels. Its executive team is experienced in OTT media and advertising, and the platform revenue will redefine how investors see this razor/razor blade opportunity (device player that locks in licensing fees and advertising). The free channel especially is attractive setting it apart from the over-abundance of paid, subscription channels. In addition, live TV will be an attractive space for Roku with the company already recently partnered with ABC News, People TV and Cheddar.