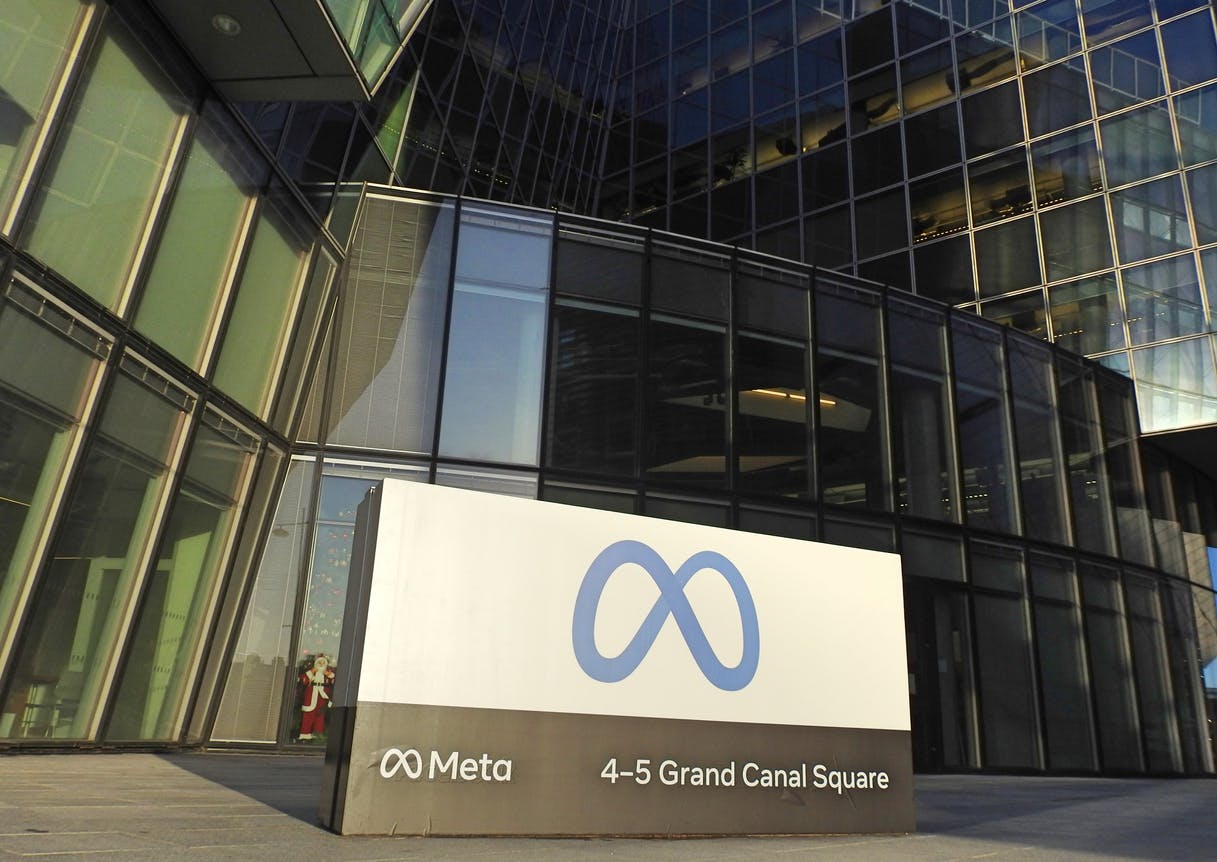
Meta shares nosedived 25% after the company's recent Q3 results. Meta's expenses are rising and the company is seeing softer revenue growth and softer margins. The slowing advertisement revenue has forced the company to look for new investments and the market is doubting when or if these investments will pay off.
Perhaps most importantly, the increase in expenses and Capex has plummeted Meta's cash flow margin in the most recent quarter. This is a material change to Meta’s story as the company was the leading FAANG stock on free cash flow yet reported a sudden, drastic reversal in Q3.
Below, I discuss the company's recent results in a detailed analysis below.
Meta’s Revenue is Slowing
The company’s revenue in Q3 fell by 4% YoY to $27.71 billion and was up 2% on a constant currency basis. The company managed to beat the consensus estimates by 1.2%. This is the company's second consecutive quarter of declining revenue.
CEO Mark Zuckerberg attempted to address concerns in his opening remarks yet the market was not buying it, “We now reach more than 3.7 billion people monthly across our Family of Apps. And while we continue to navigate some challenging dynamics of volatile macro economy, increasing competition, ad signal loss and growing costs from our long-term investments, I have to say that our product trends look better from what I see than some of the commentary I have seen suggests.”I have to say that our product trends look better from what I see than some of the commentary I have seen suggests.”
While the company does not fully acknowledge the change in business model that we discuss in our analysis “Facebook Stock: A Permanent Change To The Business Model” results show that the company is struggling with growth. The management expects growth to return next year as Mark Zuckerberg said, “We are still behind where I think we should be, but we believe that we will return to healthier revenue growth trends next year. That said it’s not clear that the economy has stabilized yet.”
Management’s guide for next quarter is $31.25 billion at the mid-point of the guidance, representing a YoY decline of 7.2% and the guide includes 7% foreign exchange headwinds. Analysts expect revenue to decline by 6.1% in Q4 and 1.6% in Q1 2023. The consensus estimates suggest that revenue growth is expected to return in Q2 2023.
Softer Operating Margins
In addition to revenue declining, the sell-off was also fuelled by a declining operating margin. Operating income fell 46% YoY to $5.66 billion. The Family of Apps segment operating income was $9.3 billion and Reality Labs operating loss was $3.7 billion. Total costs and expenses rose 19% YoY to $22.1 billion.
The company has seen a significant drop in the operating margin. Operating margin was 20% compared to 29% in Q2 2022 and 36% in the same period last year. It is significantly lower than the company’s historical period as seen in the chart below.
Source: YCharts
The management expects total expenses to be $86 billion at the mid-point of the guidance for the full year 2022, which represents YoY growth of 21%. This includes $900 million in additional charges for consolidating the office facilities that the company expects to record in the fourth quarter. I estimate the operating margin for Q4 to be 23% which would be significantly lower than the 37% in the same period last year.
Sign up for I/O Fund's free newsletter with gains of up to 403% – Click hereSign up for I/O Fund's free newsletter with gains of up to 403% – Click hereClick here
Meta Capex
For Q3, Meta had capital expenditures, including principal payments of financial leases of $9.52 billion, up 109% YoY.
YTD 2022, the Capex is $22.8 billion, and the management guidance for the full year 2022 has been revised to $32-$33 billion from the previous range of $30-$34 billion.
This represents YoY growth of 69% at the mid-point of the guidance. Doing the math suggests Q4 Capex will be about $9.7 billion, up 75% YoY and up 1.9% QoQ.
Source: Company Investor Relations
Dave Wehner, CFO of the company said in the earnings call, “Turning now to the specific CapEx outlook for ’22 and ’23. We expect 2022 capital expenditures, including principal payments on finance leases, to be in the range of $32 billion to $33 billion updated from our prior range of $30 billion to $34 billion. For 2023, we expect capital expenditures to be in the range of $34 billion to $39 billion driven by our investments in data center servers and network infrastructure. An increase in AI capacity is driving substantially all of our capital expenditure growth in 2023.”For 2023, we expect capital expenditures to be in the range of $34 billion to $39 billion driven by our investments in data center servers and network infrastructure. An increase in AI capacity is driving substantially all of our capital expenditure growth in 2023.”
Turning now to the specific expense outlook for ’22 and ’23, we expect 2022 total expenses to be in the range of $85 billion to $87 billion updated from our prior outlook of $85 billion to $88 billion. This includes an estimated $900 million in additional charges in Q4 related to consolidating our office facilities footprint that we expect to record in the fourth quarter of 2022. We anticipate our full year 2023 total expenses will be in the range of $96 billion to $101 billion. This includes an estimated $2 billion in charges related to consolidating our office facilities footprint.”
Source: YCharts
It's earnings season and our premium members have been getting deep dive analysis on the top tech stocks each week, on top of real-time trade notifications, technical analysis from our portfolio manager, weekly webinars, and more. Learn more about becoming a premium member here. It's earnings season and our premium members have been getting deep dive analysis on the top tech stocks each week, on top of real-time trade notifications, technical analysis from our portfolio manager, weekly webinars, and more. Learn more about becoming a premium member here. Learn more about becoming a premium member here.
The Bottom Line
The increasing expenses, particularly in the reality labs segment, have weighed on the company’s profits. The management expects the reality labs segment losses to continue in the next year and investors don’t seem confident the company’s spend on the metaverse will materialize into growth or profits for some time.
On the other hand, the company has been investing heavily in cloud infrastructure and artificial intelligence. The increase in Capex reduces the company’s free cash flows. This is a concern since Meta led Big Tech on a strong free cash flow margin in the past. The free cash flow margin was 1% in the recent quarter and down significantly from 37% in the December quarter.
The company’s net income fell 52% YoY to $4.4 billion. EPS of $1.64 compared to $3.22 for the same period last year. The company’s net profit margin was 16% compared to 23% in Q2 2022 and 32% in Q3 2021.
The company has cash and marketable securities of $41.78 billion at the end of Q3 2022. The debt was $9.92 billion.
The operating cash flow was $9.69 billion (35% of revenue) and free cash flow was a meagre $173 million (1% of revenue) in the recent quarter. The difference between operating cash flow and free cash flow is the high Capex.
Source: YCharts
Conclusion:
Meta Platforms was once a stock market darling for its solid revenue growth, strong profits and cash flow. Times have changed, and the company is now struggling with slowing ad revenue. It’s not only the increased expenses and capex that are an issue, rather a clear path to monetization that goes with it.
If you’d like more information regarding how the business model has changed, please reference the articles below.
Please note: The I/O Fund conducts research and draws conclusions for the Fund’s positions. We then share that information with our readers. This is not a guarantee of a stock’s performance. Please consult your personal financial advisor before buying any stock in the companies mentioned in this analysis.
I want to start by saying that Q2 will be lagging when the reports come out (Q2 likely to be low) and the market will be focused on Q3 guidance. It’s not possible for every single company to come in with strong reports, and instead, it’s our job to look for the companies most probable to find their legs again.
The hawkish FED stole the show but there were many headwinds that the tech industry faced – we’ve covered them in great depth including Apple’s privacy changes and supply chains including auto and lower consumer hardware sales (which has a trickle-down effect to ad-tech), plus the Ukraine war.
Even more important for our industry, tech has had to clear eight straight quarters of anomalous conditions with Q2 2022 guidance – notably, the tail spin on the high revenue water mark clears for nearly all companies by Q3 2022.
When we look at which companies are expected to have strong, accelerating revenue from the nadir of Q2, Unity stands out from the data below. We believe there could be early evidence of fundamentals lining up with technicals.
Here’s a brief description from Knox on what he wants to see before we enter Unity as a momentum play – he will post more on the forum tomorrow.
Unity is basing from the May 12th low. Interestingly, as the broad market made a lower low on May 20th as well as June 17th, Unity instead made a series of higher lows.
This is important, because it signals that the ratio of buyers to sellers from Unity’s all time low is shifting. What we need to see is a high volume breakout above $47 to signal that momentum has shifted to the upside, at least temporarily.
What’s worth pointing out is that Unity is currently holding a key support in red on the chart below. This is the 45 degree line (1×1) from the last high before Unity’s blowoff top. Note how price has used this line for key support and resistance since the downtrend began. It’s currently back above this line, which is important for halting the downtrend.
We need to reclaim the 2×1 line in blue, and breakout above the $47 resistance for us to buy. The weakness we are experiencing must hold 1×1 line as well as the May 12th low at $29. If another of these supports fail, we will step aside as the stock could reach new lows.
Analyst Consensus Showing Potential Q3 Rebound for Unity
Unity sits at the cross-section of cloud and ad-tech, and thus, it requires two looking at both categories to see the full picture for this company.
When comparing Unity to other cloud stocks, it ranks high for sequential growth from Q2 to Q3 at 17% from $305 million to $355 million, indicating the rebound is one of the best in the cloud category. If we look two quarters out to ensure the rebound is consistent, we see Unity is expected to increase revenue by 36% across two quarters from $305 million to $415 million.
Pictured Above: Unity leads but likely due to headwinds that ad-tech faced.
When we level the playing field and look at ad-tech stocks, which is probably a better indicator considering the transient headwinds facing the ad sector, Unity continues to rank high for the upcoming guide of Q3 yet is not as strong as ad-tech peers for Q4 indicating that two quarters out is when most ad-tech stocks will have rebounded.
Above: Unity leads Q2-Q3 sequential growth in ad-tech
Despite Unity showing a nice rebound for Q3 in analysts’ consensus, the far majority of ad-tech is showing a Q4 rebound:
It’s true that Q4 is affected by the holiday season yet we note many instances below where the growth is much higher between Q2-Q4 this year while these names are selling at much, much lower valuations. Please read the Q4 section below.
Unity has the following analyst consensus at this time:
Q2: +11% growth
Q3: +25% growth
Q4: +30% growth
On the bottom line, Unity expects to be consistently profitable by September of next year (2023). The biggest issue with earnings is also in the Q2 quarter while there’s a noticeable rebound for Q3 and beyond:
Q2: ($0.22) EPS
Q3: ($0.06) EPS
Q4: $0.02 EPS
Ad-Tech Showing a Rebound in Q4:
Unity:
Q3 consensus: +25% YoY growth
Q4 consensus: +30% YoY growth
Sequential growth for two quarters = +36% from $305M to $415M
Roku:
Q3 consensus: +36% YoY growth
Q4 consensus: +43% YoY growth
Sequential growth for two quarters = +55% from $805M to $1.24B
We already own Roku at a high allocation so this helps us keep the position in its current allocation going into earnings. There’s a caveat to Roku which is the hardware weighs on the bottom line but we have repeated (to the point where it’s probably becoming a bit repetitive) that we like it’s position on first-party data and we agree with its investments to strengthen what we’ve called the “Royal Flush” positioning. The company is expected to be profitable again by Dec 2023.
The Trade Desk has a rebound over a six-month period of 43% yet the valuation is quite a bit higher than its peers. There’s a great forum post here on The Trade Desk by a Member who invested in the stock. We love these long-form posts where Members discuss stocks they own outside of our portfolio – keep them coming! ☺
The Trade Desk:
Q3 consensus: +28% growth
Q4 consensus: +31% growth
Sequential growth 2 qtrs: $365M to $522M for 43% sequential growth
Snap’s rebound is slower on YoY basis yet from a Q2 low to a Q4 high in terms of sequential growth, the rebound is similar to its peers. Snap also has the highest revenue with roughly $6 billion in annual revenue compared to ad-tech peers with roughly $2 billion or less in annual revenue.
Among small caps, PubMatic actually is quite strong off the nadir of Q2:
Q3 consensus: +23% YoY growth
Q4 consensus: +22% YoY growth
Sequential Growth 2 qtrs: $61M to $96.5M for growth of 59%
Magnite is the small cap in ad-tech that we currently own and here is how the company compares. The growth listed is with SpotX.
Q3 consensus: +25% YoY growth
Q4 consensus: +16% YoY growth
Sequential Growth 2 qtrs: $125M to $165M for growth of +32%
This assumes each company will meet or exceed analyst guidance – there is no guarantee this will happen. This assumes each company will meet or exceed analyst guidance – there is no guarantee this will happen. What’s more important than making an exact prediction, however, is that we should be tracking when the rebound is scheduled to occur. We see real evidence of expectations this will occur in Q3. It’s important to remember too that ad-tech is below historic valuations and any improvement in growth will likely see these valuations return to average levels.
Consensus Shows Rebound Even with Q4 Holiday Comps
As stated above, you could argue that sequential growth across two quarters is less relevant considering that Q4 is the strongest quarter for ad-tech.
Here is last year’s Q2 to Q4 growth rates:
Unity: +15% from Q2-Q4 2021 = higher this year at 36%
Roku: +34% from Q2-Q4 2021 = higher this year at 51%
The Trade Desk: +41% from Q2-Q4 2021 = a tick higher this year at 43%
Snap: +32% from Q2-Q4 2021 = a few percentage points higher this year at 38%
PubMatic: +51% from Q2-Q4 2021 = higher this year at 58%
Magnite: +41% from Q2-Q4 2021 with two months of SpotX (lower this year at 32%)
In many cases, companies will bounce back with growth from Q2 to Q4 — yet, these companies were trading nearly 3-4X higher last year.
It should be noted that Unity typically is grouped with cloud for its valuation which is why it’s exceeded 45 forward sales in the past. When we look at the bottom line, it’s the small cap stocks that are most reasonable with Magnite and PubMatic trading in the 12 and 20 Forward P/E range, respectively.
Unity Earnings and Product Overview (Editorial):
Please note: We covered Unity following earnings on May 20, 2022 and have copied and pasted this information below as its current and timely.
Unity has demonstrated strong price action following the IPO last year due to its unique blend of cash efficient ad-tech monetization and near-monopolistic game development platform. The company is well suited for the Metaverse and industrial 3D worlds due to its history of supporting 3D game development.
In previous earnings calls, the management was confident they would not be affected by Apple’s IDFA changes or the other road blocks that caused ad-tech companies to lower guidance across the board. Unity’s confidence primarily came from their contextual ad positioning as compared to direct response. Therefore, there was high confidence going into earnings yet management delivered a sizable revenue miss due to a product mishap.
Unity previously guided for revenue growth of 36% for full year 2022, which would put the company as the leader in ad-tech growth and mid-range for cloud. In the recent call, the company lowered this guidance to 26% at the mid-point for a negative impact of $110 million. Guidance for Q2 2022 was at 7% at the midpoint, which would put Unity in the lowest quartile for ad-tech on growth and certainly for cloud. The stock dropped 35% following the announcement.
The surprise miss in revenue guidance was due to the company’s product Audience Pinpointer, which is a machine-learning powered user acquisition tool that allows game developers to acquire players based on a targeted return on their spend. Unity’s training data was also affected by ingesting bad data from a large customer. This led to Unity noticing less revenue coming from their monetization platform, and as advertisers saw less performance, they began to spend less.
Below, we weigh the pros and cons of an otherwise solid game engine and Metaverse stock.
Unity Has 2.8 Billion MAUs
Despite the temporary mishap with Audience Pinpointer, Unity has significant proprietary data and insights to feed contextual models. Unity is a game engine where more than 2.8 billion monthly active users (MAUs) play games or apps built on Unity compared to Facebook’s 2.9 billion monthly active users. The total addressable market for gaming exceeds 4 billion MAUs and Unity serves 61% of game developers.
It’s not exactly apples-to-apples with Facebook as Unity powers the games and is not a publisher like Facebook, yet it illustrates the scale the company is capable of. In the game development ecosystem, 72% of the top 1000 mobile games are made on Unity’s platform. There are 5 billion monthly app downloads.
Part of Unity’s substantial presence is the free tools it offers game developers who earn less than $100,000 annually, and for the most part they capture any developer between the indie (small) stage and up to AAA studios although many of these studios prefer to use their own in-house game engine. The company has especially found its stride on mobile.
Unity offers its products under two platforms, Create Solutions and Operate Solutions. The Create platform is used to create, edit and run 3D content. The Operate platform is used to grow and engage the user base and to also monetize content. The company derives 93% of 2021 revenue from these two platforms with a split of 64% Operate and 29% Create.
Create Solutions is where games are built and Operate Solutions is how games are monetized through ads and in-app purchases. There are also analytics offered through DeltaDNA, which collects information on end-user engagement and behavior.
Operate is successful through contextual ads rather than behavioral targeting, which has made the company resilient during Apple’s privacy changes.
On a contrarian note, because Unity has a very specific content type (gaming), there’s a chance the company is very resilient through the iOS 14 changes as targeting can occur through content type (i.e. Gaming, Financial News, Beauty & Health, etcetera). Previously, Unity Ads have been known to be more effective because the audience type and interests are narrow. There’s also a possibility that Unity is stronger with the IDFA changes as they own the game engine whereas their competitors are using third-party data only for targeting. These competitors include Vungle, AdColony, Facebook’s Audience Network, MoPub, Leadbolt, TapJoy, etcetera.Unity has a very specific content type (gaming), there’s a chance the company is very resilient through the iOS 14 changes as targeting can occur through content type (i.e. Gaming, Financial News, Beauty & Health, etcetera). Previously, Unity Ads have been known to be more effective because the audience type and interests are narrow. There’s also a possibility that Unity is stronger with the IDFA changes as they own the game engine whereas their competitors are using third-party data only for targeting. These competitors include Vungle, AdColony, Facebook’s Audience Network, MoPub, Leadbolt, TapJoy, etcetera.
Notably, Unity’s revenue miss was unrelated to Apple’s IDFA changes and was instead related to the company’s internal product Audience Pinpointer.
The Metaverse Opportunity
Developing games on Unity is low code and sometimes no code, which is ideal for 3D creators who are not necessarily developers. This lends itself well to the creator community that is most likely to drive forward the Metaverse, or Web3, and also the various industries that can benefit from 3D or AR/VR right now. The Create Solutions and tools are also great for prototyping, which speeds up the time to deployment. Unity is frequently acquiring tools and plugins to lower the barrier of entry for developers and creators. For example, Bolt2 helps developers implement logic without knowing how to code.
Last year, Unity developed a new architecture that provides native APIs to third-party providers and offers a high-level managed API to Unity developers. The new architecture fundamentally improves how Unity delivers and manages SDKs for XR platform integrations.
With Unity Pro, real-time 3D, AR and VR content can also be deployed on HoloLens and Oculus. The Unity Pixyz Plugin works with manufacturing software like AutoDesk to further industrial uses, such as automotive. Additionally, Unity does not compete with creators and is royalty-free.
The main thing to know about Unity’s products is they offer 3D creation for everyone, i.e., democratizes the process. This was initially intended for the gaming industry yet there is a natural affinity for gaming tools, IDEs, chips, etcetera, to be used for virtual worlds and the Metaverse.
The management had mentioned in the earnings call that the company was able to expand its market share in gaming and AR/VR. The company’s non-gaming business outpaced gaming business revenue as it grew 70% year-over-year. Digital twins and the metaverse are a substantial opportunity with 34 deals closed in the current quarter over $100,000, up 126% YoY.
Unity bought Weta Digital for $1.62 billion in exchange for the design tools, assets and data platform that drove film creations such as Lord of the Rings, Avengers, Avatar, and Game of Thrones. The goal is to bring the magic of film assets to the individual creator on Unity’s platform. It will also help the company to remain competitive against Epic’s Unreal Engine.
We had stated the following in a private note to our research customers when Unity acquired Weta:
“The Weta Digital acquisition helps Unity remain defensive against Epic’s Unreal Engine, which was used on virtual sets, such as Star Wars The Mandalorian. It also helps Unity build a Metaverse asset library, such as stadium scenes, character movements, large crowds, fantastical characters and backgrounds, etcetera, which can help the workflow for content creation for the metaverse. With that said, the more near-term opportunity for these acquisitions is for Unity to turn Hollywood into a customer.”is for Unity to turn Hollywood into a customer.”
Earlier this year, the company acquired Ziva Dynamics, the film software used for creating digital humans in Marvel movies, Hellblade, Jumanji, and Godzilla vs King Kong. In the recent quarter, the company received more than 8,000 sign-ups for the cloud uploads of beta version of Ziva Faces. Accroding to CEO John Riccitiello, “This service enables artists to use advanced machine learning models and massive data to train meshes for full expressiveness, instead of requiring teams of artists to spend weeks doing manual rigging.”
The company’s addressable market is growing and the management had mentioned in the last earnings call that the total addressable market for Create Solutions and Operate Solutions is $45 billion, up significantly from $29 billion during its IPO in 2020. The growth in the addressable market was due to the additions of new products and acquisitions.
Financials and Audience Pinpointer Issues:
The company finished the year 2021 strong with revenue growing 44% YoY to $1.1 billion and adjusted operating margins improved 200 bps to -4.6%. As a percentage of revenue, R&D is at 69%, which is slightly higher than it’s been in previous quarters. Expenses are frontloaded at the beginning of the year with the company expected to break even by 2023.
Q1 2022 revenue grew by 36% year-over-year to $320.1 million, which missed analyst consensus estimates by -0.32%. The company’s dollar-based net expansion rate came in at 135% compared to 140% in the same period last year and Q4 2021.
Unity’s management guided for revenue growth of 7% at the mid-point for Q2 2022. This was a stark surprise and lower than the 48% growth reported in Q2 2021. For the full-year, it has guided revenue growth of 26% at the mid-point which was lower than the earlier forecast of 36% provided during the year-end results.
The management mentioned in the earnings call that it was mainly due to two issues. According to John Riccitiello, CEO, “The first was a fault in our platform that resulted in reduced accuracy for our Audience Pinpointer tool, a revenue expensive issue given that our Pinpointer tool experienced significant growth post the IDFA changes. The second is that we lost the value of a portion of our data, training data due in part to us ingesting bad data from a large customer.”
Audience Pinpointer is a user acquisition product that is based on machine learning which helps game developers to acquire users based on a certain return on spending. The management expects these issues to be partially recovered in the third quarter and fully recovered by the end of the year. They reassured analysts on the call that there will no negative impact on the revenue for the year 2023.
As we had expected, the company was able to overcome the challenges of Apple’s iOS changes and the deprecation of the IDFA since a majority of games are built with Unity engine and analytics per the company saying: “Pinpointer tool experienced significant growth post the IDFA changes.” The CEO also stated, “We have proprietary data and insights coming from our reach to over three billion monthly active users feeding our contextual models. We have deep context, about game play, what players like to play, when and how they play games. And in gaming, this data has proven to be the most relevant for advertising.”
The management remains confident in the long-term opportunity. They estimate that there are more than four billion monthly active users and that less than 3% of users pay for games.
The company’s Create solutions is doing well and accelerated by 65% YoY to $116 million. This was driven by the strong adoption of real-time 3D. In the Content Solutions segment, some of the notable business use cases of big publishers include, “Angry Birds brought back Angry Birds Classic to mobile app stores using Unity to relaunch this treasured game and easily make it work across multiple modern devices. And Ubisoft used Unity to deliver incredible visuals and fast gameplay in Rainbow Six Mobile.”
The adjusted operating margin improved 280 bps to -7.2% which is lower than FY2021. The company had free cash flow of $86.4 million. However, the cash flow included the license fees for four years of $200 million relating to Weta FX.
Looking forward the management reiterated that it expects revenue to grow above 30% in the long-term. It also expects to be profitable in the fourth quarter of this year.
Conclusion:
Unity Software is the market leader in the fast-growing gaming industry. The company’s future growth opportunities extend beyond gaming to include industrial real-time 3D and the Metaverse. Due to its proprietary data from 2.8 billion MAUs and contextual targeting, Unity will likely come out stronger than other ad-tech companies following Apple’s privacy changes (and Google’s upcoming privacy changes circa 2023).
The market has been extraordinarily temperamental towards tech stocks and this is likely to be one of many instances where the current (low) stock price does not fully reflect the opportunity.
Every management team has a style and Wall Street (and/or the NLP machines – these two terms becoming synonymous) often penalize management teams that are more forthright. I actually like these teams better because I’m setting up for many quarters or many years for an investment. I’d rather hear the issues upfront so I don’t have to dig around for them like a detective. Roku is a management team that I can simply kick back and listen to the call because they tell you exactly the risks and the opportunities. The market, however, prefers more of a sugar high and Roku management isn’t great at dishing out sugar highs.
The words “tough year-over-year comps” came up a lot in Roku’s call. It would be easy to focus on those words and assume Roku is in a tough spot coming out of the increase of usage from last year. Meanwhile, I think Roku is as strong as ever. Remember that we are invested in the Pay-TV ad dollars trend. Those who question Roku think we are invested for the cord-cutting trend. The cord-cutting trend began around 2005. The Pay TV ad trend began in 2017 and started to contribute meaningful revenue in 2018. This is critical to understand.
If Roku were only a cord-cutting stock, the 1.5 million net adds could be a concern although it’s still 28% year-over-year. This is why there is market weakness right now. Essentially, Roku is experiencing the same pull forward that Netflix warned about, which is that the customers interested in streaming and converting from cable did so during Covid.
Global User growth does need to get sorted, and I fully expect the management to figure this out. Just remember, that some of the best global stories come from the best domestic stories. Meaning, the teams doing well in the United States are the ones who expand to do well globally. We do have Magnite as a global CTV company but their angles are slightly different, which I covered in the LTBH webinar. Right now, Roku has expanded to Canada, Mexico, Brazil, Germany and UK.
Let me quote Anthony Wood on just how unafraid of Google he is:
We've been competing with large companies, including Google in our space for since we started, and we compete extremely well. And the primary difference in the way we compete versus Google as we built from the beginning, a software platform designed specifically for TV, whereas they take their phone, operating system, Android, and they ported it to TVs. So if you look at the history of computing platforms, whether it's windows on PCs, or Android on phones, or Roku on TVs, purpose built, operating systems traditionally have always won in terms of market share. And it's because, when you build something from the ground up for a new user environment, for new business models, it's just more effective. And so that's really the kind of where the source of our competitive advantage come from. And it's working well for us and has worked historically, you know, we compete extremely well, we're the number one streaming platform in the US by a pretty wide margin., a software platform designed specifically for TV, whereas they take their phone, operating system, Android, and they ported it to TVs. So if you look at the history of computing platforms, whether it's windows on PCs, or Android on phones, or Roku on TVs, purpose built, operating systems traditionally have always won in terms of market share. And it's because, when you build something from the ground up for a new user environment, for new business models, it's just more effective. And so that's really the kind of where the source of our competitive advantage come from. And it's working well for us and has worked historically, you know, we compete extremely well, we're the number one streaming platform in the US by a pretty wide margin.
You can apply the same thought process to Samsung.
In the meantime, keep an eye on ARPU becoming disjointed from user growth. For instance, this quarter it was up 46% year-over-year.
Five-year trend in ROKU’s ARPU metric
Sequential growth in APRU over last 5 quarters – note that 2Q21 was the fast pace of QoQ growth since ROKU went public.
ROKU’s YOY growth in ARPU – YOY growth has accelerated for 4 consecutive quarters
The thing to ponder is why is ARPU going up so much? Here’s why I think this is happening:
The most important statement Roku made in this earnings call was in regards to signing all 7 major advertising agencies and the transition of Pay TV ad dollars. The company is talking about signing upfront contracts for television advertising.
This is a long quote so bear with me bc it’s important on what they’re saying.
Regarding your question about the upfront, it was a pretty transformative upfront season for us. We closed it several months earlier than we have over the last couple of years concurrent with traditional TV networks. I think that's an indication that streaming has arrived as a first-class citizen in the way brands think about allocating their annual budgets, because it deals with all seven major agency holding companies and more than double commitments in terms of dollar basis. it was a pretty transformative upfront season for us. We closed it several months earlier than we have over the last couple of years concurrent with traditional TV networks. I think that's an indication that streaming has arrived as a first-class citizen in the way brands think about allocating their annual budgets, because it deals with all seven major agency holding companies and more than double commitments in terms of dollar basis.
So it's definitely coming out of the pandemic, increased urgency by marketers to follow audiences, especially amidst steep ratings declines. Nielsen reported a 29% decline among adults 18 to 49 year-over-year. But it's also a function of our scale and our capabilities, including one view which played a pretty prominent role, our ad platform, our DSP, and our data. And this upfront season as well, our ability to offer originals exclusive content, the performance of that content in the time since as well as our new brand – branded content studio offering really resonated with brands and stuff, it not just brought in a significant uptick in dollars and earlier commitments. It also brought in a significant new set of advertisers who had not yet committed with us in the upfront. Over 42% of our advertisers were first-time upfront advertisers with Roku. So overall, we're extremely pleased with how we did the upfront and also think it's a good Harbinger for how we'll perform throughout the year during the scatter period. Thanks for the question. But it's also a function of our scale and our capabilities, including one view which played a pretty prominent role, our ad platform, our DSP, and our data. And this upfront season as well, our ability to offer originals exclusive content, the performance of that content in the time since as well as our new brand – branded content studio offering really resonated with brands and stuff, it not just brought in a significant uptick in dollars and earlier commitments. It also brought in a significant new set of advertisers who had not yet committed with us in the upfront. Over 42% of our advertisers were first-time upfront advertisers with Roku. So overall, we're extremely pleased with how we did the upfront and also think it's a good Harbinger for how we'll perform throughout the year during the scatter period. Thanks for the question.
In the LTBH webinar, I went over OneView and how Roku will be monetizing audiences outside of Connected TV and onto mobile and desktop. You can find this on our Roku and Magnite LTBH webinar around minute 28:00. That slide in the webinar is important to revisit if you’re wanting more information about Roku’s strategic advantage as a Pay TV/CTV ad exchange that can monetize beyond its own audience numbers. This is technically Roku becoming a demand side competitor by leveraging first party data. By focusing on Roku’s audience, we are only seeing half the picture (Roku’s position on the supply side). By “demand side,” I mean the side of the ad transaction for advertisers. By “supply side,” I mean the side of the transaction for publishers. In this case, Roku is moving onto the other side to work directly with advertisers. This is a critical change in their story that began with OneView although it’s not surprising or unexpected as strong first-party data ad players who own the stack typically move in this direction (Facebook, Google).
There are other microtrend stats the management discussed that confirms our understanding of where we are in the trend for a Pay TV ad stock (i.e., remember, we are not invested for cord-cutting although it’s a nice-to-have. Similarly, we are in Fubo for live sports and the synergies with sports betting — not the cord-cutting trend that began with Netflix). The first is that Nielsen reported a 29% decline for traditional TV networks among 18 to 49-year olds. The second statistic is that only 39% have a streaming TV service. Roku echoed what we have published in the past, which is that “it’s all going to move towards streaming.”
The Roku Channel is also growing steadily with management stating, "In Q2, we continued to drive robust growth of The Roku Channel with streaming hours more than doubling year-over-year."
Financials Overview
By Bradley Cipriano
Roku’s Q2 sales increased 81% YOY to $645.1 million, beating consensus estimates by 4%. Revenue was driven by a 46% YoY increase in ARPU (now at $36.46) and a 28% YoY rise in active accounts (now at 55.1 million). The firm’s platform sales surged 117% YoY to $532.3 million, an acceleration from the 101% and 46% YoY growth rates in Q1 2021 and Q2 2020, respectively. In fact, this represented the fastest pace of YoY growth since 2017, demonstrating ROKU’s ability to scale its ad business. Importantly, we believe that ROKU is still in the early stages of scaling its ad platform, as the international market remains untapped.
Offsetting ROKU’s platform sales, its player sales increased just 1% YOY to $113 million. However, we note that this number is somewhat subdued as ROKU decided to absorb cost increases (due to a tight supply environment) instead of passing them onto the customer with higher prices. Since ROKU absorbed the price pressures, it reported a -$7 million gross loss in its player segment during this quarter. Importantly, ROKU operates its player segment close to breakeven, as management prioritizes user growth as it scales its ad platform. This is a wise decision by management, considering the acceleration in its ad platform discussed above.
The math also shows that this strategy is sustainable. For instance, ROKU lost $7 million selling its players during the most recent quarter. Considering ROKU nets ~$19.12 per user per year, ROKU can make up the $7 million gross loss in the next twelve months with just ~350k active accounts.
Since ROKU added 1.5 million accounts during the latest quarter, it will easily be able to offset this relatively benigngin loss going forward. Unfortunately, management expects the negative gross margins in the player segment to persist into 2022, which will eat into the firm’s profitability.
On the bright side, ROKU’s platform gross profit rose 149% YoOY to $345 million, easily offsetting the negative margins in the player segment. Consolidated gross margin improved 1,120 bps YoOY to 52%, well above the trailing 3-yr average of 46%. These results flowed down to ROKU’s bottom-line, as 2Q21 EPS increased from a loss of -$0.35 in 2Q20 to a profit of $0.52 as of the latest quarter, which also beat the Street’s expectations by 351%.
However, we believe that ROKU’s current earnings are temporarily inflated. This is because the firm made cost cuts last year due to COVID-19, and management disclosed that expenses will rise going forward as these cuts are unwound to support future growth. Furthermore, ROKU has spent $98 million on media content acquisitions this year, instead of developing this content in-house. This approach temporarily juices earnings since the $98 million acquisition costs are initially capitalized and expensed over-time. If ROKU had developed this media content in house, it would have incurred the expenses more immediately.
ROKU also allocated $47 million of the $98 million of content acquisition costs to goodwill, rather than to media assets. This trend cosmetically inflates ROKU’s earnings growth going forward because goodwill is never expensed to the income statement (it is instead tested for impairment) and hence, distorts the true costs of acquiring the content. Nevertheless, ROKU acquiring media content is akin to a drug manufacturer acquiring a bio-tech firm with solid Phase 3 results. The media acquisition allows management to quickly ramp ROKU’s original media content and to remain laser focused on its ad platform, which is crucial to ROKU’s success.
Looking forward, ROKU guided Q3 sales to $680 million at the midpoint, representing a 50% YOY growth rate which was 5% above consensus. Similarly, 3Q21 EPS was guided to be ~$0.06, above initial expectations of a -$0.22 loss. We expect ROKU to continue to report strong topline growth, especially considering its untapped international opportunity. For example, ROKU has been selling its players to international markets such as Canada, the UK, France, Ireland, Mexico, Brazil and will start marketing its players in Germany in H2 2021.
Magnite Summary:
Roku critics point towards lack of global growth and market penetration. My personal thoughts are that global is way too early to call right now and that Samsung and Google will likely have its hands full competing with Roku long-term in emerging markets. However, Magnite provides exposure to global CTV ad dollars and this has been clearly laid out in our thesis both in our written reports and our LTBH 1-hour webinar. Magnite is our global CTV pick, essentially. With that said, the long-term growth rate of 25% from the company seems low and it’s my hope that the company is setting expectations correctly and plans to easily beat this guidance following its string of acquisitions.
The one thing about ad-tech companies like Magnite is that they use a lot of jargon in their earnings calls. I’ll help simplify the main points before we go into the financials.
Magnite is exposed to desktop revenue, reported under OLV revenue (online video). Therefore, it’s a big win for Magnite that Chrome is pushing out the removal of third-party cookies to 2023.
On the product front, Magnite is now an ad server on top of being a Supply Side Platform (SSP). Strategically, this allows Magnite to compete with FreeWheel and Google and helps them maintain their position “as the largest independent programmatic CTV marketplace.” The SSP allows for programmatic and private market place bidding while the ad server stores the creatives and serves the ads. The SSP facilitates the selling/bidding (auction) while the ad server actually manages, stores and serves the ads. SpringServe is the acquisition that resulted in an ad server for $31 million. The acquisition came from SpotX’s option to buy.
Here’s the flow when you visit a website or watch a connected TV app/show: The page or app calls the ad server, a bid request is sent to the SSP, the SSP auctions off the space to demand-side platforms and ad networks, the winning bid sends its creatives to the ad server, the ad appears on the site you’re viewing or the connected TV show you’re viewing.
In this case, Magnite now owns the full stack. The goal is to give small-to-medium sized publishers even less of a reason to work with FreeWheel and Google.
Overall, management continues to echo our understanding of Magnite’s positioning. They pointed towards India and Asia as markets the company is focused on. The company also repeated it’s discussion of private marketplaces and why an independent SSP on CTV can do well here compared to a public auction marketplace.
I’ve gone into detail on this point in the past, so I won’t elaborate fully here other than to paste this quote:
“With the traditional TV upfront season recently concluded, I’d like to clear up confusion regarding how we participate in these upfronts. Direct-sold and upfront refers to who is doing the selling, but direct and upfront deals increasingly include programmatic media spend commitments, because buyers and sellers want to realize the workflow efficiencies and targeting gains that programmatic provides.
So, how do we participate in upfronts and direct-sold CTV? First through private marketplaces, where our platform serves as the pipes that connect buyers and sellers. As you may recall, a substantial majority of our CTV revenue comes from PMPs. In supporting PMPs, our textures as a self-service productivity and workflow tool to efficiently execute CTV campaigns. We also participate in direct-sold inventory through our managed service business, which provides demand facilitation and serves as a great onboarding source to get buyers into the programmatic ecosystem.”-CEO of Magnite on Q2 earnings call
“However, Connected TV inventory is unique as the inventory is premium and goes for $25 to $40 for placements on a private marketplace. This means that publishers will work with maybe one or two SSPs total as the private marketplace does not result in higher bids because the pricing is already agreed on.
SSPs and DSPs especially come under pressure because they don’t own the audience. However, Magnite is leveraging a few key strengths, such as becoming the primary independent SSP in the Connected TV arena. On the earnings call, the management stated that it would be hard for other SSPs to compete at this point, given the unique private marketplace environment of Connected TV. This is due to Magnite’s acquisition strategy, and we see the effects of this in the Disney partnership, where Magnite is the obvious choice on the supply side.”
The takeaway is that investors in Magnite, like ourselves, should understand that the bids occurring on private marketplaces is partly why Magnite can do well in the CTV environment whereas display ads online became highly competitive in an open marketplace.
Financial Analysis:
By Bradley Cipriano
In the prior quarter (1Q21), MGNI reported results that were underwhelming when compared to ROKU’s strong 1Q21 print. However, during the 1Q21 Conference Call, CEO Michael Barrett explained that growth had started to rebound in Q2 and that “all was well”. CEO Barrett’s comments were confirmed when the company reported 2Q21 results on 08/05/21, as 2Q21 sales increased 170% YOY to $114 million, 22% above the consensus estimate.
However, due to the impact from recent acquisitions, reported sales are not comparable to the prior year. As a result, MGNI also disclosed that adjusted pro-forma quarterly sales increased 79% YOY to $100 million, which assumes that acquisitions were closed last year and also adjusts for traffic acquisition costs (TAC). On a segment basis, CTV pro-forma sales increased 108% YOY to $34 million, while on-line video and display pro-forma sales increased 60% YOY to $66 million. Due to nuances in GAAP accounting following MGNI’s recent acquisitions (discussed below), we believe that adjusted pro-forma sales are the best metric to use to measure MGNI’s true growth rate in the near term.
MGNI’s financial results continue to be tough to analyze from a financial perspective. This is due to all the moving pieces, as the company has made a series of transformational acquisitions in the past year and a half, which has complicated YOY comparisons. Nonetheless, these acquisitions have positioned MGNI to benefit from the rise in connected TV (CTV) ad spend and the industry-wide migration from direct ad sales to programmatic ad auctions.
For instance, MGNI recently closed its $1.2 billion acquisition of SpotX on April 30th, 2021. MGNI stated that “following the Telaria Merger and SpotX Acquisition, we believe that we are the world’s largest independent omni-channel sell-side advertising platform, offering a single partner for transacting globally … and the largest independent programmatic CTV marketplace … allowing buyers access to a global, scaled, independent alternative to "walled gardens," who both own and sell inventory and maintain control on the demand side”. We had also discussed back in April that the SpotX acquisition will allow MGNI to rapidly expand internationally, which should support increased growth and margins going forward.
While the SpotX acquisition positions the company to succeed in the CTV ad market, it also unfortunately complicates MGNI’s accounting. For example, SpotX recognizes sales on a gross basis, while MGNI had previously recognized most of its sales on a net basis (net of TAC). As a result, the company has reported an adjusted pro-forma growth rate to help investors better gauge MGNI true topline growth rate.
Moreover, since SpotX recognizes sales on a gross basis, this can artificially dampen MGNI’s reported gross margins, as the topline is inflated while gross profit remains static. As well, accounts receivables are accrued on a gross basis, which makes MGNI receivables balance appear severely outsized relative to sales. A ballooning receivables balance can signal that a company is pulling forward sales, which is a negative trend and something investors tend to avoid. We suspect that MGNI’s complex accounting is having a temporary negative impact on MGNI share price, due to a subdued gross margin and an inflated receivables balance. However, these concerns will likely dissipate as MGNI’s results start to annualize and the Street gains a better understanding of MGNI’s future growth prospects.
At the moment, the Street is dependent on management’s adjusted, pro-forma metrics. Looking forward, management guided for 3Q21 sales (excluding TAC) to be $115 million at the midpoint, representing a 15% sequential rise in sales (89% YOY). Management also guided for 3Q21 CTV sales of $43 million at the midpoint, which represents a robust 27% QOQ growth rate (307% YOY).
During its Q2 Conference Call, management explained that its long-term expected growth rate (ex-TAC) will be ~25% with 30% to 35% adjusted EBITDA margins.
As a comparison, TTD reported that its Q2 sales grew 101% YOY to $280 million, while the company guided for Q3 sales to grow 31% YOY (1% QOQ) to $282 million with a 35% adjusted EBITDA margin. TTD did not provide long-term guidance.
Vuzix committed the two cardinal sins for an earnings report — which are: 1) a big miss and 2) vague guidance.
Before I go into those issues around the earnings report, I want to point out that the company is actually on the right track. This is a technology that had zero adoption for decades and our report outlined that the medical industry is likely the right industry for Vuzix to see early adopter traction. You can read our previous coverage here where we point towards the medical industry as a main driver: https://io-fund.com/premium/ar-vr-h2-2021-update-and-vuzix-deep-dive
The company reported 240% growth in surgical eyewear sales in the most recent quarter. The earnings call listed many medical corporations and hospitals who are using Vuzix and will continue to buy more from the company. This market is expected to be in the $6 billion range by 2025. If Vuzix owns 8% of the market, that will be $500 million in revenue. It’s looking like that will be reasonable for Vuzix as they are doing well in this this industry in terms of early adoption. Perhaps it’s contrarian right now in the face of a terrible earnings report, but I believe the medical industry and manufacturing are (indeed) moving forward on augmented reality and will require hardware (smart glasses) for this rather than a mobile phone (Apple’s iOS).
We were very early to Unity with coverage at IPO regarding its augmented reality potential. As I write this, the company reports today. If you’re a Unity investor, you’ll need to ask yourself if it’s for AR gaming or AR enterprise. I’d say at least 50% of Unity’s story is for AR enterprise. If you agree with me (read my report here), then keep in mind, enterprise AR will not be displayed or utilized on a mobile phone. As you know, we plan to revisit Unity after we get more information on how IDFA affects the company as gaming is primarily driven by app downloads on iOS. So far, most companies are saying the impact has been delayed so not sure what we will get today AH.
My concern with Vuzix is not its long-term potential. I think the company will be firmly on the map after a few quarters. AR enterprise is a viable market for tech investors to consider, and as I’ve stated in this intro, AR enterprise requires glasses. Snap has a loophole with Apple’s iOS which is why we recommended this one many months ago but what you’re seeing with Snap now will eventually be seen across the entire AR market.
There is no way around the fact that AR will require hardware. That’s not my concern with Vuzix, rather it’s whether we are parking our money in a stock that won’t give us gains in the next 5 months. This is because we have to compete on performance. Therefore, if we close Vuzix, we will likely re-enter early next year. Right now, we are not closing Vuzix rather it’s up to Knox and his chart work (he is laying out a plan for the forum). My understanding is that his thoughts are that he prefers to catch the company on an uptrend.
Vuzix Earnings: Unpacking the Disappointment
I actually don’t mind if a small cap stock that is taking on a sizable TAM has a big miss as long as the key metrics I’m tracking come in strong. Smart glasses grew 21% and as stated the industry where Vuzix is likely to see the most sales were up 240%. Medical sales makes up 25% of revenue.
The company’s official reported that the sales of smart glasses for the three months ended June 30, 2021, rose 21% in the period to $2.8 million led by a 22% increase year-over-year in unit sales in the M400 smart glasses and a 77% year-over-year increase in Blade smart glasses revenues.
There was certainly an increase in expenses with R&D up 50% and sales and marketing up 164%. This is despite engineering services declining from $600,000 to $300,000 (we aren’t invested in the company for engineering services so no matter to us on this).
What bothers me is a lack of guidance. As an investor and shareholder, I’d like some idea as to what a company is expecting in terms of sales. This is all we got:
Christian Schwab
Hey, good afternoon guys. Thanks for the slide presentation. I guess when I'm looking at Page 4 of the slide presentation and in the commentary and the prepared comments, I'm just trying to figure out, can you give us a range of revenue outcome that you expect for the year in 2021 and what type of growth rates we should really be thinking about in the second half of 2021 versus the second half of 2020?
Grant Russell
Yes. 2021 should continue to see consecutive growth as we move from our second quarter. Some of the business in the second quarter was timing related, frankly. That said, none of the SaaS-based software that we expect ultimately will start to add to the revenue stream. I would count in a second, especially in the third and fourth quarter of this year, even though some might be there. So you're probably going to be a little bit softer match. I think it's right in line, Christian, with the numbers that we discussed in the past. I think you look at the 3 million to 4 million units for the kind of a numbers, and then more in the fourth quarter.
Christian Schwab
Okay. Okay.
Grant Russell
That’s hard forecast there. Sorry.
Christian Schwab
Yes. No, I appreciate that. I guess if we sum up those numbers, I mean, could Q4 be big enough to do $20 plus million this year? Is that a little bit too optimistic and it may take too many things going in the right direction right now?
Paul Travers
It would take some things going in the right direction. I mean, it's not impossible to see that some of the business we had could do that, but I mean, I can't, we certainly would not give that advice right now, because there's question marks on the timing for it. And unfortunately, this industry is zero down. It's coming. You can see it, our business continues to grow and move forward. And the size of some of the things that we're talking about are getting bigger and bigger without doubt. It's only a question of, is it this month, the next month, in and out based upon the timing. Yes. It could be there Christian, but we'd have to really work to make that happen.
Knox has been pretty clear on the forum that small caps are out of favor. When this sector is out of favor, it can be brutal. When the sector is in favor, investors run around withbe in a state of FOMO. We want exposure to some small caps because there is outsized reward when you do well in this category. We don’t see any nefarious issues here with Vuzix and we don’t think this quarter defines the opportunity. With that said, we are using purely technicals at this point to determine if we remain or exit the position. We do this with most momentum stocks and I’m stating this as more of a reminder than anything unique to Vuzix.
Below, we update the leaders in this space with a concentration on a small cap that is breaking grounds in areas where big tech is struggling – primarily the intersection of enterprise use cases and smart glasses, which are lighter weight and more ergonomical compared to headsets.
AR/VR Macro Overview
According to new statistics published this week, AR/VR is set to grow at a CAGR of 46% between 2021 and 2025 worth $162.71 billion of incremental growth. The growth in 2021 will be 25.13% implying the larger growth will come from the second half of the five-year period.
For virtual reality, Emergen Research points to gaming arcades, theme parks and medical training as key markets for headsets. For example, Snap has partnered with Disney to deliver VR to their theme parks and Vuzix is making key entries into medical training.
Head-Mounted Displays account for the second largest share as it provides an immersive environment for training purposes. The virtual reality market by itself is expected to grow at 27.5% to reach $43 billion by 2028.
The third driver for VR is robotic surgery, surgery simulation, and skills training. Vuzix overlaps in two markets – medical training (#1 driver) and surgery (#3 driver).
The report from Emergen also highlights APAC leading growth over North America. This is due to favorable government initiatives and the rapid rollout of 5G. We cover 5G in a separate section below as these two trends are intricately connected.
When we break the market down further for Vuzix’s sake, the estimate for smart glasses is at $33 billion by 2027. Statista also confirms healthy revenue growth for consumer and enterprise smart glasses in the near term, going from a nearly $0 market in 2019 to $13 billion in 2024.
Those leading AR/VR will have defensible positions based on being first movers. Artificial Intelligence, on the other hand, will like see a period of mergers and acquisitions as the bigger companies cherry pick innovation from the private markets (to compare the two).
The takeaway, is that we could see an influx of institutional interest in AR/VR this year if we see key companies break ground. It feels early because you and I are not using AR/VR in our everyday lives. This is why we need to be very careful to not use confirmation bias when choosing our investments. We also need to be prudent in knowing exactly what markets our AR/VR stocks are cornering as this market is tough to crack. The “what” is not as important in this case as the “how.”
Below, we revisit the larger companies in the space and we end with a deep dive on Vuzix. We expect to build our largest positions in Snap and Vuzix for now, and Unity later in the year or early next year, when we see signs software is reaching enough hardware.
AR/VR: Tough Nut to Crack
The caveat to AR/VR being a 0 to 100 market as we stated in the Unity PDF, is that the trend is very tough to crack. The most notorious failure is Google Glass yet Oculus hasn’t exactly crushed it since the $2 billion acquisition either. Facebook is losing money on the Oculus Quest 2 with some believing this is because they will make up for the losses with software. My personal opinion is that it’s tough to get consumers to adopt AR/VR and the price is being lowered to reflect this. Regardless of the reasons, these are two very capital efficient companies with thousands of engineers and large R&D budgets who have not done well in this trend.
Apple seems to be sleepy here, too, in terms of hardware with a headset rumored for 2022/2023 and smart glasses sometime after the headset. We see Apple foreshadowing the importance of AR/VR for the company in the ongoing augmented reality iOS updates, especially in iOS 14 along with the iPhone 12’s LiDAR that we covered in-depth here. We cover iOS 15 updates below.
Here is the “reality” to virtual reality:
1. Distribution is tough; people simply don’t want to put on a headset for entertainment.
2. If you’ve ever used a headset, you know the lack of 5G creates the obstacle of latency.
3. The demographic needs to be right; this technology requires early adopters who are keen on new experiences.
4. Consumers will be second to the enterprise to adopt AR/VR; meanwhile, the tech giants are broadly positioned across many demographics and are primarily consumer companies. In contrast, Microsoft’s HoloLens is likely seeing early success due to Microsoft having more exposure to defense and aerospace than its competitors.
5. Investors shouldn’t ignore the trust issues around FB and GOOGL. In fact, both Apple in ad campaigns and Snap in the earnings calls are capitalizing on these issues by emphasizing privacy with their software. We will see if this translates to consumers preferring smaller brands for AR/VR or those that place privacy first.
In reference to the list above, we want to circumvent the need for consumer buy-in by focusing on:
1. Lightweight hardware bc headsets are a tough sell
2. Early adopter industries
3. The availability of 5G
4. The right demographic
“Snap, Inc is a Camera Company”
The first slide of the Investor Presentation from Snap says it all: “Snap, Inc is a Camera Company.” Look for Snap to evolve away from social media by leveraging the lens software seen in the app today.
In February of this year, Snap had 150,000 lens creators globally, which is not a bad start considering Apple came out with the first features in 2017 with a bigger push when the iPhone 12 was released with LiDAR last year.
By the Partner Summit in May, Snap had updated the number of global creators to 200,000 at the Partner Summit in May, or 33% growth sequentially. I’m very keen to see what this number is by this time next year. 1 million lens creators should be tipping point and I imagine will connect the dots at that time as to the potential Snap has.
Snap is making it clear that the camera is the company’s biggest opportunity due to augmented reality Lenses. The CEO stated, “In the past few years, our substantial investments against our vision for augmented reality have put us in a position to lead the industry, and we’re doubling down on this strategy in 2021.
Augmented reality has evolved from something fun and entertaining into a real utility. Our camera can solve math equations; scan wine labels to find ratings, reviews, and prices; tell you the name of the song you’re listening to; and so much more… And we’ve barely scratched the surface of what’s possible.”
From the list above, #2 is demographic, and this is the primary reason Snap has true staying power. I had said in the Top 10 LTBH webinar that I’ve been watching this company closely because Millennials are a demographic we want exposure to. We first covered Snap for the premium site in July of 2019 when I was anticipating the launch of the Audience Network product. Audience Network didn’t happen, and instead, something much bigger is coming down the pipe.
The company boasts 90% of the 13 to 24-year old population in the high-spending regions of the United States and leading countries in Europe. Millennials and Gen Z have very high purchasing power with a combined value of direct spending power of $1 trillion. As Snap points out on slide 6, Millennials “are expected to drive over half of the increase in expenditure growth over the next decade.”
Snap held its Partner Day on May 20th when the company announced the launch of AR-enabled spectacles for creators only (not for purchase). The frames feature four built-in microphones, two stereo speakers, and a built-in touchpad. The frames have front-facing cameras to detect objects and surfaces for interacting with graphics (such as when Snap’s CEO caught a butterfly during the presentation). The glasses weigh 134 grams and can be worn indoors or outdoors. There is also a feature called Connected Lenses that allow for multiple people to interact.
The key thing to understand is that Snap is leading in the area of software due to its mobile phone Lenses and Snap’s software should continue to lead with its growing community of creators.
The NFL is an example of a brand that has partnered with Snap during the Superbowl when customized team lenses were offered. Another example is Disney, who is using Snap’s Camera kit to build geo-located branded lenses for its theme parks. Sticker kit offers the ability to build personalized Bitmoji avatars into games and Snap Map allows for geolocated AR experiences.
Brands embrace AR because it leads to higher engagement in ads. Dior recently partnered with Snap and saw 3.8X higher return on ad spend and 6.2X on Lens Carousel.
Management anticipates the advertising inventory potential for a fully integrated AR camera application within Snapchat will potentially lead to a flywheel effect:
We still have a lot of upside in terms of the level of optimization and efficiency that we can deliver, and are investing heavily across the board to both improve our ad platform and support our growing global advertiser base. This has developed into a positive flywheel where our improved efficiency has driven more advertisers and larger budgets to our platform, leading to more impressions and learnings, which in turn increases the rate at which we are able to further improve efficiency and ROI.
Despite all of the very important points made about Snap, the main issue is when consumers will adopt AR/VR hardware. Here is the statement the CEO made in 2019 on timing: “So I think it’ll be roughly ten years before there’s a consumer product with a display that could be really widely adopted.”
Experts from Gartner agree it can be a five to ten-year process before we see a big consumer hit in terms of hardware in this space.
This is why the iPhone and iPad are critical for Snap’s immediate-term distribution. Brands will pay for iOS users and Snap can build new revenue streams right now even without a widely adopted consumer hardware product.
iOS 15 Update: AR/VR
For the next 1-2 years, we are primarily interested in iPhone upgrades and iOS updates for our Snap position. In fact, the iPhone 12 release with LiDAR was probably one of the more bullish things to happen for Snap in its history as a public company. You can view some cool examples of how Apple’s LiDAR works here.
The latest version of Apple’s operating system added new experiences for FaceTime including Spatial Audio to position the location of sounds heard in a video call. Maps has added AR-enabled turn-by-turn walking directions and there are improved Siri features and voice input. This allows Safari browsing and other applications to be used by voice control. Visual lookup and live text allows you to dial numbers and recognize objects by looking them up online.
For developers, the release featured object capture for developers to create AR objects by taking pictures of the physical item to help speed up the time it takes to make virtual content. Spatial Audio was opened up to third-party developers and gaming also got an upgrade.
Apple’s N301 Prototype
According to reports, Apple plans to release a development kit and limited number of AR/VR headsets available as early as 2022. The prototype is named N301. The AR/VR chips have beat the M1 Mac processor in testing as Apple will attempt to deliver something with higher resolution than the competitors. Apple also plans to release AR glasses with codename N421 which could be unveiled as soon as 2023. The headset is not the final product, however, as Apple’s final consumer product will be smart glasses.
The beta headset is the size of the Oculus Quest, according to sources that spoke with Bloomberg. There are cameras to enable the AR features and gesture control. Apple has also been making acquisitions, such as NextVR, that records events such as concerts and sports games. Apple will also build an App Store for the device known as “rOS.”
Releasing AR/VR glasses will require years as Apple will be testing and iterating on how to serve the creation of app developers and how to overcome the hesitancy of consumers who don’t care to wear hardware on their face. There is also the technical challenges of supporting an internet connection with a long battery life and the various electronics that are required. As the article points out, “getting to that point requires years of work on lenses, hardware and software, component miniaturization, production techniques and content creation.”
The statement and general understanding that smart glasses are years out is one of a few reasons we like Vuzix, who is already delivering smart glasses to early adopter industries.
Unity:
In our analysis of Unity, we saw many forecasts that AR/VR would grow from nearly $0 to $100 billion in a short time frame of 3-5 years, depending on the source. We had stated in September that Unity will be a great way to participate in this trend as the company could have a near monopoly on 3D application development.
Notably, Unity and Snap are teaming up for in-game ads. The partnership allows Unity developers to use Snap Kit and tools like Snap Map, Bitmojis and other AR features. In return, advertisers on Snap can also access Unity’s inventory. This is likely the start of an important synergy on AR-related advertising across gaming and social media audiences.
Meanwhile, Unity’s primary competitor, Unreal Engine by Epic Games, is in a heated battle with Apple. This bodes well for Unity as this battle could be viewed as a risk by AR/VR app developers who want to get on Apple’s devices.
In this study done in 2019, Unity was the third most popular AR mobile platform ahead of Facebook and Amazon. ARKit from Apple is number one and ARCore from Google for Android was number two.
With that said, software will need ample hardware distribution. Therefore, we think Vuzix could see AR/VR growth sooner than Unity. We have a placeholder position in Unity, however, will look for bigger positions in Snap and Vuzix in the more immediate term.
Vuzix: Lightweight Glasses for the Enterprise
What Vuzix offers are smart glasses that are lightweight, comfortable and wireless. The company has two main products: the M4000 and the M400 wearable computers (or smart glasses). The products are backwards compatible with the M400 applications working on either device.
The M4000 Series is lightweight at 3.5oz[1], which the company says is comparable to a deck of cards. The upgraded wearable allows for see-through display and is powered by a lithium polymer battery that you can switch out during long jobs without powering down. The run time is between 2 to 12 hours depending on the battery choice and application. Other specs include PDAF 12.8mp auto-focus camera and 4K 30fps for video streaming output. The cost is $2499.
The M400 Series is the base model and drove the most revenue growth in the recent quarter with sales that tripled YoY. This model offers gesture control, voice commands and a high-performance camera for video streaming. This model also allows for a battery swap without powering down. Price is $1799.
Vuzix M4-Series is run on Android and uses the XR1 Qualcomm Snapdragon processor for AR and 4K phased-detect auto-focus camera. The glasses are IP67-rated, which means they’re waterproof and dust proof. The lightweight glasses are ideal compared to a bulky headset for industries ranging from medical work to utility work to automotive.
This has led to the adoption of the glasses for surgeries. Here are some of the recent partnerships Vuzix has made:
· Medacta International is using Vuzix glasses and the NextAR platform for knee, shoulder and spine applications. The platform uses algorithms alongside the preoperative scan to create a personalized biomechanical model for each replacement.
· Rod & Cones placed $1.2 million in orders for the M400 Smart Glasses “beginning immediately” to provide 4K broadcast imagery that allows more supported surgeries in a single day.
· Pixee has achieved FDA approval to use the M400 smart glasses for total knee replacement surgery. Pixee’s platform allows surgeons with little robotics training for better positioning of instruments using the field of view provided by Vuzix smart glasses.
· Medtronic uses Vuzix in the operating room and to also allow visiting surgeons to have the view of the operating surgeon for training purposes.
Here is a snapshot of the health care customer list which accounts for 25% of Vuzix’s revenue in the most recent quarter:
The company also mentioned a leading insurance company has become a customer with a $400,000 order and CooperVision is a manufacturing company that uses Vuzix for their warehouses.
Vuzix recently announced an advanced microLED display-based technology to be released in Q2 2021. The video here shows the microLED is the size of a pencil eraser and can be used in cameras, smart glasses and helmets.
Vuzix’s release of a microLED is important because weight is a primary issue with AR/VR hardware and an area that Vuzix is well ahead of Big Tech. This is one of 191 patents the company holds.
5G is Critical for AR/VR
Please note, we covered 5G on the premium site in anticipation for ramping up in 2020. Most 5G rollouts are delayed from Covid yet we are keeping an eye on this area. You can access 5G reports by going to the Dashboard on the Premium site and typing in “5G” in the search bar.
Commercialized AR/VR is a big challenge as the devices require heavy rendering, on-device processes and split workloads between the device and edge cloud. Because 5G is 100 times faster than 4G, the success of AR/VR is linked to the success of 5G.
For the optimal experience in AR/VR, graphics are ideally rendered on the edge cloud to reduce latency for on-device head tracking, controller tracking, hand tracking, motion tracking and photon processing. The ideal split rendering process in the cloud requires 5G in order for the intended, final experience.
Therefore, not only will it take ten years for consumer hardware to reach critical mass, yet it’ll take equally as long before 5G consumer networks are set up for network slicing on top of public networks with edge cloud infrastructure and also native core functions. Undoubtedly, telecom companies will own this space as they will own the 5G network. Qualcomm is seeing some early mover advantages in on-device processing for the headsets and Nvidia is seeing the early mover advantages across its RTX graphics processing units (GPUs), CloudXR and GPU virtualization software for the edge cloud VR servers.
With that said, urban areas are already set up for 5G with small cells in cities. Hospitals will be one of the first in terms of facilities to be 5G-enabled due to the immediate impact that will be seen in remote surgeries, the transfer of large files, and real-time monitoring. In a smart hospital, AR/VR, AI and robotic equipment that is linked to databases and sensors can aid in complex operations by recommending procedural steps based on the latest medical knowledge and data.
5G-enablement in hospitals was beginning to pick up prior to Covid with the first VA hospital in California becoming 5G-enabled in February of 2020. The first academic health system in Chicago, named Rush, is also a pioneer for 5G connectivity in medical facilities. Many forecasts project APAC to lead 5G including for hospitals and medical facilities. In January of 2000, Samsung and KT Corporation announced a partnership to build a 5G smart hospital.
Vuzix works with either 4G or 5G and has even struck partnerships with last-mile connectivity company Inseego on 5G (we covered this company here on our premium site). Vuzix is also an early partner with Verizon on Blue Jeans where the smart glasses offer support for the remote collaboration platform. Zoom Video has a blog about how AI, AR and VR will impact meetings written in 2018.
KDDI Asia is another early 5G partnership that Vuzix has with the relationship focused on remote support, facial recognition and language translation. KDDI Asia is a Fortune 3000 company that has 40 million mobile subscribers in Japan and Singapore.
Why the Enterprise is Important:
Enterprise drives 2/3 of the current revenue in AR/VR and is expected to lead through the forecast period, according to ARInsider. The forecast made in 2017 specifically points towards hardware as the main contributor as it sets up the install base for software to follow. According to more recent data, the enterprise is expected to generate more than 70% of AR/VR revenue through the end of 2022. (Please note, some of this needs to be adjusted by a year due to Covid delaying this category).
Here’s a snapshot from Perkins Coie as to the leading sectors in AR/VR:
Although a bit outdated, this article on Medium drills down into the challenges around consumer AR/VR and why enterprise will be the first market to adopt the technology. It helps solidify our understanding, which is that consumer AR/VR is a nice-to-have while enterprise is a must-have. According to the survey of 750 respondents, 88% said AR/VR had a positive impact on their business.
Financials:
As stated in the blog from Monday, the company is small in terms of revenue and market cap. Last quarter’s revenue was $3.9 million compared to $1.5 million in the year-ago quarter, or an increase of 156%. Smart glasses sales rose by 177% year-over-year to $2.4 million. The company was break even in terms of gross profit in the past yet posted $1 million in profit in the most recent quarter.
We also pointed out that gross margins are slim at 28% with product gross margins at 45%. As with many small cap companies, the bottom line is a bit ugly as the company has a net loss of $6.6 million. If the company continues to grow the top line, then some of this should resolve on its own as R&D is around $2 million per quarter and sales and marketing is $1.2 million.
Despite being a small cap, the company showed significant improvement year-over-year:
The company closed a public offering of 4,768,293 shares on April 1st for $97.75 million. The shares were priced at $20.50 while the stock was trading at $24.85. The companies proforma cash is $145 million as of April 1st. As with most small caps, the balance sheet and the need for future capital raises is the primary risk. Not only is this a concern for us investors but for larger customers who are buying into Vuzix’s technology and deserve longevity.
In addition to hardware, the company sells software for recurring SaaS revenue. This doesn’t drive meaningful revenue now but good to know there are more revenue streams in the future: “We expect that in the future, for every hardware sale that includes one of our vertical SaaS solutions, we would see an even more significant recurring revenue stream from the application itself.”
There are larger OEMs in the negotiation phase, including a Tier 1 aerospace and defense contractor in Phase 4 of contract negotiations for the company’s Waveguide-Based technology. An example of a completed OEM partnership in production phase is with Jade Bird Display, which manufacturers LED panels.
On June 9th, it was announced that Vuzix will be added to the Russell 3000 and Russell 2000 indexes on June 28th.
Valuation & Risks:
Valuation is an important risk to discuss with Vuzix. The company’s forward price-to-sales was a whopping 85 before correcting to the 50-60 range. This means the company competes with Snowflake and UiPath for the highest valued company in our portfolio.
However, when we look at 1-year forward P/S, then Vuzix looks more attractive at 28 whereas Snowflake trades at a 1-year forward P/S of 40. The consensus among the three analysts covering Vuzix is that revenue will roughly double year-over-year in 2022 at 90% growth from $22 million in fiscal year 2021 to $42 million in fiscal year 2022 ending in December.
We covered AR/VR in Q3 2020 and this was when we estimate the trend began with iOS 14. If the smart glasses market will be $13 billion by 2024, then Vuzix only needs to own 1/26 of the market to 10X revenue if we figure $40-50 million in FY 2022 and we invest in this company with the goal of reaching $500 million in revenue by 2024.
When a small cap has this kind of valuation, there is more pressure for the small cap to perform. The last earnings report had a slight $0.02 EPS miss and a beat on revenue, yet the stock fell from $17 to $15 off the report.
Investors in this company should be aware that this company has a streak of missed earnings estimates between 2016-2019.
There is about 18% institutional ownership, which is on the low side, although 3% increased institutional ownership in the past month.
Intel bought 30% ownership of the company in 2015 and gradually reduced its share of the company to 15% before selling all shares earlier this year. The loss of a large backer is a risk.
Competitors:
Vuzix has many competitors if you look at the broader AR/VR market. Specifically for the enterprise market, the main competitors are Microsoft’s HoloLens and Magic Leap, which has Google backing. Here’s a picture of Vuzix compared to those two, as seen in ZDNet.
Vuzix will need to work diligently to own 1/26 of the market, but as you can see above, it’s a doable. goal. We like the 24 years of experience the management has as it’s usually seen in these incremental product improvements over the competitors. For instance, according to some product analysts, Magic Leap One is inferior in terms of battery life offering only 3 hours before needing to power down the device to change the battery. We also put in a footnote above the comparison in weight to Apple and Microsoft with Vuzix being the lightest smart glasses among the top competitors.
Conclusion:
Enterprise (check).
Passionate and long-term Founder (check).
Early adopter market – medical industries, etc. (check).
Lightweight able to overcome the major hurdle of headsets (check).
Small caps are not without risk. However, we like that enterprise AR/VR is becoming a post-covid play and the forward consensus in the 90% range is certainly investable. We understand that Vuzix and our other small caps will be volatile at times, yet to get a $1 billion market cap entry into this space is worth the risk, in our opinion.
Founded in 1997 (yes, 24 years ago), Vuzix was the first company to release a AR/VR headset for the military and also the first to release a headset for consumer purposes. When we talk about being too early to a trend, we don’t typically mean 24 years too early, yet this is the case with Vuzix. Between now and then, the company has worked with Raytheon on digital night vision for weapons and has also contracted with DARPA to develop heads up display for military ground personnel.
Intel bought 30% ownership of the company in 2015 and the company partnered with BlackBerry in 2017 to deliver smart glasses for enterprise companies.
Fast forward, and Vuzix is becoming the smart glasses of choice for industries that are early adopters of the technology – primarily the medical field. This past month has been busy for the company. John Deere announced the company is using the Vuzix M400 smart glasses to provide remote support. The M400 and M4000 received clearance for medical training this past week and the company also received over $1.2 million in new orders from Rods and Cones for virtual surgical collaboration. There are many press releases in the medical industry that I will discuss in the full-length report, these are only the most recent.
The company is small in terms of revenue and market cap. Last quarter’s revenue was $3.9 million compared to $1.5 million in the year-ago quarter, or an increase of 156%. Smart glasses sales rose by 177% year-over-year to $2.4 million. The company was break even in terms of gross profit in the past yet posted $1 million in profit in the most recent quarter.
Regardless, gross margins are slim at 28% with product gross margins at 45%. As with many small cap companies, the bottom line is a bit ugly as the company has a net loss of $6.6 million. If the company continues to grow the top line, then some of this should resolve on its own as R&D is around $2 million per quarter and sales and marketing is $1.2 million.
The company closed a public offering of 4,768,293 shares on April 1st for $97.75 million. The shares were priced at $20.50 while the stock was trading at $24.85. The companies proforma cash is $145 million as of April 1st.
Here is how the company’s growth has looked over the past few quarters:
We began writing about this trend in Q3 2020 to discuss the start of this trend and that timing looks aligned with the graph above. Point being, I can’t imagine growth would be very impressive coming from any company in the AR/VR business until around Q3 2020 and so it seems like Vuzix’s growth is right on time.
The earnings call discussed there being “increased inbound interest in order flows related to the reopening of the economy” as industries such as logistics, warehousing, retail picking, e-commerce and third-party logistics are looking for “many 1000s of units.” The company explains that their technology increases worker productivity and can contribute to healthier margins. I find it interesting that AR/VR could be a covid rebound play. This is a bonus as the trend was set to take off around this time with or without covid.
The company also has a partnership with Verizon although this is not meaningfully adding to revenue at this point.
I’ll expand more on Vuzix soon as we are clearly focused on AR/VR as a fund. We were early to Unity and have discussed in detail our views on Snap – most recently in the LTBH webinar.
Knox likes the chart so he will probably enter soon.
We made a point to cover Shopify last December to emphasize that we did not believe the company was covid-dependent. We spelled out exactly why we were writing a second LTBH PDF on the company during a time of doubt for “covid stocks” (and during the exuberance for small caps).
Most importantly, the trends we outlined in December were recently confirmed in the most recent earnings report. This is what we want to see – analysis that gets in front of results so that we can confirm our ongoing conviction and increase our position (transparently with real-time trades).
The reason we want to increase our position in Shopify throughout the year is fairly straight forward – Shopify is now reaching billions of consumers through social media. The distribution potential of these partnerships reminds me of an avalanche trigger as Shopify will reach billions with Facebook and Tik Tok and hundreds of millions with Pinterest. Now, they only need to build out the Fulfillment Center and focus on improving their own app; although borrowing these mega size audiences is probably the fastest path to growth for our purposes.
I don’t believe Facebook will let Shopify dominate its platform, so keep an eye out for attempts to strengthen Facebook Marketplace. I’m not too worried because Shopify has merchant relationships and it’ll be hard for Facebook to replicate their business model although they may certainly try.
Here are some highlights regarding Social Commerce from the call:
· “The number of shops actively selling on Facebook Shops has more than quadrupled since Q1 a year ago, as well as the GMV through Facebook. While still small, the launch of Facebook Shops in May of last year is clearly starting to make a difference here.”
· “In Q1, we expanded our marketing partnership with TikTok internationally to an additional 14 countries in North America, EMEA and APAC. So far, we've seen good traction in the adoption of TikTok in the U.S. since we launched the integration last October. And we've recently expanded our Pinterest channel into 27 additional markets, opening discoverability and sales opportunities worldwide.”
There are many exciting things going on at Shopify, which we’ve covered at length in the past, including the Fulfillment Center and Shop Pay. Most importantly, we covered exactly why Shopify had taken market share from Amazon and eBay shortly after we launched our premium site. Access October 2019 analysis here.
We also covered Shopify’s positioning in terms of taking over eBay here when we re-iterated our LTBH conviction back in December of 2020. We had been discussing why this was important leading up to the report, and why moving from third position to second position was key for investors during a time of doubt for Shopify.
We also discussed in the LTBH PDF in December of 2020 that “e-Commerce is eating retail” and the various demographics that a company like Shopify can target when partnering with social media apps. The younger demographics is key for social commerce.
To summarize, there are a few reasons that Shopify is set to continue its winning streak and why we plan to increase our position:
1. New distribution channels will reach billions of customers via social media
2. Product-market fit to be achieved in 2021-2023 (we covered this in 2019)
3. Social media spending on ads will increase 18% this year as covered in our free newsletter
4. Second place and has overtaken eBay (we covered this in December)
5. Behavioral ad targeting coming under pressure with Apple’s IDFA – look for an increase in social commerce to offset the shift towards potentially lower CPMs.
We were the first to talk about Snap as an AR/VR stock. The story is moving faster than we previously predicted and we hope you remember the site that brought you this trend first. J
One day, every person on Twitter will say “Snap was clearly a AR/VR story from the beginning” but nobody is talking about this right now. In fact, it’s buried under Facebook’s beat, Pinterest’s DAU concerns and Twitter’s nose dive.
Our job is to talk to you about future trends, and to also silence the noise during periods of extreme sentiment or even around earnings (lots and lots of noise around earnings). We wouldn’t want to add to that noise and assume you read the highlights of any companies you own from the dozen or so sources who cover them.
What’s not being spoken about is that Snap owns the perfect audience for AR/VR. Facebook is in a dilemma here as their subscribership skews older and are less likely to adopt a visually stimulating technology. We will see as time goes on but our money is on Snap. What is the 18-35 year old demographic and also the under 18 demographic really worth? We have yet to find out. Where most tech companies must aggressively take market share or compete at a high level, Snap has to simply keep doing what it’s doing.
Here is the more important take-aways and why are looking to increase our position:
· The company is positive free cash flow for the first time and has strong forward EPS growth this year and next year
· Off-platform AR opportunities such as Camera Kit plus partnerships with companies like Samsung and expanding Android base to reach audiences outside the United States
· Ability to surface premium content through Spotlight and Snap originals and augment these with AR; i.e., Snap is moving beyond social media into original content
· Increased monetization opportunities with AR merging with e-commerce. An example of a successful campaign can drive 30%-40% lift in incremental sales
· Although DAU growth is slow in the United States, it’s strong internationally at 57% this past quarter for Rest of World. Forward growth of 22% on DAU next quarter is impressive considering tough covid comps
· United States ARPU is on a tear at 66% growth leading to 75% revenue growth in this region. Rest of World ARPU is also healthy at 46% growth YoY. Strong guidance on revenue of 85%
Probably the most important statistic from the ER is of the countries that comprise over half of the world’s digital ad spend, Snapchat reaches 70% of 13 to 34-year olds. We want to be AR/VR investors and this is the correct demographic for this trend. Plus, this is important for targeting purposes assuming we do see the IDFA changes from Apple.
Telehealth: We remain in Teladoc …but also still like Amwell
If you want to know what it feels like to invest in the early stages of a trend, telehealth is the perfect example. Remember when I said Nvidia would be an AI leader and dominate the data center, and then there was negative growth in this segment for the first two quarters after my analysis? Seems preposterous that the data center was a low-yielding segment for Nvidia and had negative growth YoY with barely a blip being reported from AI only two years ago.
However, Nvidia/data centers is not an apples-to-apples example for Teladoc because this company faces a much bigger challenge … and nobody knows how it’ll turn out.
I’m not talking about the need for the health insurance companies to reimburse telemedicine permanently (rather than a temporary covid provision). I’d consider this a hurdle and one that I think telemedicine will clear over time.
The big challenge I am talking about is the incredible amount of competition that Teladoc faces. There are many startups receiving funding in the private markets. Zocdoc, a professional booking platform for doctors, launched video consultations last May with the help of Twilio. The company raised $150 million in its last round. Kry is a company popular in Europe that has helped over 3 million patients see a doctor, nurse or psychologist. The company recently closed a $312 million Series D round after its telehealth tools grew 100% year-over-year. Epic Systems, a medical records software company that is used by 54% of patients in the United States, also tapped Twilio for telehealth video conferencing at the start of covid.
Last year, health-tech funding broke records in 2020 with $15.3 billion in funding in the private markets, up from $10.6 billion in 2019. For the first time, healthcare surpassed biopharma with 614 total deals.
Health insurance companies are also in the space, such as United Health Care, with a motivating drive to offset reimbursement costs. This many players commoditizes telemedicine and puts pressure on pricing. This isn’t reflected in the current earnings right now, and in fact, Teladoc is able to increase revenue per user. However, the market is growing nervous because key metrics are flat and there is uncertainty as to how telemedicine will perform in a post-covid world.
Telehealth Trend Overview:
Prior to 2020, telehealth was projected to grow at a CAGR of 25.2% with the global market growing from $61.4 billion in 2019 to reach $559 billion by 2027. The global market is especially important to ensure healthcare is available in remote areas of underdeveloped countries. Internet access remains a barrier for telehealth in remote regions, such as rural India for instance, which has a 20.2% high-speed internet penetration.
In the United States, telehealth was a $26 billion market in 2019.
According to the Centers for Medicare and Medicaid Services, the U.S. spent 17.7% of GDP, or 3.6 trillion on health care in 2018, partly due to an increase in mental and chronic health conditions. The study also highlights that patient monitoring is popular with the elderly with 1 million remote cardiac monitors being used in America.
There is no denying that telehealth had a breakthrough year in 2020. Despite the many breakthroughs ushered in by covid, such as remote work (Zoom, Teams), gym workouts at home (Peloton) and online shopping (Etsy, Overstock), telehealth showed the most rapid growth by far of nearly 4,000% growth across key metrics. Therefore, it’s understandable that the market is attempting to weigh what the growth in telehealth will look like after the one-time event of 2020.
In addition to the market and management attempting to predict what a normal rate of growth will be, the telehealth trend is dependent on federal and state legislation dictating how private payers reimburse telehealth. Full reimbursement is called “payment parity.”
There are 43 states that have some state telehealth statute for commercial payers, yet only 22 states maintain laws that address telehealth reimbursement with a mere 14 states that offer payment parity for telehealth. This is up from 16 and 10 states in 2019.
In the meantime, temporary waivers were offered during covid. We’ve covered in the past how the federal government has passed telehealth bills for Medicare under the CARES Act and other covid legislation. As of now, many of the temporary waivers and emergency legislation is set to expire 90 days after covid’s emergency status is removed.
According to Blue Cross Blue Shield of Massachusetts, the insurance company will continue to support and cover telehealth. However, states like New Hampshire are discussing a bill that would eliminate payment parity as the bill asserts that in-patient care should be paid at a higher rate than telehealth. Opponents point towards mental health and substance abuse as primary reasons the bill should be struck down.
Teladoc ER Overview – Big Revenue Growth but Flat Key Metrics
Teladoc beat on revenue of $453 million, representing 151% growth. The company raised guidance for the year to $2 billion at the mid-point for FY2021 for an increase of $20 million. Revenue in the United States was up 175% and international up 29%.
Despite a strong report on revenue, Teladoc reported a net loss of $1.31 per share – missing expectations by $0.71 for a net loss of about $200 million. This partly contributed to the stock selling off nearly 12% since the report. According to management, “the larger net loss was primarily attributable to increase stock-based compensation, amortization of acquired intangibles, and income tax adjustments primarily related to the merger at Livongo.”
Gross margins increased to 67% up from 59.2% in the year-ago quarter. The adjusted gross margin was 67.8% compared to 60% in the year-ago quarter.
Total visits were up 56% to 3.2 million with the number of consumers enrolled in more than one chronic care program “tripling year-over-year.” The United States made up the bulk of this growth at 69% with international growth at 8%.
Forward revenue guidance is quite strong for Teladoc in the next quarter with $500 million at the mid-point on revenue and positive adjusted EBITDA of $61 million to $64 million up from $56 million adjusted EBITDA in the current quarter.
The management points towards increased revenue per customer as to one reason they are able to sustain this level of revenue growth. Average per member per month (PMPM) was $2.24 in the first quarter, up from $1.76 in the prior quarter. According to management, of the $0.48, half was driven by an extra month of Livongo revenue in the first quarter.
The key metric that showed lower growth (and was most alarming) was 20% growth in paid memberships from 43 million to 51.5 million and 15% growth in U.S. Visit Fee Only access from 19.2 million to 22 million. Forward guidance on this important key metric is expected to be in the range of 52 million to 53 million – in other words, flat sequentially.
For full year, the guidance isn’t much better for this metric with paid membership in the 52 million to 54 million range. Visit fee access is also flat per guidance at 22 to 23 million for FY 2021.
Pictured above: Teladoc US Paid Members are to remain flat year-over-year (YoY)
Total visits are re-accelerating, however, from a plateau in Q2-Q3 2020 where the company stagnated at 2.3 million and 2.4 million, or growth of about 100K visits. Teladoc grew to 200K visits in the last two quarters and is guiding for growth of 400K to 600K visits between Q1 and Q2 2021.
The utilization rate is also climbing, which is important to note. Telemedicine utilization is equal to the number of consults divided by the number of covered employees. Industry averages were between 1-10% prior to covid, yet we see strength in this number sequentially even after many doctor offices have opened up. Besides showing the penetration of telemedicine, the number is important because it affects the cost savings to employers.
Data points from Livongo are also growing nicely and actually accelerated in the most recent quarter compared to when Livongo was a standalone company in Q1-Q2 2020.
Teladoc has strategically added debt over the past several years as the company focuses on growth at all costs. TDOC ended Q1 with $1.35B in long term debt and $723 million in cash.
While debt has increased notably over the past year, Teladoc’s balance sheet still appears to be in very good health. Teladoc’s Debt to Equity Ratio currently stands at 0.086, which is near its 5 year low. A low debt to equity ratio indicates lower risk, because debt holders have less claims on the company's assets.
A Debt to Equity Ratio under 1.0 is ideal because it indicates that for every $1 of equity, the company has less than $1 of debt. In the case of TDOC, we are seeing a strong Debt to Equity ratio of 0.086 that has improved over time, even as the company has taken on more long-term debt.
Teladoc also has a strong Debt to Assets ratio, which is a ratio used to determine how much debt a company has on its balance sheet relative to total assets.
A Debt to Assets ratio under 100% is ideal because it indicates that the company owns more assets than debt. The lower the Debt to Assets Ratio, the less risk the company is carrying on its balance sheet.
Teladoc’s Debt to Assets Ratio is currently standing at a healthy 7.7% and near a 5-year low. Teladoc’s Debt to Assets Ratio means the company is backed by 7.7% of debt, which is a significant improvement from 2020.
While Teladoc’s debt has increased over time, it is much more a factor of a company that is in hypergrowth mode than a company that is struggling financially. This becomes evident when we compare Teladoc’s long-term debt to its equity and assets. Management appears content to strategically use debt in order to fuel growth. This is not uncommon for a company in hypergrowth mode and it is evident in analyzing Teladoc’s balance sheet that the company’s debt is at sensible levels and not a major risk to the business.
Valuation
Teladoc is now valued at 13.58x forward revenue after peaking above 25x at the end of 2020.
In comparison to some others in the space, TDOC looks attractively valued with forward growth expected to eclipse 80% in 2021. The other three stocks we listed for comparison (VEEV, GDRX, AMWL) are not projected to eclipse 40% YoY revenue growth in 2021.
In Q1, legacy Teladoc grew roughly 69% YoY and 9% QoQ. Below is a breakdown of Teladoc’s revenue mix in Q1 from Credit Suisse:
Credit Suisse notes that it is not an apples-to-apples comparison as if Livongo were still a standalone company due to the realization of deferred revenue following the acquisition of Livongo. We are still seeing strong growth from Livongo and legacy Teladoc with 9% and 10% QoQ growth rates, respectively.
It should also be noted that InTouch is now part of TDOC’s single Hospital & Health System business. In Q1, TDOC’s Hospital & Health System business grew YoY as well as QoQ.
There is some investor concern about TDOC missing on EPS two quarters in row, with both misses being caused by expenses related to M&A.
While some Teladoc’s M&A has been more expensive than originally thought in the short-term, this does not affect the long-term thesis. Teladoc is built to be able to incur short term losses and focus primarily on top line revenue growth.
Amwell:
We closed our Amwell position after the company provided low revenue guidance for FY2021 and analyst estimates also showed low revenue guidance for 2022. We simply can’t force timing on a trend even though we continue to keep Amwell on our radar. Notably, Knox trimmed Teladoc in the high-$200s as his technical were also telling us we were too early to the trend.
After Teladoc’s earnings report, there were a few press releases that telehealth has become commoditized. If we were talking strictly about the ability to have a video call with a doctor, then this would be true. But obviously, the goal is how to provide multiple data touchpoints for virtual care. Teladoc has moved into remote monitoring while Amwell is gearing up for AI assistants/carts.
What is intriguing about Amwell is the Google backing, which we covered in the Amwell PDF last year. Google has $100 million of stock in the company with plans to merge AI with health care, including digital waiting rooms, language translations, offloading tasks from the provider to conversational AI and to help manage chronic conditions. Anthem is a large client of Amwell’s and accounts for about 25% of revenue.
The company’s customers often deploy telemedicine through a variety of proprietary Carepoints, which are medical carts and kiosks designed for various clinical and community settings. The company also offers software development kits (SDKs) and APIs to integrate telehealth digitally and to embed into workflows. This includes web and mobile apps, 24-hour nurse and customer support, and electronic health record (EHR) software.
On the same day as Teladoc’s earnings report, Amwell released an announcement on their new telehealth platform that will allow developers to host and deploy telehealth applications. The platform offers a single code base to build a unified care experience to develop apps that utilize Google Cloud’s AI and NLP technologies, TytoCare’s handheld exam kit, connections to clinic physicians (looks like the beta version will be in Cleveland), and Biobeat’s patient monitoring devices. I assume the list of integrations will grow over time.
The new platform may not change Amwell’s revenue trajectory in the short-term but it’s certainly something we are keeping our eye on.
To be frank, we don’t with who the winner is between TDOC and AMWL as long as we get to participate. Therefore, the I/O Fund is remaining flexible between these two and will be looking for signs of strength to determine what position(s) we hold and our allocation as time goes on. Notably, there is a lot of deal flow in the private markets because this a big market to crack for the company who does it.
I was excited about playing the momentum for this stock last earnings season when I released the PDF at about $14 a share and it popped to $17 a share about a week after we published.
I felt confident on the probabilities of a big earnings beat because the company had released new filters that pushed it’s downloads to new highs. They also had announced beta-testing for Audience Network, a way to monetize the 190 million users outside of the Snapchat application.
Funds and institutions will pile in for Audience Network because of what it did for Facebook. However, Audience Network hasn’t opened beyond beta-testing and there hasn’t been an update since April, when the company stated it would be released in the “coming months.”
If/when this does happen, Snap will report higher revenue but I don’t see any evidence that we’re there yet. I also haven’t seen any new filters that would suggest new app downloads or viral popularity (even if short-lived, these are great for momentum plays). We now see Snap testing dynamic ads, which are popular on Instagram. These will not have an effect on earnings this quarter.
TikTok is a looming threat to social media apps, as well. However, if/when I hear anything about Audience Network officially launching, I will be an immediate buyer.
For this earnings report, I am on the sidelines for Snap. I like more confirmation from app download reports than what I’m getting right now.
However, Knox trades more on technicals and he is getting into the trade ahead of earnings. Here is his take on the situation:
SNAP Technicals
By Knox Ridley
After Snap hit my stop at $14, closing the position for nice little gain, I’m getting back into SNAP and here is why:
5 waves up (in purple) that hit all the Fibonacci points.
3 waves down from the recent high (A,B,C), and the C wave hit the 138.2% extension and is turning back up.
Just reclaimed the 10-day EMA – a show of changing momentum.
If we take the length of the uptrend (the bottom of 1- and the peak of 5)and multiply it by the Fibonacci ratios, SNAP turned up right at the 38.2% time marker, which coincides with the MACD turning up, and the Stochastic/RSI turning up.
We now have 5-waves up on the 3 minute chart when you zoom into the most recent push up. This is a tell of the bigger direction that is unfolding.
I’m going long, but cautious of the overall market, hence I’m placing a stop at $13. If you want to give it more room to breathe, I’d place it just under the .382 retrace level in black.
The fundamental analysis and technical analysis provided prior to earnings played out nicely this week. Snap crushed on DAU (daily active users), as our data had indicated the company would. For ad companies, DAU plays into higher revenue. The bigger story for Snap this year has not officially launched – Audience Network.
We will keep you updated if anything changes fundamentally.
Technical Update:
Provided by TA contributor, Knox Ridley:
Snap broke out yesterday. As you can see in the chart above, Snap was following a steady trend channel (in blue), bouncing between this channel until today.
Our previous TA noted that Snap’s support was $14 and resistance was $17. Snap retraced, closed just above $14 on Friday/Monday and then sky rocketed above $17 the day following earnings. It not only closed above $17 but did so with high volume.
This is always a bullish sign. We will likely see it retest the upper trend channel (outlined in the lite blue dotted line, trending up), before testing the $20 resistance level above (in yellow). As long as Snap stays within this upward trend (outlined by the lower blue line), Snap should continue it’s upward movement.
Regarding the internals of Snap – notice the top yellow circle. This is highlighting the current price breaking through the upper Bollinger Band, while the lower Bollinger Band moves down. This is a very bullish indicator, which is supportive of higher prices.
Further supporting the internal strength, the RSI closed above the descending trend line, showing some new found buying pressure. As long as Snap holds the 55-50 region on the RSI, we should continue upward. However, keep in mind that broad market forces can raise and sink all ships, regardless of fundamentals. If the $14 support region is broken due to a weakening broader market, we could see the price fall into the green box on the chart ($12.50-$9.50).
Per Beth’s analysis, fundamentals are strong. The should be seen as a long term hold that will benefit from Audience Network in the second half of the year. If you’re in, mind your stops if the broader market moves downward. If you have yet to make a position, follow Snap’s retrace to the upper trend channel previously mentioned. That would be a good time to enter.
SNAP Forum:
Please check out our forum and post there if you traded Snap or have questions on Snap for community discussion. One user posted some great information on the number of funds moving into the stock over the past two quarters. Here’s the post:
Institutions have been moving into SNAP over the last 2 quarters:
Date # funds:
Sep 2018, 177 funds
Dec 2018, 168 funds
Mar 2019, 198 funds
Jun 2019, 321 funds
There was a new web analytics report from SimilarWeb released last week that showed an increase of traffic to Snap’s advertising URL, up 23% YoY, compared to Facebook’s URL, up 4%. The comparison is provided to illustrate a common growth metric for ad URL traffic on social ads with the understanding FB receives much higher traffic volume.
This is positive news. The report also confirmed that the popular filters maintained an increase in daily active user growth, up from 10 million to 11.6 million (peaking around 13 million with the new filters). One concern was if the filters had created an artificial new high, which does not look to be the case.
Due to the increase in app usage from this past quarter, illustrated in the PDF, the probability that Snap will beat earnings is the more likely scenario. If for some reason Snap does not beat earnings, I will still have a buy rating on the stock due to Audience Network. This will be a major breaking out point for the company’s revenue (Audience Network in testing as of April).
In the article released 7/19, Audience Network is what Goldman is referring to as “Our checks with advertisers also lead us to believe that the company’s continued innovation in its ad-stack, particularly in self-serve, should allow SNAP to substantially improve monetization of user time spent on the platform over time.”
Technical Update:
Snap is currently trading at the $14 support level, and is holding as of today. Per our technical analysis, if Snap closes below $14, we could see it trade within the green box on the original chart ($12.50 – $9.50 range), before taking us up beyond the $20 range. Listen to your stops, and understand that Snap’s growth story regarding Audience Network is a matter of when, not if. The increase in app usage should also translate to an increase in quarterly revenue.
Keep in mind, there is high volatility in this stock. With the price retreating down to support levels as we head into earnings, there is likely to be a strong reaction tomorrow after- hours. Snap has jumped as much as 22% after a strong earnings report and dropped as much as 14%.
Regarding stops, we purposefully suggested wider stops to keep you from exiting prematurely, but also to get you out with a minor loss in case a correction occurs. We may be early to Audience Network compared to the broader market, but that’s by design.
Snap has seen remarkable volatility in its stock price this year, down 80 percent from its peak in March of 2017 at $29 to a low of $5 in December of 2018. The stock is currently trading in the $15 range, at time of writing.
Previously, in August of 2018, I had a sell recommendation on Snap. I am changing this to a buy
recommendation due to a few key reasons. For one, Snap should report higher than usual user growth, which has become known to the market. Secondly, Snap is extending its monetization methods and this is not widely known to the market. The increase in user growth should be reported in Q2 and the new monetization method should take effect by Q3.
Background:
Snapchat is one of the best platforms for Millennials and Gen Z audiences. The company reaches between 75% to 90% of people aged 13 to 35. The issue that Snapchat has faced is flat to declining daily active users (DAU) and monthly active users (MAU). Overall, the company does not report enough growth to command a social network multiple.
Revenue growth and profit margins have been problematic for Snap. The most recent quarter showed an improved gross profit margin of about 36%, however, in the quarters following the IPO, Snap reported negative gross profit.
The company switched to selling ads programmatically through software algorithms instead of through salespeople – this led to lower ad prices and resulted in lower revenue. Snap also had a redesign that halted Snapchat’s user growth.
2A. App Sessions Skyrocketing
Snapchat’s new gender-swapping filter has been extremely popular and this should show up in the earnings results for Q2 2019. Downloads and sessions have surged causing Snapchat to rank #4 overall in China’s App Store, its highest rank there in more than four years.
According to app intelligence provider, Adam Blacker of Apptopia, Snapchat had its most downloads ever dating back to January 1st, 2015 at 2 million compared to the average daily downloads of 665,000. As Apptopia has noted, retention will need to be proven, with retention likely higher for Snapchat Games than Snapchat filters.
Regardless of retention, the surge in user activity will be a welcome relief for investors.
Predictably, this app activity placed Snapchat as the number one downloaded app in the United States for the first time since March of 2017. We will be monitoring this intelligence closely to see if Snapchat places in the top spot for June of 2019, as this would indicate further additional strength in the stock’s key metrics for the upcoming quarter.
3A. Average Revenue Per User
Snap’s average revenue per user (ARPU) is on an upward trend. This helped cause the stock rally we saw in the past few quarters.
4A. Audience Network
Less widely known to the market is Snap’s plans to monetize its Millennial data across other mobile applications. Snap will no longer be confined to monetizing the 190 million users on the platform, and instead, will use the data to broker ads across various mobile applications. This will have a parabolic effect on the company’s average revenue per user (ARPU).
Audience Network is a software development kit (SDK) that allows advertisers to use Snapchat data to reach audiences outside of Snap on the applications that install the software. The flat daily active users (DAU) growth on Snap will become less important as Snap will effectively broker ads to a scalable audience outside of the native Snap application. Full-screen, vertical video ads will appear across third-party mobile applications.
Snap has data on a lucrative demographic that few companies have ownership of, as both Facebook and Twitter are out of favor with this age group. Snap’s Audience Network will open up the ability to reach the Millennial and Gen Z audience segments across a much larger total addressable market.
The product was announced on April 4th, however, the company will now need to sign up application developers and advertisers before the revenue shows up in quarterly results. The formal launch will occur later this year.
Conclusion: Buy recommendation on Snap with price target of $17-$23
Catalyst: Audience Network should not be underestimated. Facebook launched an Audience Network in 2014 when the average revenue per user (ARPU) hovered around $12 in the United States. Audience Network was the turning point for Facebook’s ARPU reaching the $26 we see today in the United States region. The market is preparing for renewed user growth from Snap in the current quarter, however, Audience Network is what will cause the stock to climb and is still relatively unknown to the broader market.
SECTION 2: SNAP – Technical Analysis
Technical Analysis provided by Knox Ridley
Background:
Snap is out of favor with a tarnished sentiment – and for good reason based on a string of bad earnings and questionable management decisions in 2018. As mentioned in the fundamental analysis, the stock was down 80 percent from its peak in March of 2017 at $29 to a low of $5 in December of 2018.
However, Snap currently is in a quiet and strong uptrend. We do not think the market will ignore Snap for long, and we believe their next earnings report could be a turning point. Regardless of the upcoming earnings, we want to enter Snap before Audience Network goes live and becomes public knowledge.
The technicals of Snap are strong, as it just confirmed an inverse Head and Shoulders pattern by breaking the $14.47 neckline, then re-testing that support, and trending upward from there. Holding for 6-18 months will be important to let Audience Network take effect, while keeping a close eye on privacy laws. Because of this time frame, we can get a clear picture of Snap’s price pattern on the daily chart – below.
2B: Technical Overview
Using the RSI to measure Snap’s internal strength, Snap is clearly in a bullish position (holding above 65). However, you’ll notice that the buying pressure is starting to falter. This is evident in how the RSI is making lower highs while the price of Snap is making higher highs. This is Negative Divergence, with a sign of weakening buying pressure, and could signal a short term draw down. As long as Snap does not break below 60 on the RSI, it will remain in a strong bullish position.
Regarding the price pattern of Snap, we can a see a classic Inverse Head and Shoulder pattern, outlined in blue, that was recently confirmed once Snap broke above the neckline around $14.47. This is a bullish pattern that has played out. As long as Snap can hold the $14 support, the stock has the potential to trend higher to the $20-$23 range.
If the RSI breaks 50 and then moves below 43, which has recently been a strong ceiling for Snap once it enters a sustained downtrend, we will be looking to our stops to exit our position, or add more depending on the price action. However, in a market environment like the one we have, where we see a divergence between the upwards price of the broad market and the decelerating data in the economy, using stops is highly suggested. This will allow you to lower risk while investing in the remaining upside of this bull market.
2C: Elliot Wave Analysis
With limited price data due to Snap’s IPO in 2017, we’ll use this data as a rough guide to Snap’s general direction. It appears as though we are finishing an impulsive 5 waves up in a Wave (1) of (5). This is very bullish for the intermediate to long term for Snap, while being bearish in the short term. The question remains: how far will the Wave (2) retrace take us? As long as the broad market cooperates, and based on the current strength of Snap’s price action this year, a large retrace is not anticipated. The green box indicates the most likely target if Snap cannot break the $17 range. Above $17, and the Wave (2) retrace will be moved significantly up, making our current entry much safer.
Conclusion:
The line in the sand will be $14. Below $14, and we will likely see the green box come into play. On other hand, above $17 and our next level of pullback will likely be around the $20-$23 range, before taking us higher. Keep in mind that Snap is a volatile stock, so we will set a wide stop to give it room to breathe; however, we do not want to get caught up in a major market downturn, so our stop will allow us to play the upside, while avoid any severe losses. We recommend a 25-35% trailing stop.
Please note: The I/O Fund conducts research and draws conclusions for the Fund’s positions. We then share that information with our readers. This is not a guarantee of a stock’s performance. Please consult your personal financial advisor before buying any stock in the companies mentioned in this analysis.