Given the extreme FED action this year that has gnarled the stock market, I think it’s important for investors to look at how we got here to draw conclusions on what may be coming down the line. For brevity, we begin the discussion dating back one year.
In September of 2021, the FOMC decided to keep the Fed Funds rate at 0% and continue their asset purchasing at a regular interval, maintaining a loose policy as a result of the COVID panic. They reiterated rapid growth of the economy into 2022, while most members saw no need for a rate hike in 2022. Some members disagreed that a new tightening cycle would need to be started in 2022, but it was believed that it could be at a slow and tapered pace.
Interestingly, real-time market data related to inflation was flashing signs that inflation was becoming a concern. Here are some examples of data points that contradicted the FOMC’s policy decision at the time:
The NAHB Index, which tracks the sentiment within the home builder’s sector, saw a 160% increase from the COVID low into the September meeting.
The Case-Shiller Home Price Index was showing a ~25% increase in nation-wide home prices. It further showed the highest YoY reading in its history in July with a greater than 20% increase.
The Bloomberg Commodity Index was up 64% since the COVID low into that September, 2021 meeting. This was the highest reading since July of 2015, and also marked one of the steepest increases in terms of rate of change in the Index’s history.
Crude oil was up 47% in 2021, going into the meeting. It was also well above the pre-COVID levels.
The M2 Money Supply was up around 35% since the COVID low going into the September meeting. The M2 layer of the money supply measures the amount of liquid cash in the system, and historically accounts for inflation within an economy.
The S&P 500 was up over 100% from the COVID low going into late September of 2021.
Even the monthly CPI data, which has a built-in lag to some of its metrics, was suggesting inflation was becoming a problem. In February of 2021, the YoY CPI print came in at 1.62%; one month later, it read 2.62%. In September of 2021, it was at 5.3%.
So, what happened, and how could a team of the brightest PHDs, Bankers and Financiers that makes up the Federal Open Market Committee (popularly known as the FED) miss the inflation signals and raise rates so late in the cycle?
The standard policy for central banks is that at the first sign of inflation, they begin a slow and steady pace of rate hikes. For example, in 2004, the FED began their tightening cycle once the YoY CPI print exceeded 3%; in 1999, they began to slowly tighten once it moved above 2%. Even the current Fed Chair, Jerome Powell, started hiking rates in 2017 with inflation around 1%.
In our August webinar, ”This is Still a Warning Sign,” we warned that market risk was high, and that a sharp pullback was ahead. I also mentioned the market was setting up for a reversal going into the CPI print in September, here. Follow me on YouTube here or sign up for the I/O Fund free newsletter to be emailed the weekly webinar.In our August webinar, ”This is Still a Warning Sign,” we warned that market risk was high, and that a sharp pullback was ahead. I also mentioned the market was setting up for a reversal going into the CPI print in September, here. Follow me on YouTube here or sign up for the I/O Fund free newsletter to be emailed the weekly webinar.This is Still a Warning Sign,” we warned that market risk was high, and that a sharp pullback was ahead. I also mentioned the market was setting up for a reversal going into the CPI print in September, here. Follow me on YouTube here or sign up for the I/O Fund free newsletter to be emailed the weekly webinar.
Despite the numerous market indicators pointing towards growing inflation pressures in September of 2021, the FOMC ignored the signs, and instead continue to press their loose monetary policies. They ultimately waited a year after inflation showed up to begin addressing it, putting them much farther behind the curve than investors are used to.
Just over one month after the September 2021 meeting, the FOMC was forced to reverse course. Marking the second sudden policy shift in Jerome Powell’s tenure. As we now know, inflation was not transitory, forcing the FOMC to embark on the steepest rate hike campaign since Paul Volker raised the Fed Funds rate to 20% from a 3-year average of 11.2%.
Rather than engineer a soft landing, the FED did the opposite by raising rates a year too late. What resulted was an aggressive increase and the worst stock market on record in nearly 50 years.
One year later – Inflation is Down, the FED is Up
Fast Forward one year into the recent September, 2022, FOMC meeting, and the same indicators were clearly showing a notable reduction with inflation…
1) Commodities have collapsed, and continue to push lower. Copper prices are down ~30% from their high, while lumber prices have fallen back to pre-COVID levels. Most importantly, Crude Oil is about 16% below its pre-Russia/Ukraine war level, as gas prices declined every day? for 98 consecutive days.
2) Sales of existing homes in August declined 19.9% from August 2021. Furthermore, the Case-Shiller home Price Index showed the largest MoM decline in home prices since 2011.
3) The National Association of Home Builders (NAHB) Index fell for 9 consecutive months and is now below the 50. Anything below 50 is a contraction. The president of the NAHB, Jerry Howard, went as far to state that “we’ve given birth to a housing recession.”we’ve given birth to a housing recession.”
The last time we saw the NAHB Index below 50 was briefly around the COVID low and then again in 2014. In fact, the last 9 months saw the 3rd steepest % decline in the NAHB Index since 1990.
4) The M2 money supply is one of the most important indicators of inflation, and is the layer of the money supply that tracks liquid money in bank deposits, CDs, Mutual Funds, etc. In other words, the money that is ready to be used in an economy. After seeing a 35% increase post-COVID, since February of 2022, the M2 money supply has been negative to flat.
Ultimately, inflation is a monetary phenomenon. The more money in the system chasing the same goods, inherently means goods will increase in price. Following the M2 money supply is the most effective way to track if inflation is growing or shrinking.
The list can be extended into Producer Price Indexes and Manufacturing Costs consistently surprising to the downside. Inflation data does not have a lag built into its calculations, and looks at real-time market information, is signaling a noticeable change in trend with inflation pressures. Yet, just like in 2021, the FOMC appears to have a disconnect between inflation and its policy, except in the opposite direction.
The market was expecting a 0.75% rate hike this round, which it got. What it was not expecting was for the FOMC to raise its target rate, extend the duration for rate cuts, and claim that inflation is still out of control. They further spooked the market by stating that more pain would be needed to bring inflation back to its 2% target. This was backed by lowering their economic growth forecasts for this year, down to 0.2% from 1.7% in 2022, and 1.2% from 1.7% for 2023.
This meeting caught the market by surprise, triggering a sell-off that has pushed the S&P 500 to new lows in just under 2 weeks. I provide weekly webinars that discuss what I/O Fund is buying and selling. We also have a proprietary hedging signal that we monitor in real-time. Following the free analysis, Why The Next 2 Weeks Could Determine The Rest Of 2022 Why The Next 2 Weeks Could Determine The Rest Of 2022 we hedged going into the CPI number for a nice gain in a tough market. That analysis dated September 8th stated:
“Historically, this grid tends to accompany the C wave down in a bear market. However, in 2022, the market exhibited a sell-now-and-ask-questions-later mentality, as we saw the S&P 500 decline by 24% and the NASDAQ-100 decline 34% over a 5.5 month period. These are rare moves, and one has to wonder if the worst is priced in – including the global slowdown in growth? I do believe it’s cavalier to assume that at this point, and prefer to let the broad market prove it to me over the coming month. We will remain cautious until then, and respect the Big Risk-Off grid that we are now in.
If we have, in fact, found a meaningful low, we would not only need to see the S&P 500 give us that 5th wave up, but we would also need to see rates, the USD and oil move down or sideways. Bull markets do not happen in vacuums and tend to be supported by various markets firing in unison. As of today, this confluence of inter-market dynamics is not supporting a direct uptrend in equities.”
Just like in the September of 2021 meeting, the FED appears to be ignoring market signals about inflation. By ignoring the real-time market data regarding inflation, the markets will once again force their hand, as it always does. The only question remains is what will have to break before they flinch? As stated, we believe it is prudent to wait for the clear reversal before getting too aggressive in equities. This is why our service has hedged the majority of September with real-time trade alerts sent to our Members.
SPX Levels to Watch
The S&P 500 is tracing out what appears to be a 3-wave pattern down from the August high. This is important, because it is not suggesting an immediate breakdown from current levels. Instead, we are seeing extreme oversold conditions that tend to lead to a short-term bounce, at minimum.
If the coming bounce can break above 3800, then a major low is likely developing. However, once SPX pushes into 3730, the risk will be elevated, as the above structure does not look complete until we get at least into the 3550 range.
To further support a bounce, today we saw the broad market make a new low; however, it did so with notable divergences. For one, the VIX did not make a new high, which tends to precede a turn. The market also went down with less stocks making new lows than last week’s low. This was met with the Advance Decline line also not making a new low with price. These are common signs we see prior to a turn.
On the I/O Fund premium site, I provide weekly webinars that discuss what the I/O Fund is buying and selling. We also have a proprietary hedging signal that we monitor in real-time. Following the analysis I provided for free on YouTube last month “This is Still a Warning Sign” and also in this article “Why the Next Two Weeks Could Determine 2022” we hedged going into the CPI number for a nice gain in a tough market and have had a hedge in place most of September.On the I/O Fund premium site, I provide weekly webinars that discuss what the I/O Fund is buying and selling. We also have a proprietary hedging signal that we monitor in real-time. Following the analysis I provided for free on YouTube last month “This is Still a Warning Sign” and also in this article “Why the Next Two Weeks Could Determine 2022” we hedged going into the CPI number for a nice gain in a tough market and have had a hedge in place most of September.I/O Fund premium site, I provide weekly webinars that discuss what the I/O Fund is buying and selling. We also have a proprietary hedging signal that we monitor in real-time. Following the analysis I provided for free on YouTube last month “This is Still a Warning Sign” and also in this article “Why the Next Two Weeks Could Determine 2022” we hedged going into the CPI number for a nice gain in a tough market and have had a hedge in place most of September.
The next premium webinar will be on Thursday, October 6th at 4:00 pm Eastern where I will discuss how I plan to trade the broad market signals discussed in this article plus new information on an important time factor in mid-October which I believe is lining up with the Q3 earnings season. Learn more about Premium I/O Fund Services here.The next premium webinar will be on Thursday, October 6th at 4:00 pm Eastern where I will discuss how I plan to trade the broad market signals discussed in this article plus new information on an important time factor in mid-October which I believe is lining up with the Q3 earnings season. Learn more about Premium I/O Fund Services here.Premium I/O Fund Services here.
Please note: The I/O Fund conducts research and draws conclusions for the Fund’s positions. We then share that information with our readers. This is not a guarantee of a stock’s performance. Please consult your personal financial advisor before buying any stock in the companies mentioned in this analysis.
Marvell’s management team did an excellent job of acquiring Inphi and executing. Typically, we avoid M&A for a year to allow the financials to merge, yet in this case, leaning into the acquisition was a good choice.
The Marvell management team’s execution skills are needed once again because Marvell has an opportunity to greatly increase its revenue and profits if management can execute in a new market one more time. The opportunity is a new architecture called CXL that disaggregates memory from the CPU. CXL is attracting a lot of attention at industry events, such as Hot Chips 2022, because it’s focused on optimizing one of the most expensive parts of the data center – which is memory.
Before we go into the 2023-2024 Marvell product road map, and why it’s key to the company’s future, I want to discuss the fiscal Q2 2023 earnings.
Fiscal Q2 2023 Earnings Overview
The market is concerned over Marvell’s data center guidance of 20% growth next quarter. This is a slowdown from the most recent quarter at 48% YoY growth and earlier quarters at >100% growth.
At an estimated $600 million, it will also mean a sequential decline both from Q2 and Q1, which were at $643M and $640M, respectively. Marvell stated it’s the on-premise business weighing on their cloud data center business and supply issues (more below).
Notably, Q2 of last year was an important moment for the company when 56% sequential data center growth grew from $277 million to $434 million in the span of three months following the close of the Inphi acquisition in April 2021. From there, the company has sustained Inphi’s already high growth levels for over a year.
The company is now at an annualized run rate of $6 billion, which the CEO reminded analysts, was the target for October of 2023. The company met the target originally provided at the October 2021 Investor Day one year earlier than expected. Notably, this was six months after Inphi was closed so M&A not a factor here.
Marvell’s Segment Overview:
The data center represents 42% of revenue at $643 million and grew 48% year-over-year.
The carrier infrastructure segment, which is wired and wireless and reflects 5G growth, reported 45% YoY to $285 million.
Enterprise networking grew handily at 53% YoY to $340 million and is expected to grow at 70% next quarter. We break this segment down below.
Consumer was down (1%) to $164 million and is expected to be down (10%) next quarter. Marvell has exposure to the storage market and this can weigh on the more robust segments.
Automotive was up 46% YoY to $84 million and is expected to be up 40% YoY next quarter. We also break down this segment below.
Marvell Financial Overview
Marvell was reporting negative top line revenue when we first covered it in 2019 and Marvell took another hit on revenue during Covid before accelerating to the 50%-74% revenue growth range.
The current quarter’s top line revenue in Q2 was at 41% which is a deceleration from Q1 with 74% revenue growth. The company guided for 29% year-over-year growth, which was a slight miss as analysts were expecting 30.3% growth in the fiscal Q3 quarter. The company reported EPS in line with adjusted EPS of $0.57. The guidance on EPS was a slight miss, however, at $0.59 reported versus $0.61 adjusted EPS estimated.
Semiconductors make a tougher investment as analysts can’t model too far into the future beyond what management teams provide. That is why there were many questions looking for help with how to factor in the “acceleration” in the data center the Marvell team is expecting in Q4 and what this will mean for CY2023.
An analyst asked if they can assume 10% QoQ in the data center for $1.7 billion overall revenue and the CEO said it sounded “a little on the high side.” This has led to analysts modeling $1.65 billion in revenue in Q4, for 22.5% growth. Therefore, despite a single-digit acceleration in the data center segment, there will still be a top line deceleration, if today’s forecast does not change.
The company’s margins and cash flow are a bright spot, and I believe this is being overlooked. If we get an acceleration in the data center into next year, then Marvell is fundamentally a much stronger company than it was during the previous data center streak.
On a GAAP basis, the gross margin was at 51% in the most recent quarter, up from 35% in the year ago quarter and up from 46% in FY2022. The company is guiding for the same GM of 51% next quarter.
The GAAP operating margin has improved quite a bit YoY to 8.3% in the current quarter compared to (25%) in the year ago quarter. This is also an improvement from Q1 with GAAP OM of 4.80%. The adjusted operating margin “hit a record” at 36.5% and is guided for 37% next quarter. Stock based compensation was at $139 million in the most recent quarter.
Cash flow is also improving with operating cash flow at $332 million, or 22% of revenue. This compares to $194 million last quarter and $819 million in FY2022. However, the company carries debt of $4.6 billion and has $617 million of cash on the balance sheet. This is a 1.8X net debt to EBITDA ratio.
Therefore, there has been substantial improvement yet Marvell does have a weaker debt profile than a company like AMD or Nvidia.
Source: YCharts
Note on Supply:
Marvell is aligned with AMD in that they believe supply chain issues will ease in Q4 and into 2023. Here is what Marvell said in the opening remarks:
“Therefore, for our overall data center end market, we project revenue in the third quarter to decline sequentially in the mid-single digits on a percentage basis. However, we expect our data center revenue in the fourth quarter to increase on a sequential basis, anticipating an improvement in supply and new product ramps in cloud.”
Here is what AMD said:
“The visibility with our customers, especially our large cloud customers’ second half of this year into next year is very good. And we’re planning really for the next four to six quarters, and that gives us good visibility” and later provided many references toward supply coming online in Q4, such as: “But overall, the 7% increase [in gross margin], I think, is very well supported given all of the new product ramps that we have going on in addition to some additional supply that’s coming in as we get into the fourth quarter.”
It never hurts to have two management teams agree on the larger broad-based issue. However, since those reports, we’ve seen analysts cast doubts on the effects of macro for the rest of the year: “[Mizuho analyst Rakesh] checks show hyperscale orders are seeing "pushbacks" but no cancels, with Q3 trending flat quarter-over-quarter and Q4 "potentially soft." Rakesh lowered estimates for AMD "with macro headwinds clouding the near-term outlook."
Marvell’s Products:
In six brief years, Marvell has pivoted away from consumer (storage) products as the revenue mix was previously 62% consumer/38% infrastructure to being 11% consumer/89% infrastructure today.
This was driven partly by hyperscalers building data center infrastructure and AI/ML driving the need for faster data speed. Inphi also contributed to this.
Data Center Segment
PAM Solutions:
Marvell offers 200-gig and 400-gig PAM-based electro-optics — and the company recently added 800-gig solutions. This market sees tailwinds from the need for more bandwidth as the electro-optics connect short distances and long distances to increase data rates. PAM4 has replaced NRZ data transmission with the benefit of doubling the bit rate.
Hyperscalers are going through an upgrade cycle that requires high bandwidth and port density. PAM4 connects networking ASICs and machines, like servers and AI machines. Digital-based PAM4 uses analog-to-digital converters to clean up the signal in the digital domain before converting it back to analog to transmit.
Artificial intelligence and machine learning drives demand for the 800-gig PAM to increase the speed of input-output and to process the data flows. This doubles the throughput (bandwidth) due to an 8x100Gpbs optical transceiver for inside and between AI clusters.
In the fiscal Q1 results ending in April, management had stated: “our first quarter results benefited from a ramp in volume shipments of our 800-gig PAM solutions at two large customers.” The company has also stated that their products will see increase demand with the release of more powerful CPUs.
COLORZ 400:
COLORZ allows regional data centers to be linked together in the same metro region to function as one single mega data center. COLORZ silicon photonics technology allows data centers in the same metropolitan region to function like a mega data center through a “network fabric.” This facilitates faster edge computing within an 80/120 km distance for 30-megawatt data centers as they will be linked together and function like a 120-megawatt data center.
“As artificial intelligence (AI), machine learning (ML) and high-performance computing (HPC) applications continue to drive greater bandwidth requirements, cloud-optimized 400G solutions are needed to support high-speed data center interconnections. These requirements can only be met through high bandwidth connectivity offered in a small, cost-effective form factor. The Marvell COLORZ II 400ZR enables cloud data centers the ability to increase the speed of data movement while keeping the power and cost low.”
Another press release stated the company shipped 100,000 units.
Here is what was said on the call about how/why the growth in the data center can continue:
Harlan Sur
Good afternoon. Thanks for taking my question. On the cloud optical connectivity business, this is both inside and between data centers, the upgrade cycles have been this really great multi-year tailwind for the team.
And if I look into next year, I believe that there's still at least one of the top four US hyperscale titans that's going to start the 400-gig PAM4 transition. You still have China CSPs that need to fire. You've got multiple customers on DR that's going to fire as well. Historically, like these transitions, I don't think have been impacted by a slowing macro demand environment. They're viewed as, I think, very strategic.
But is that how your cloud customers are thinking about these upgrades and your views on continued upgrade momentum in this segment for next year? And just relatedly, is the Innovium team on track to drive $150 million in revenues this year?
Matt Murphy
Hey. Thanks, Harlan. Yes, I think the first part of it, you got pretty well in terms of the transition on 200 and 400 gig PAM4 inside the data center. And then, the new ramps we're seeing in 400 gig ZR for DCI between data centers.
What I'd add on top of that is — which has been extremely strong and also, in some ways, a little bit of a constraint we've seen in terms of being able to keep up is, the demand on 800 gig, which is happening right now really around, obviously, very advanced AI workloads.
That is an area where, if we could obviously produce more material, we would be shipping it in Q3. So that's also a positive trend. So you've got sort of the transition going on all the way up to 800 gig, and that continues to look pretty good.
NOTE: Innovium is an acquisition that closed in 2021 and at time of acquisition was expected to add $150 million in revenue for CY2022/FY2023.
Compute Xpress Link (CXP): 2024-2025 Data Center Catalyst
Marvell is launching a new product line called CXL, which will improve how data centers add memory. Right now, a server must be opened to add DRAM and the DIMM slots are limited in number and don’t pass service history or bit-error history, which is needed by hyperscalers.
Memory pooling allows memory to scale independently from processors by taking memory for a task and then releasing the memory. The new fabric removes the need for local DRAM, which adds a bit of latency from 100ns to 140-160ns, however, there’s a possibility of adding a CXL accelerator to be more “cache coherent.”
The CXL switch will be used to accelerate protocol-level processing across ethernet, DPUs, SmartNICs and solid-state drive controllers (SSD).
What Marvell is proposing with CXL is a new server architecture to “dynamically assign memory resources between servers.” The result is boosted memory bandwidth and also the ability to enable memory pooling. The company sees a future where a new architecture will separate compute, memory and I/O racks with the interconnect being CXL.Partially-disaggregated racks are expected to deploy in 2024-2025.
Marvell is at the forefront of the shift toward “disaggregate memory from the CPU” because it currently supplies the optics that this new fabric will disrupt. Inphi is the leader in silicon optics, PAM-4, and the encoding of PAM-4 for PCIe 6.0.
2024 seems like a long ways off yet the market will be paying attention to this In Q2/Q3 2023.
“As you recall from our discussion last quarter, we see CXL as the next big evolution in cloud data centers that will enable us to increase our reach into the memory ecosystem and presents a multibillion-dollar SAM expansion opportunity for Marvell.
This includes a host of new products such as CXL expanders, cooling devices, switches and accelerators and the potential to embed CXL IP and a broad range of our data center products. Events and presentations at FMS strongly validated our excitement around CXL. This is the hottest topic at FMS with standing room-only presentations by many leading industry participants.
The Marvell booth, we demonstrated the industry's first CXL memory pooling solution, addressing the challenges related to memory scaling and cloud data centers. While the industry is still in the early stages of CXL adoption, we are working on closing significant opportunities right in front of us at key customers and envision a strong design win pipeline.”
Why Marvell for CXL?
There are a handful of companies going after the CXL opportunity. Marvell could be front runner as the company already works closely with memory OEMs by supplying HDD controllers, SSD controller and preamplifiers. The company also has an aggressive PCIe roadmap with the company shipping Gen 5 sockets whereas most SSD device are shipping Gen 4 solutions. Marvell is already investing in Gen 6, which in turn, attracts more Tier 1 memory OEMs.
Marvell acquired Tanzanite, a developer of advanced CXL technologies. The company plans to expand to CXL expanders, cooling devices, switches and accelerators.
The company has stated this will drive “a multibillion-dollar PAM expansion opportunity driven by CXL overtime.” (Note: Marvell is referring to PAM, their premiere product)
We will focus on this more next year. You can listen to a recent tech talk here on CXL. The presentation is located here. This is an article about Microsoft’s interest in CXL with a statement that “50% of their server costs are taken up by DRAM.”
Carrier Infrastructure:
The OCTEON processors and platform is an Arm-based compute architecture for embedded applications, such as wireless networking equipment including 5G, including switches, routers, firewalls and monitoring solutions.
The OCTEON DPU is used with SmartNICs and security accelerators with a 5nm design that delivers to the infrastructure industry the same processing node as consumer smart phones and high performance computing and shipped in 2021. The most recent release from last year was the OCTEON 10 DPU and Prestera carrier switches which combined consumes 50% less power than competitors (according to Marvell).
Marvell’s processors help 5G networks meet latency and bandwidth demand while also allowing the networks to upgrade as cellular standards evolve. Marvell also offers customized solutions, which is ideal for Tier 1 customers who can combine their IP with Marvell’s Arm v8 processors and accelerators.
Recently, Dell and Marvell partnered to develop a server-class accelerator card for 5G base stations based on Marvell’s arm-based OCTEON Fusion processor. The hardware accelerators deliver more processing power including processing solutions for smart radio heads to support massive MIMO antenna rays.
We wrote about MIMO a few years back in a reference guide: “Massive Multiple Input and Multiple Output (MIMO) sends the data through multiple data streams called layers, which increases parallelism and throughput. MIMO helps avoid lost signals with multipathing, which allows the base station to send multiple copies of the same signal for increased redundancy.
Note: The antenna array is one fundamental change to 5G infrastructure. The initial 5G rollout will use existing cell towers, however, newer, dedicated 5G network infrastructures will require many more antennas than used in previous generations. Read more.”
The distributed unit (DU) shares the load with the radio unit by running L1 functions on the RAN protocol. Marvell has been a proponent of OpenRAN with the O-RAN platform, which is an open protocol and open platform that allows Marvell’s hardware to be used with various software vendors. Facebook (Meta) is a partner with Facebook Connectivity.
DPU processors, or digital processing units, are gaining traction for 5G transport, 5G RAN intelligent controllers, edge computing and cloud data center workloads. These hardware accelerators enable high speed connectivity and can improve packet processing rates by 5X. DPUs are ideal for power sensitive edge applications. Marvell’s strength in DPUs is one reason it may be able to stave off competition, which in the narrow field of 5G base stations includes Qualcomm/HPE and Analog Devices. Beyond 5G, Marvell has other competitors for DPUs such as AMD/Pensando and Nvidia.
Regarding 5G, over 7 million of the Octeon processors have been used in 3G, 4G and 5G base stations with Tier 1 customers. In the past, we reported that Samsung and Nokia use Marvell, and supplying these particular companies was a tailwind when Huawei was blacklisted. More recently, Marvell has stated they have design wins with four of the top five global OEMs and next-tier OEMs building base station equipment. These design wins are based on the 5nm platform.
Marvell uses TSMC for the 5nm OCTEON DPUs and this is an advantage because Marvell has the 5nm now and is able to move quickly on a 3nm release.
Notably, 5G has been a long time coming but I do believe it will reward investors over the next few years. Technavio has a CAGR of 67% for 5G equipment through 2025. The growth trend of 5G/edge computing is not one that we plan to complacent on as it will provide the next leg up for substantial capex spending similar to data center capex spending.
Enterprise Networking:
Marvell sells ethernet switches and ethernet PHYs to IT managers and networking equipment manufacturers. The company uses DSP technology for CAT5e ethernet cables to supply data rates up to 5Gbps with support for CAT6 and CAT6a.
Management discussed on the call that the main driver for this market right now is wireless, specifically WiFi 6 as the wireless rate line is now faster than the wired rate. The call also pointed toward content per port going up in the transition to multi-gig. According to the CEO, “it's not like 10%, 20%, 30%. It's sort of multiples on a per port basis of where it was before.”
Increased enterprise share and content gains from wired and wireless enterprise networking drove 53% YoY revenue growth and 19% QoQ revenue growth.
Automotive:
Similar to the networking that Marvell supplies enterprises and the data center, Marvell also supplies auto manufacturers with ethernet PHY transceivers, camera bridges and switches for in-vehicle networks. This is used for things like collision detection, lane warnings, and autonomous driving.
Marvell believes Ethernet will be the backbone for connected and autonomous vehicles to connect the electronic control unit (ECUs), cameras, sensors, and central compute devices. The Ethernet device is called Brightlane.
ON Semi has partnered with Marvell on use cases such as pairing a standardized protocol, such Ethernet PHY, with ON’s portfolio of ultra-dynamic range image sensors.
Automotive was up 46% to $84 million, yet was down 6% sequentially. Management cited supply issues rather than demand. Marvell counts eight of the largest 10 OEMs worldwide and 36 OEMs total. The company believes revenue growth will be 40% next quarter.
Note on Consumer Market:
Marvell sells hard disc drives (HDD) and solid state disc (SSD) controllers. This is a weaker segment, declining 1% YoY and 8% sequentially to $164 million. For next quarter, Marvell expects revenue to be down 10% YoY and flat sequentially.
Conclusion:
There is a new, powerful trend on the way that is on par with the cloud computing trend. This trend of edge computing will rely on distributed computing rather than centralized processing. Both will exist and rely upon each other but edge computing will have a stronger growth trend when it breaks ground (by virtue of being new/rapidly expanding). Much of this will be in sync with the 5G buildout.
Marvell has the potential to be a strong stock during this buildout as the company provides the base station hardware, supports MIMO antenna rays, beamforming, and accelerates 5G transport and controllers which results in high-speed connectivity.
The company also provides electro-optics and silicon photonics for increased data rates and a network fabric for edge computing. The edge is defined as many things, but what all definitions can agree on, is that the edge needs superior connectivity/networking. Electro-optics, silicon photonics, DPUs, SmartNICs and ethernet in the data center are a warmup for Marvell supplying edge servers and edge devices. As this occurs, the demand for Marvell’s product suite will increase.
In addition to this, Marvell is thinking outside the box by focusing on restructuring memory while most companies are focused on more powerful chips. CXL drives down costs on DRAM and is likely to rapidly adopted by hyperscalers once it becomes available. There’s no guarantee that Marvell will be the one to win the contracts but it’s certainly a front runner.
This article was originally published on Forbes on Sep 23, 2022,04:33pm EDTForbes on Sep 23, 2022,04:33pm EDT
Nvidia had a big week with GTC 2022 and management is clearly ready to rumble against any excess inventory from crypto mining. The negative catalyst from crypto mining and Nvidia's price action is eerily similar to Q4 2018/Q1 2019 —- yet the company is not the same company it was four years ago. This is apparent by Nvidia flexing some major product muscle by timing it's best-ever gaming release and it's best-ever AI chip to hit the market in October.
We draw important parallels (pun intended) between the last crypto mining selloff and this selloff with key reasons as to why this time the stock's comeback will be quicker.
Nvidia stock has been in the clutches of a steep drawdown after the company has faced nearly every headwind imaginable: United States-China tensions, supply chain disruptions spanning many components, tough comps on the data center, tough comps on gaming, and a less-than-rosy macro environment.
The most impactful headwind, however, was Ethereum’s merge to Proof of Stake (PoS), which ultimately lowers demand for gaming GPUs. This contributed to a $2.5 billion cumulative miss in revenue driven by the gaming segment.
Nvidia’s stock performance in 2018 and 2022 feels eerily similar as the stock sold off 54% in 2018 specifically because of a gaming miss tied to crypto mining. Today, Nvidia is currently 57% YTD.
It took eighteen months for Nvidia to recover its all-time high from the Q4 2018 selloff (Sept 2018 through Feb 2020). Despite the uncanny similarity that 2018 and 2022 may have — Nvidia is actually a much stronger company today than it was four years ago.
Below, we discuss a few key reasons Nvidia stock will recover quicker this time around.
Drilling into Parallels Around the Gaming Miss
During the Q3 2018 results released in November 2018, Nvidia gave Q4 2018 revenue guidance of $2.7 billion, below the analysts’ consensus estimate of $3.4 billion. In January 2019, the company again lowered revenue guidance from $2.7 billion to $2.20 billion, which suggests a total revenue miss of $1.2 billion. Gaming revenue in Q3 2018 was $1.76 billion, up 13% YoY and down 2% QoQ. In Q4 2018, gaming revenue was $954 million, down 45% YoY and down 46% QoQ.
In the most recent quarter ending July 2022, the company missed on gaming with revenue of $2.04 billion, which is 33% lower than the year ago quarter and 44% lower sequentially. The company is expecting a further decline in gaming sequentially for Q3. According to one analyst on the call, they are modeling for a further 30% sequential decline in gaming and professional visualization offset by low to mid-single digit growth in data center and automotive. The CFO affirmed this understanding is correct.
After 2018, although it took Nvidia eighteen months to reclaim its all-time highs, in 2020-2021, Nvidia would go on to stage a remarkable turnaround as the stock led tech mega cap stocks in gains. This was not simply because all tech performed well during those years – if you compare Nvidia to Meta, Amazon and Google, you’ll see something unique occurred with Nvidia that caused the stock to outpace its peers. In all cases except Apple, Nvidia doubled, tripled or quadrupled the performance of other mega cap stocks.
Source: YCHARTS
Perhaps most impressive, Nvidia is still in the lead over all mega cap stocks despite a 57% drawdown this year. It’s the company’s past performance that makes it well worth the time to answer: can Nvidia do it again?
Sign up for I/O Fund's free newsletter with gains of up to 403% – Click hereSign up for I/O Fund's free newsletter with gains of up to 403% – Click hereClick here
Nvidia’s GeForce RTX 40 Series is Perfectly Timed
Next quarter, Nvidia was expected to report $6.92 billion and the company guided for $5.9 billion. This is down from $7.10 billion in Q3 of last year. This will be a 17% decline in revenue. Due to this, analysts expect Nvidia to end fiscal year 2023 with 0.8% revenue growth, or $27.13 billion in total revenue.
It’s not only the top line valuation that is affected by this cut in guidance but it’s the bottom line, as well. In previous quarters, high average sales prices drove $2 billion to $3 billion in operating profits and net profits, whereas in the most recent quarter, the company is reporting $500 million and $656 million, respectively.
The GAAP EPS reported was $0.26 compared to $0.94 in the year ago quarter. Adjusted EPS was $0.51 versus $1.04 for the year ago quarter.
Although it’s tempting to redirect the conversation toward higher-growth segments, the $2.5 billion total miss between two quarters came from gaming and it’s prudent for investors to start here (for now) when analyzing the stock for a potential recovery.
The company stated the miss was driven by both lower units and lower average sales prices including reduced consumer demand. The company is not commenting on crypto as they state they have no visibility here as to how the GPUs are being used, however, it’s certainly contributing to the bulk of this decline.
Notably, AMD reported gaming growth of 32% to $1.7 billion which provides a better picture of reduced gaming demand minus crypto. Nvidia believes some of their weakness is also from preparation for a new product generation that will be announced this month.
Per the earnings call, there are two ways that Nvidia plans to overcome the crypto mining selloff which could produce a faster rebound than 2018.
First, Nvidia is restricting supply on its current gaming model. Per the CFO: “Across those two quarters, the Q2 of ‘23, the Q3 of ‘23, we have likely undershipped gaming to our end demand significantly.”
Following the call, we estimated for our premium members that the amount undershipped is a minimum of $1 billion. The reason behind this is to help keep prices stable and to increase demand for the RTX 40 Series.
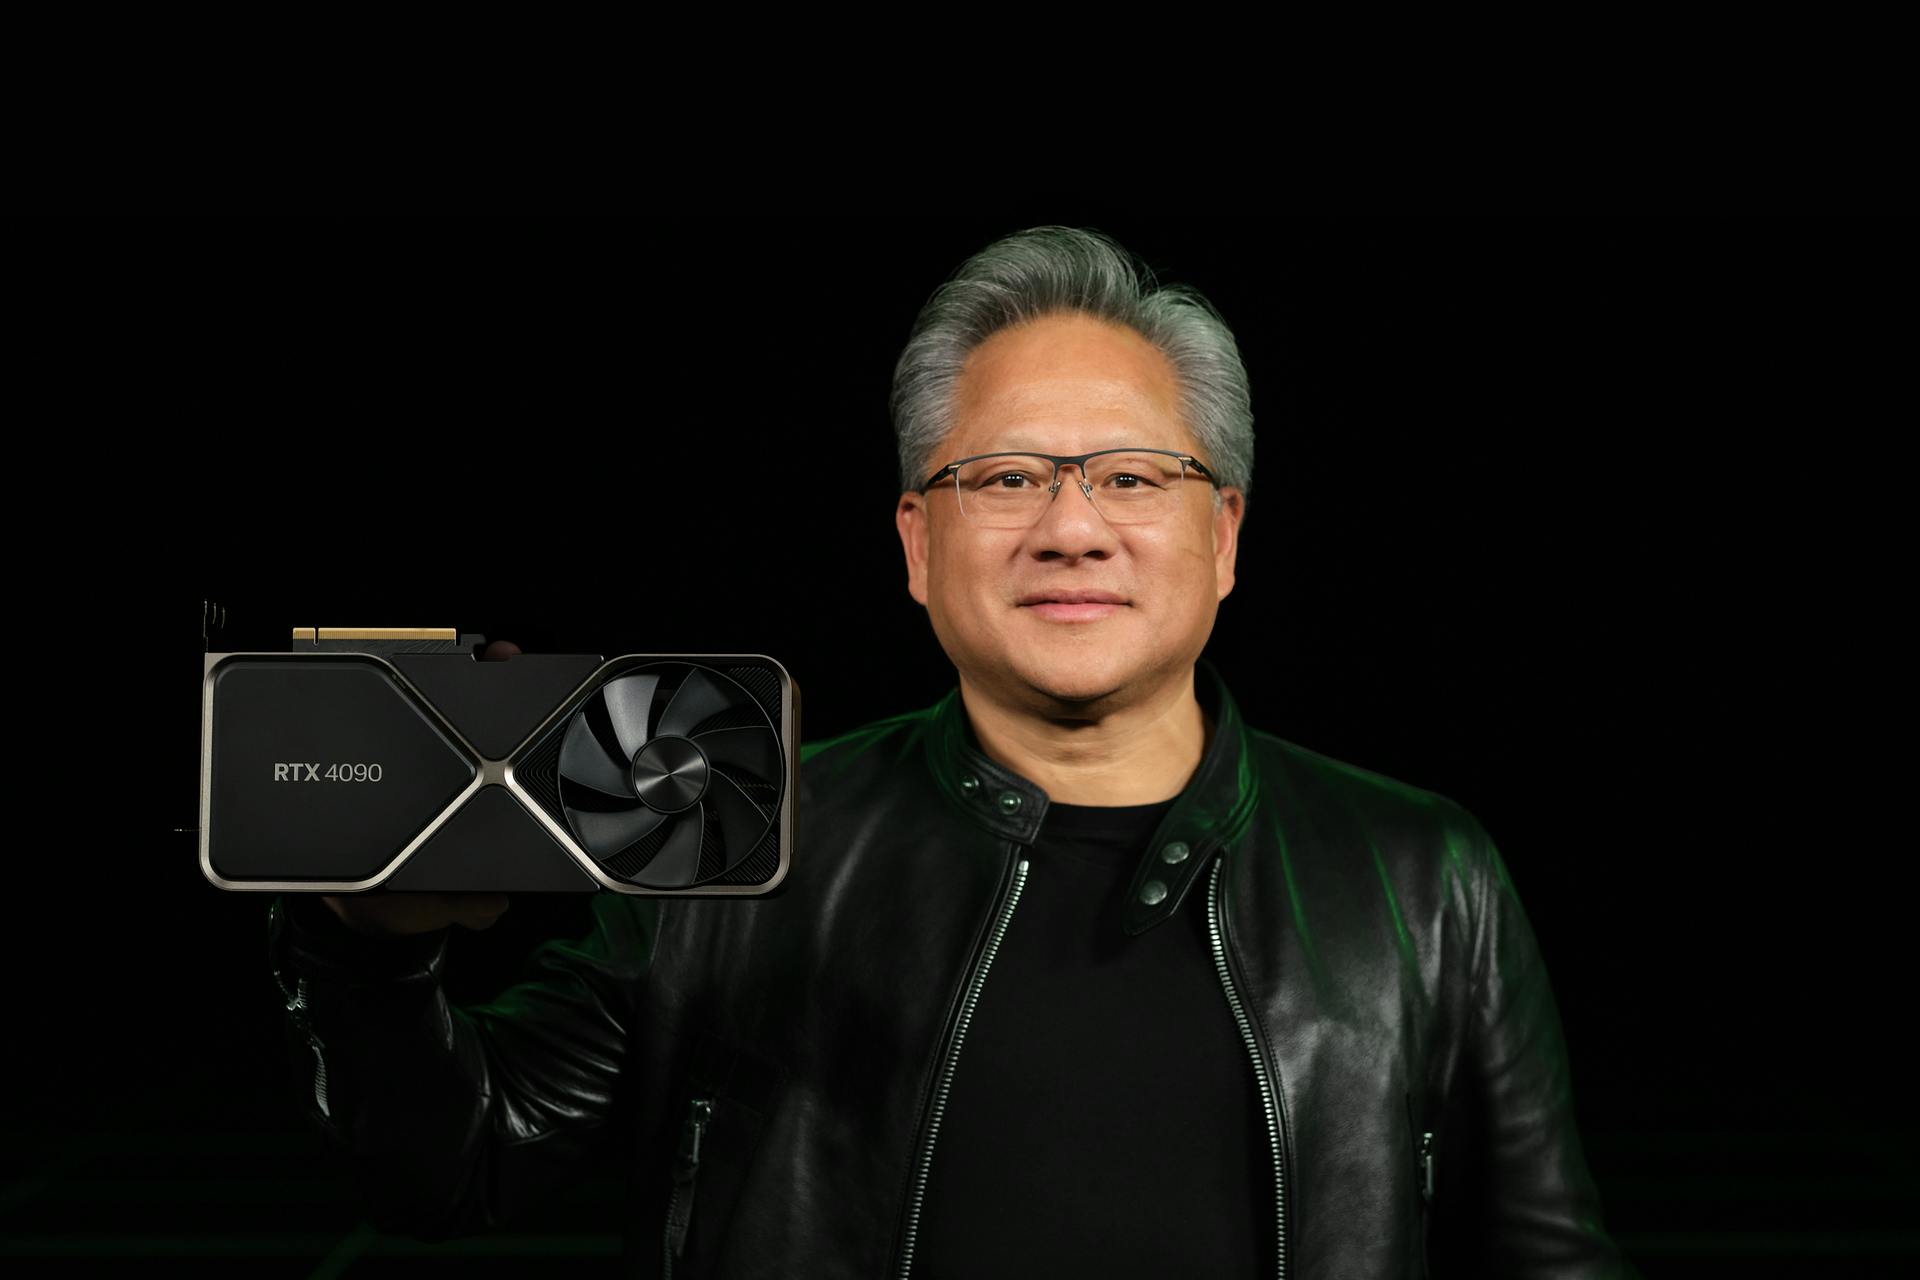
Second, Nvidia announced its GeForce RTX 40 Series at the GTC 2022 Conference this week.
The new Ada Lovelace architecture which uses 76 billion transistors and a 4nm production process. In the keynote, the CEO stated: “Nvidia engineers worked closely with TSMC to create the 4N process optimized for GPUs. This process let us integrate 76 billion transistors and over 18,000 CUDA cores, 70% more than the Ampere generation.”
The improvement from 8nm to 4nm means more transistors on the GPU, which results in better performance as the 4nm processes data faster.
In the gaming world, this much anticipated release is expected to be 2-4X faster than the RTX 3090 Ti. The flagship AD102 GPU model will have 144 individual streaming multiprocessors (SMs) in one die compared to 84 SMs in the Ampere architecture. As stated, the AD102 will also have a 70% increase in CUDA cores over the RTX 3090 Ti.
In addition to this, Nvidia is releasing a new feature called Shader Execution Reordering (SER) which will improve ray-tracing performance by 3X with 25% faster frame rates. Rather than deliver workloads sequentially, the GPUs are able to reorder the workloads to process more workloads at once which results in more power and better performance.
Deep learning super sampling (DLSS) refers to using AI to predict the next pixel. The new DLSS 3.0 not only predicts pixels but will also use AI to predict frames. This results in “up to four times” better performance over traditional rendering.
The first release date for the RTX4090 models is October 12th with a starting price of $1,599. There is a second release date in November for the RTX4080 models with prices of $1,199 and $899. Notably, mid-range RTX 40 series will outperform the previous generation’s high end models. This is due to the Ada Lovelace architecture which offers 1,400 Tensor TFLOPs versus 320 Tensor TFLOPs which means the DLSS is superior and the high-end RTX 30 Series cannot compete with the mid range RTX 40 series.
The popularity of this release will help determine if Nvidia can stage a comeback in the gaming segment. Here is what analysts are saying:
“Morgan Stanley analyst Joseph Moore said his "biggest takeaway" from the keynote at Nvidia's GTC conference were the higher prices of gaming GPUs, which increases his conviction about the pace of gaming revenue recovery next year. Prices that are 28% higher than the baseline price from two years ago for the higher volume 4080 should drive material growth in revenue, said Moore, who sees revenues in the gaming segment rebounding from the current quarter run rate of $5.5B or so to $9.5B next year.”
“Given the channel inventory work downs in the July and October quarters, the products should be "strong demand catalysts" into 2023, Harlan Sur of Chase tells investors in a research note.”
Nvidia Continues to Build a GPU Moat with H100
In 2018, we stated in our free newsletter that Nvidia had built a moat in the GPU-powered data center. This was a bold statement as the company would go on to have negative year-over-year data center revenue in 2019. Yet, fast-forward and it’s quite clear that Nvidia is unshakeable in this segment, which has surpassed gaming as Nvidia’s most valuable segment.
I’ve written quite a bit about Nvidia, which you can reference here and also here. However, I will keep it simple by saying the A100 GPU is what led the company’s gains since Q2 2020 (detailed here) and the Hopper H100 GPU is what will lead the company’s gains for the next two yearsdetailed here) and the Hopper H100 GPU is what will lead the company’s gains for the next two years.
In the most recent quarter, data center revenue of 61% is down from 83% last quarter yet accelerated YoY from 35% growth in the year ago quarter. The earnings call reviewed some of the challenges Nvidia faced in the quarter that led to the 1% sequential growth.
First, Chinese hyperscalers slowed their infrastructure investment this year yet the slowdown is unlikely to last much longer. Due to being a large market for Nvidia, the data center growth was impacted by this. The reason Nvidia was able to meet expectations is because “North America doubled year-over-year in revenues.” As of now, supplying the Chinese military is restricted for Nvidia, but this does not include supplying the hyperscalers.
Second, demand continues to outstrip supply yet there are many components to Nvidia’s systems and they are experiencing supply chain issues.
“We were challenged this quarter with a fair amount of supply chain challenges because as you know, we don’t just sell the GPU chip, but these systems are really complex with a large number of chips in the system components that we offer like HGX […] all of the components that have to come together for us to be able to deliver the final component.”
H100 Hopper Coming in October
On the earnings call, an analyst asked if the company expects data center growth to re-accelerate when Hopper ships: “Do you think that Hopper, as that comes fully available, it sounds like in fiscal 4Q, that you actually see Data Center growth reaccelerate as that product cycle materializes.”
The CFO Kress stated: “Our Data Center yes, we do expect it to grow. It may grow about what we just saw between Q1 and Q2. We’ll continue to look at it.”
I believe this means the data center will accelerate above 61% but not to exceed the 83% from Q1. Ultimately, the CFO may not have full visibility into Hopper sales until the units ship and are tested by customers, who in turn, often buy more if the product exceeds expectations.
On that note, the new 4nm chips are bound to impress. The H100 GPUs and the DGX H100 server pods and super pods offer Nvidia the next leg-up as the company has solved an important bandwidth issue.
Hopper tackles some of the bigger issues around previous generations like speeding up algorithms by offering dynamic programming on GPUs to break down problems to simpler subproblems. The new GPUs also boost bandwidth by 3X with SHARP in-networking computing and Infiniband Switches, and the H100 can leverage NVLink to connect eight H100s into one giant GPU for 640 billion transistors, 32 petaflops, 640GB of HBM3, and 24 terabytes per second of memory bandwidth.
The H100 has about 50% more memory and interface bandwidth than the A100. That’s 1.5X more bandwidth with the NVLink connection and PCIe 5.0 doubling the bandwidth of PCIe 4.0. The H100 will ship with support for 80GB of HBM3 memory at 3 TB/s speed
Where the H100 really stands apart is the leap in performance with about 3X more performance than the A100 and the H100 is up to 6X faster. The A100 lacked support for FP8 compute at default whereas the H100 will leverage a transformer engine to switch between FP8 and FP16, depending on the workload.
According to Nvidia, the H100 delivers 9X more throughput in AI training, and 16X to 30X more inference performance. The company also states in HPC application-specific workloads, the H100 is 7X faster. The goal of the H100 was not only to add more transistors and make the H100 faster, but to also offer function-specific optimizations. This is achieved through the transformer engine.
Last week, MLPerf published artificial intelligence performance tests. The parent company MLCommons provides the industry standard for benchmarking deep learning, AI training, AI inference and HPC. The H100 Tensor Core GPUs delivered 4.5X more performance than the A100 in offline scenarios and 3.9X more in the server scenario compared to its predecessor the A100.
The Hopper H100 GPUs are in full production and availability starts next month and will have over 50 server models by the end of the year and “dozens more in the first half of 2023.”
Sign up for I/O Fund's free newsletter with gains of up to 403% – Click hereSign up for I/O Fund's free newsletter with gains of up to 403% – Click hereClick here
Nvidia’s Automotive Opportunity is Massive
Nvidia’s lead in automotive across dozens of OEMs requires its own analysis, which we will write for our free newsletter subscribers next year. Hyperion 8 is shipping in 2024 and Hyperion 9 will ship in 2026. However, as long-term Nvidia investors, now is a good opportunity to remind my readers of the long-term vision for yet another large and sweeping revenue segment.
Although a small segment today of only $220 million, automotive grew 59% sequentially and 45% year-over-year. The company has a $11 billion automotive design win pipeline.
At GTC this week, Nvidia announced a new superchip named “Thor” which will deliver 2,000 teraflops of performance, up from 200 teraflops from the current generation “Orin.” The chip has a transformer engine which can process video data as a single perception frame and offers 8-bit floating point (FP8) precision to avoid task loss when converting model data from one platform to another platform.
More on the Omniverse
We’ve covered the Omniverse platform in the past including an interview with Nvidia’s Richard Kerris you can view here.
At GTC this week, Nvidia launched Omniverse Cloud, which is a infrastructure-as-a-service software offering to reduce the complexity around building 3D virtual worlds and assets. This removes the need for local compute power and opens up the ability for more creators to access 3D world creation.
Regarding the China Restrictions
The United States government is restricting sales of high-performance chips to China as Nvidia’s AI chips could be used for military purposes. A spokesperson for Nvidia stated the products where the new licensing requirement applies is the A100, H100 and systems that include DGX.
The restrictions apply to Russia yet Nvidia has stated there is no exposure to Russia for their products. In a recent SEC filing, the company stated: The Company’s outlook for its third fiscal quarter provided on August 24, 2022 included approximately $400 million in potential sales to China which may be subject to the new license requirement if customers do not want to purchase the Company’s alternative product offerings or if the USG does not grant licenses in a timely manner or denies licenses to significant customers.
At this time, Nvidia has applied for an exemption and there has also been a clarification that Nvidia can continue to develop the H100 in China through September 1, 2023 through the company’s Hong Kong facility.
Per the SEC Filing dated August 31, 2022:
The U.S. government has authorized exports, reexports, and in-country transfers needed to continue NVIDIA Corporation’s, or the Company’s, development of H100 integrated circuits after the Company filed its Current Report on Form 8-K with the U.S. Securities and Exchange Commission on August 31, 2022. The authorization also allows the Company to perform exports needed to provide support for U.S. customers of A100 through March 1, 2023. Additionally, the U.S. government authorized A100 and H100 order fulfillment and logistics through the Company’s Hong Kong facility through September 1, 2023.
Some analysts have stated that being granted an exemption is “feasible.” Mark Lipacis of Jefferies is modeling for a $200 million hit to October rather than the $400 million identified risk. Harlan Sur of JP Morgan noted AMD is working on getting export licenses for its customers and helping them transition to products that fall below the performance threshold to help mitigate the downside risk.
According to a new report, Nvidia has asked TSMC to rush high-end GPU orders before the US sanctions begin. The report says that TSMC has a special program to speed delivery of orders at a higher negotiated price and can help to cut the delivery time in half. This could lead to a surprise bump in Q4 revenue for the company.
Conclusion
Nvidia is not the same company that it was four years ago. In 2018, Nvidia was a gaming company with promising AI tailwinds. Today, Nvidia’s AI products serve nearly every enterprise company’s artificial intelligence and machine learning ambitions.
The company has an impressive launch schedule starting in October for two flagship products – the RTX 40 Series and the H100 GPU. The timing of these releases is no coincidence as it’s a rapid two months following the crypto/gaming revenue miss. Suffice to say, Nvidia’s management team is prepared to rumble —- putting its very best release in gaming and its most powerful AI chip to-date up against the crypto mining selloff. If history is any indication, the turnaround will only be a matter of time.
Please note: The I/O Fund conducts research and draws conclusions for the company’s portfolio. We then share that information with our readers and offer real-time trade notifications. This is not a guarantee of a stock’s performance and it is not financial advice. Please consult your personal financial advisor before buying any stock in the companies mentioned in this analysis. Beth Kindig and the I/O Fund own shares in NVDA at the time of writing and may own stocks pictured in the charts.
Snap has a rock bottom valuation of 4 P/S and the stock has not traded here in the entirety of its public market history.
In fact, this is nearly 50% lower than the March 2020 Covid low when it traded at 7 P/S. The Covid March low matches the previous low from Q4 2018.
I believe Snap is oversold and we hope to capture this opportunity.
Q2 2022 Earnings
As long as the FED is raising rates, then the primary reason to close a position will be due to a company’s declining cash profile and/or declining margins. Snap provided a shocking report on the bottom line in Q2 and we had no choice but to exit and regroup.
We covered this briefly here when we said: “The other negative to Snap’s report included more losses on the bottom line. Free cash flow is at ($147) million in the most recent quarter. Adjusted EBITDA fell from +$117 million to +$7 million. GAAP net losses went from ($152) million to ($422) million.”
Some of this is driven by the company’s generous stock-based compensation which totaled $1.2 billion over the trailing twelve months, or about $300 million per quarter. That’s 50% of the company’s gross profit.
There was a $500 million stock repurchase announcement in July with 3% of outstanding shares purchased as of August 31. This helps to offset SBC dilution.
However, there is new information regarding Snap’s bottom line as of August 31 and September 6th:
In August, Snap announced a 20% reduction in work force and will reduce operating expenses through restructuring its products to cut back on Other Bets, such as drones and Originals.
This will result in a $500 million operating expense reduction relative to Q2 2022 which includes $50 million from content costs and $450 million from personnel and opex cost reductions. Of the total $110 to $175 million in transition costs, the majority will be reflected in Q3 2022 with $95 million to $135 million incurred as an adjusted operating expense.
Snap stated this will result in “adjusted EBITDA and positive free cash flow at current revenue levels” which will “drive meaningful operating leverage when revenue growth accelerates.”
One week later, there was an additional leaked memo on September 6th where the CEO stated his 2023 goals are for $6 billion in revenue, adjusted EBITDA above $1.5B and free cash flow above $1 billion. This would represent 20% growth on the top line. The memo also pointed toward 30% growth in DAU to 450M, up from the 352M the company reported last quarter.
My interpretation is that DAU will outpace revenue growth because DAU growth will come from Rest of World where users are monetized at a lower rate than North America and Europe. This has been the trend over the past year in Snap’s key metrics.
Of the $6 billion in estimated revenue for 2023, Snapchat+ will contribute $350 million in revenue next year. The premium subscription currently has 1 million subscribers and is expected to reach 4 million by the end of 2022.
Following the announcement, analyst Mark Mahaney stated he is modeling an EBITDA margin of 17% for FY2023 up from 9% in FY2022.
“Evercore ISI analyst Mark Mahaney raised the firm's price target on Snap to $17 from $14 and keeps an In Line rating on the shares as he is "modestly increasing" his FY22-FY23 revenue estimates and also raising his EBITDA estimates following the company's intra-quarter update on August 31. He is now modeling a meaningful EBITDA margin expansion to 17% next year from his estimate of 9% margin in FY22, driven by cost reduction initiatives and scaling of the business, Mahaney noted.”
Morgan Stanley is in line with Mark Mahaney with a 9% margin this year to $670 million and $919 million for FY2023.
“Morgan Stanley analyst Brian Nowak raised the firm's price target on Snap to $10 from $8 following Snap's recent better than expected August ad update and announcement of a $500M cost reduction plan. Nowak has raised his FY22 and FY23 revenue estimates by 9% and EBITDA forecasts to $670M and $919M, respectively, but keeps an Underweight rating citing low near-term visibility and still-high execution risk.”
That would put Snap back on track for a H2 profile similar to 2021 for adjusted EBITDA of about $118 million in Q3 and $229 million in Q4. I’m basing this off 2021 when Q4 was roughly 2X the profitability of Q3.
Perhaps most importantly, if Snap does achieve the $6 billion, then Mark Mahaney is modeling $1 billion in adjusted EBITDA. In 2021, Snap had adjusted EBITDA of $617 million. If we go with $1 billion conservatively and $1.5 billion for a high estimate per the leaked memo, then this will be 1.5X-2X adjusted EBITDA in 2023 compared to 2021.
Overall, there has been a rapid turnaround in 30-day analyst EPS revisions that show Snap as the leading stock in the tech universe for 72K% change on the bottom line for FY2022.
What this means is that instead of Snap reporting ($0.09) EPS, the company is now expected to report $0.05 EPS.
The estimates for FY2023 are at $0.33 EPS, up from $0.16 EPS for FY2023 consensus before the announcement.
Regarding free cash flow, to put this in perspective, the company had negative FCF of negative ($147) million last quarter. The company will now be positive $1 billion in FCF for FY2023 compared to FCF of $126 million in FY2021. That’s a 8X improvement in two years. Assuming this happens, Snap is guiding for a remarkable turnaround in the cash profile of the company — which is the reason we are attracted to the stock once again.
Notably, it was not only Netflix’s entry into CTV ads that made the stock attractive in July/August, but the improving free cash flow guide from 2022 to 2023.
When the headcount reduction was announced, the CEO also disclosed that Snap was losing two of its top ad executives to Netflix. This is seen as a negative yet we are also keen on the Netflix opportunity and imagine the executives see what we see, which is global streaming juggernaut + CTV ads = (likely) a new trajectory.
The CTV ad opportunity is our top trend in media but we also like Snap at this valuation (both things are true). Snap’s audience is especially interesting for advertisers, but ultimately, product takes a back seat when there is a hawkish Fed. As we are seeing with MongoDB, the cash margin is too critical right now to move from a positive FCF to a negative FCF.
Revenue Growth and DAUs:
In a rising rate environment where cash is rerated with each Fed announcement, the bottom line is arguably more important than the top line (within reason). If Snap had not provided a significant improvement to the bottom line, then we would not be re-evaluating the stock.
Regarding the top line, Snap stated in the Investor Update on August 31st that “quarter to date” they are tracking 8% revenue growth for Q3.
What the CEO said in the September 6th memo regarding inflation and how he looks at revenue growth is important so I’ve pasted it verbatim here:
“In this inflationary environment, we need to adjust the way that we think about our revenue growth. With the U.S. Consumer Price Index at 8.5% growth year-over-year in July, and our Q3 QTD nominal revenue growth rate disclosed on August 31st at 8%, our revenue is growing -0.5% in real terms.
In short, if we are growing revenue below the rate of inflation, our business is actually shrinking. Meta’s revenue, in real terms, shrunk by nearly 10% in Q2, while our Q2 revenue grew approximately 4% in real terms. As we think about our revenue goals for next year, we need to consider the rate of inflation and factor it into our ambitions.
Our goal for 2023 is $6 billion in revenue, of which we will generate $5.65 billion of advertising revenue, and $350 million of revenue from Snapchat+.
Assuming that $5.65 billion of advertising revenue represents approximately 20% growth year-over-year, and assuming an 8% inflation rate, we would be generating approximately 12% year-over-year inflation-adjusted advertising revenue growth.
That’s a far cry from the 50%+ year-over-year average annual revenue growth we’ve generated over the past five years, but we believe it’s an appropriate goal in this environment. If we can generate $6 billion in revenue in 2023, we should be able to generate at least $1.5 billion in Adj. EBITDA and $1 billion of free cash flow.”
I believe the market has not moved much on this news because it requires a Q3 report and a Q4 guide to show if there’s any near-term acceleration from the paltry 8% growth. Essentially, the market will be looking for a sign that September was stronger than August. There is risk it September won’t be stronger than August and/or Q4 won’t be stronger than Q3, yet I/O Fund is subjectively comfortable with the risk as I believe the 4 P/S valuation is pricing in the worst case scenario.
We need DAU to remain strong, but judging by the CEO’s comments, that shouldn’t be a problem as the company provided the forecast of 35% growth over the next 18 months when the CEO said in the memo the goal was to: “Increase Daily Active Users to 450 million in Q4 ’23.” This is up from 352 million DAU in Q2.
Risks:
Snap’s management has struggled to provide accurate guidance in H2 2021 and H1 2022. This twelve-month period has seen (40%) drops in price and +58% gains in price in one day.
This is a volatile stock particularly because management’s guidance has been wrong. We have to take that into consideration when relying on management’s guidance for H2 2022 and FY2023. Morgan Stanley called it “execution risk” when referring to CEO Spiegel’s inability to guide correctly and navigate the many headwinds his company faces.
However, institutional analysts agree with the bottom line and the improvements that $500 million reduction in opex will lead to, including those that are underweight, so that’s helpful. The 8% revenue growth seems reasonable and not an over-promise compared to the 50% revenue growth that had been provided in 2021.
There is a risk that DAU misses as the 35% growth over 18 months is a strong guide.
The stock based compensation is high and viewed as a negative in this macro environment. This weighs on GAAP operating margin.
Conclusion:
Our decision to look for an entry is based on the stronger bottom line, the anticipated full 8X growth in FCF over two years coupled with a rock bottom valuation.
This article was originally published on Forbes on Sep 16, 2022,03:24pm EDTForbes on Sep 16, 2022,03:24pm EDT
Last June, we discussed key reasons that cybersecurity stocks would hold up particularly well compared to other cloud verticals. The analysis pointed to enterprise spending expected to increase in 2022 from the previous year, according to Chief Information Security Officer (CISO) surveys.
Considering the level of cloud spending in both 2020 and 2021, an increase on already high budgets is impressive. The CISO surveys state that 44% will increase budgets in 2022 compared to 41% in 2021 and only 2% are expect to decrease compared to 6% the previous year.
In a similar study from PricewatershouseCooper, 69% predict a rise in cyber spending for 2022 and 26% expect a surge of 10% or higher spending year-over-year. This survey was done across a broader C-suite and executive sampling.
Our analysis in June also pointed out that according to a Gartner survey, 88% of the Board of Directors viewed cybersecurity as a business risk. According to Paul Proctor, VP at Gartner, “The influx of ransomware and supply chain attacks seen throughout 2021, many of which targeted operation- and mission-critical environments, should be a wake-up call that security is a business issue, and not just another problem for IT to solve.”
We had also stated on Fox Business News that a small cohort of companies emerged this past quarter to increase the top line while also reporting narrowing losses on the bottom line. We feel not losing site of opportunities during selloffs is how generational wealth is built.
Sign up for I/O Fund's free newsletter with gains of up to 403% – Click hereSign up for I/O Fund's free newsletter with gains of up to 403% – Click hereClick here
Cybersecurity Stocks Report Another Strong Quarter in 2022
In Q2, cybersecurity stocks did not disappoint with revenue beats across the board. Although SentinelOne had the largest revenue beat, Crowdstrike had the largest beat from a higher revenue base.
Source: YCHARTS
We pointed out on Twitter that one reason for the strong beats is that cybersecurity is not subject to discretionary spending.
Source: Beth Kindig
Sign up for I/O Fund's free newsletter with gains of up to 403% – Click hereSign up for I/O Fund's free newsletter with gains of up to 403% – Click hereClick here
Palo Alto Networks and Crowdstrike have strong bottom lines and this is one reason both stocks have outperformed the Nasdaq this year. With that said, high growth is starting to gain traction again as SentinelOne and Zscaler have the stronger price action in the last 30 days.
Source: YCHART
In the chart below, we see a handful of cybersecurity stocks have been able to grow free cash flow, such as Crowdstrike, Zscaler and Palo Alto Networks. The strong free cash flow is occurring in addition to growing the top line, which indicates cybersecurity is not a “growth at all costs” industry.
Source: CHARTS AND INVESTOR RELATIONS
Conclusion:
Cybersecurity continues to be a top priority in budgets and the results are showing up again in Q2. We found a strong pattern with cybersecurity stocks sustaining growth rates and strong bottom lines in Q1 and also in Q2. The cybersecurity sector overwhelmingly beat estimates compared to other sectors within tech and investors should take notice of this strength.
Please note: The I/O Fund conducts research and draws conclusions for the Fund’s positions. We then share that information with our readers. This is not a guarantee of a stock’s performance. Please consult your personal financial advisor before buying any stock in the companies mentioned in this analysis.
We’d like to discuss a few stocks that are showing strong price action in the solar industry. Perhaps the most obvious front runner in clean energy right now is Enphase. The most recent quarter was exceptional as the company reported improving top line growth and an improving bottom line. The company also provided a strong guide for accelerating revenue (again).
Please reference our free analysis on The Inflation Reduction Act of 2022 and Europe's Energy Crisis here.
An important standout accomplishment from Enphase has been management’s ability to reliably meet its revenue guidance for fifteen quarters since its last miss in September of 2018.
The same is true on the bottom line with fourteen consecutive beats since Dec of 2018.
To have met guidance for 4 years is no small feat considering we’ve been through a pandemic and had ongoing supply disruptions that has directly impacted the solar industry. Given the many variables we’ve seen in the last four years, this is the only company that I recollect accomplishing this. Certainly, it instills confidence that management will meet/beat moving forward compared to its lumpy solar industry peers.
Enphase reported Q2 growth of 68% for revenue of $530 million. This is up from revenue growth of 46% last quarter. Guidance is for revenue growth of 75% for Q3 to $613 million and analysts are expecting 60% growth in Q4 to $664 million.
The company also provided the following on the call: “We shipped approximately 1,213 megawatt DC of microinverters and 132.4 million megawatt hours of IQ Batteries in a quarter” with the company guiding for 130 to 145 megawatt of IQ batteries in Q3. This is up from 120 megawatt hours in Q1.
Microinverters shipped were up 39.7% which marks an acceleration from the 15.7% year-over-year change in Q1. This is down from the peak of 117.2% in Q2 2021 but it’s also a boon that Enphase delivered this growth on top of the hard comp.
In the United States, the revenue increased 15% sequentially and 66% year-over-year. Europe revenue grew 89% year-over-year and 69% sequentially.
Right now, fiscal year revenue is slightly decelerating from 78% growth in FY2021 to 63% expected growth for FY2022.
Management stated they’ve grown IQ battery shipments by 28% per quarter over the last two years in North America and are now introducing these batteries into Europe.
Gross margin is a tick higher than it’s been in the most recent quarters at 41% compared to 40% in FY2021. Gross margin guide was for a range between 38% to 41%. The gross margin is expected to improve when IQ8 reaches scale.
Operating margin expanded to 17% in Q2, up from 14% in the previous quarter and up from 15% in FY2021. Net margin is improving, as well, at 14.5% up from 12% last quarter and 10.5% in FY2021.
Enphase saw a sizable increase in operating cash flow to $201 million, up from $102 million in the previous quarter.
The margin of 38% is nearly double what it’s been in previous quarters. Free cash flow also doubled to $192 million, up from $90 million in Q1. This is 2/3 of the cash flow from all of FY2021, which was at $300 million for the year. This increase was due to higher revenue and an improved cash conversion cycle in Q2.
GAAP EPS is at $0.54 compared to $0.28 in the year ago quarter. Adjusted EPS is at $1.07 compared to $0.53 adjusted EPS in the year ago quarter.
With that said, Enphase has a debt to cash ratio of 1:1. This reflects cash and marketable securities of $1.25 billion and debt of $1.29 billion. Given the current cash profile of the company, this should improve but does need to be monitored.
Note on Valuation
Enphase is not the easiest entry when it comes to valuation. The stock had a blowoff top moment in November of 2021. This aside, the stock is not reliable where it’s currently trading with little success of trading above this top line valuation. In a perfect world, we would find an entry around 10-12 forward P/S or 15 current P/S. That may seem like wishful thinking yet we want to be prudent as solar can be volatile.
Given the strength of the earnings report, we are trading at the stock’s highest valuation on a forward PE ratio in 2022 of 70. Previously, a forward P/E of 50-55 was the top for this stock in 2022. In other words, we will need another blowoff November top to see gains from here, if history is any indication. OR, Enphase will need to start a new valuation trajectory which is risky to predict without more data to support this conclusion.
Product Overview: IQ8 Inverters
Enphase has six models of microinverters in the IQ8 line, which are popular for their performance during a grid outage. Due to IQ System Controllers and IQ Load controllers, the system can sustain off grid. What is unique about the IQ8 is that the system will continue to perform off-grid even without a battery although the battery option is also popular.
The IQ8 Microinverter offers a microgrid with split-phase power conversion that converts DC power to AC power. Because solar panels only produce DC power, inverters are necessary to convert this to alternating current (AC), which is the current that houses use for energy needs. The DC to AC conversion and solar output is performed through the IQ8 and is done off-grid.
The System Controller or “smart switch” connects the home to the grid power, batteries and the solar photovoltaics, and transitions the system from grid power to backup power. The Load Controller sheds non-essential loads to offer longer off-grid power. The IQ battery offers up to 10kWh of energy capacity, so rather than feeding power back to the grid, the system stores the back-up power for future use.
Notably, the system is modular so a home owner can start small and build a bigger system over time. The system also does not require a battery for off-grid power, and thus, the IQ8 can be more cost effective for entry-level systems. The IQ8 is not compatible to existing systems, however, so it’s only available for new installs.
The secret sauce for the IQ8 Inverters is a customized, proprietary ASIC chip that can quickly change loads and grid events, which ultimately reduces the required battery sizing and battery power. The system adjusts according to the amount of electricity it has access to and this brain or intelligence is helpful when a system is off grid either temporarily or permanently. It also helps to store more energy by knowing when a house has excess power.
Another key feature is the microinverters come with a 25-year warranty and the battery has a 10-year warranty. My understanding is this is an industry-leading warranty, which is key for this level of home or commercial investment.
The IQ8 was first tested in Australia in 2017 due to “anti-islanding” which refers to grid-connected inverters that must shut down when there is a loss of electricity supply from the grid. The reason for shutting down the inverters is to protect the power line workers who are restoring the system. The solution that Enphase designed were the IQ8 models which are “always on” by combining the inverters, batteries, system controllers and load controllers listed above for a mini grid that can produce power from the sun and efficiently store this power at night.
Although California comes to mind for a region that shuts down its grid frequently due to wind storms to prevent fires, or perhaps Texas during the ice storm, this is also in demand globally where there are weak grids (Latin America) or no grid (Africa and parts of India). The company has cited in the past that there are 1.2 billion people who can benefit from the IQ8 due to persistent and permanent grid issues. The company’s current revenue mix is 80% United States and 20% international.
To understand how impactful the IQ8 has been for Enphase, consider that right now it comprises 37% of the company’s shipments and Enphase management expects this to reach 90% by Q2 2023. That is a lot of growth for one product in four quarters’ time.
IQ8 Inverter and IQ8 Batteries Discussions on the Earnings Calls
When asked on the call why the IQ8 system is performing well compared to competitors, the CEO responded:
“Yes, I mean we IQ8 provides a lot of value. Three things is sunlight, backup. Basically, when the grid is out, IQ8 continues to work and provides power, one; number two, it removes any limit on solar to storage ratio, which is the limit of today. In other words, you can have a lot of solar with very tiny storage, and the extreme end being zero storage, that's number two.
Number three is sunlight jumpstart, which means that in other batteries when you completely drain the battery, because you use it overnight, and you accidentally drained it, you accidentally drained it in the morning, IQ8 can come and independently jumpstart the batteries. Because it can provide — it can generate its own microgrid and kickstart the battery.”
Here was another lucid moment on the call when management described why they’re pulling ahead:
“We are trying — we have with the home energy management solution that we have, we are providing a very comprehensive solution. This is not just about the solar part, not just about the battery part or just about the EV part or managing the heat pump, etcetera. Our goal is to provide a one stop shop, a completely comprehensive solution. And everything is managed from software with a home energy management system. This is true in Europe. And actually, it's true here as well.
So for us, our value-add when we think about relative to competition is not look at any one single piece. Although we have to be better than them in every individual component that we are building. But it is about looking at the overall solution. So the homeowner has a great experience where they have one app, and they see they get unprecedented visibility into the performance of their entire system.”
IQ8 battery shipments grew 28% per quarter over the past two years. The company is releasing a third generation in early 2023. According to the earnings call, this battery will “deliver double the power enabling homeowners to start heavy loads.” The release is slightly delayed due to increasing the AC Power of the microinverter following feedback.
The company stated they currently have manufacturing capabilities of 5 million microinverters and will soon have a 6 million capacity after expanding manufacturing to Romania. Enphase is expanding rapidly into Europe including the IQ batteries after launching the IQ batteries two years ago in North America.
The energy crisis in Europe a catalyst as this drives more demand for self-consumption due to high utility rates and feed tariffs. However, Europe has a more stable grid than the United States and other regions, and thus, the sunlight backup is not as desirable as other regions.
Management stated the following on the call regarding the size of the German market: “The last I heard is it's roughly two gigawatts residential time adopting solar. And I'm hearing 80% attach, so two gigawatts times 80% is 1.6 gigawatt hours of batteries, that's the market.”
To put that in perspective, Enphase shipped 130 to 145 megawatts of batteries or 580 megawatts per year. At 1.6 gigawatt, or 1600 megawatts, the German market alone is 2X the annual output of Enphase. The company also serves Belgium, the Netherlands, France, Australia, South America and Latin America, to name a few.
Enphase is expanding into EV charger market following the acquisition of ClipperCreek. Enphase-branded chargers for residential homes are expected to go to production this quarter. The company stated the smart EV charger will be introduced to customers in the United States and Europe in early 2023.
In the opening remarks, management stated they have a “healthy” level of inventory in Q2 although storage channel inventory “was a little elevated due to longer installed times.” As stated in the introduction, the company has instilled confidence in analysts and investors for how management has navigated supply chain issues with a beat on every earnings report during the supply crisis. Notably, the supply chain issues are affecting Enphase less so than the company’s competitors and Enphase has actually been able to pull ahead in regions such as Europe for this reason.
Praneeth Satish
Got it. And then just staying on Europe. I mean, it sounds like you're gaining share, partly because competitors don't have supply. So I guess what happens when competitors there rebuild supply? Do you think that'll impact your growth? Or do you think once an installer tries an Enphase product, they don't go back to competitors? Like it's just how durable is the growth? Thanks.
Badri Kothandaraman
Well, we cannot be arrogant. We need to create meaning. We need to provide value to the installers, which is high quality, which we think we are quite good there when compared to competition. So we are good there in terms of customer experience. We pride ourselves on net promoter score and answering the calls. We need to continue to do that. That's a big differentiator for Enphase.
Stem
Stem is a high-risk moonshot stock. The reason that Stem is a moonshot is because it’s a small cap in a volatile industry and the stock has negative operating cash flow plus negative GAAP bottom line margins. In addition to this, one customer makes up 50% of revenue.
Due to the change in market environment, which is primarily caused by the Fed raising rates, companies that operate at a loss are more volatile than they were previously.
The negative operating cash flow has certainly improved — most especially in the recent quarter with a margin of (10%). This is an improvement from (62%) to (69%) in the previous three quarters albeit still negative in a cash sensitive macro environment. The GAAP operating margin has been lumpy and is currently at (45%) which is an improvement from (85%) in the previous quarter.
In Q3 of 2021, there was a revaluation of SPAC warrants which caused a non-cash adjustment in the net income, hence we are not looking at the year ago comps.
The gross margin is causing the weaker bottom line with a 12% GAAP Gross Margin and a 17% adjusted GM in the most recent quarter. This is an improvement from 9% GAAP Gross Margin in the previous quarter and up from 0% GM in the year ago quarter. Notably, in Q4 of 2021, Stem had a negative (3%) gross margin which further highlights the thin GM this company operates from.
As outlined below in regard to forward key metrics, the hope/expectation is that software sales will drive a higher GM than the company is currently seeing: “And so I think that over time you're going to see more and more software revenue rolling into the P&L and so we would expect that software, really services line item to grow quite significantly over the coming years.”
In the investor’s presentation, it’s noted that Stem has a GM of 80% for software and a GM of 10% for front of the meter hardware to 20% to 40% for back of the meter software. FTM makes up the majority of Stem’s business today (more below).
The company has cash and short-term investments of $335 million at the end of Q2 2022 compared to $352 million at the end of the Q1 2022. The company has a debt of $449 million at the end of Q2 2022.
The revenue growth for Stem is exceptional, however, and clearly the company is doing something important on a product level as it’s been posting triple digit revenue growth for many quarters and this doesn’t appear to be slowing down anytime soon. Here’s a snapshot of Stem’s recent revenue growth and two quarters of forward estimates.
There are some positive key metrics such as bookings of $226 million, for 402% growth. The company raised guidance to $775 million to $900 million, which is up from $650 million to $750 million.
The company reports on contracted annual recurring revenue or CARR. CARR was at $58 million and guidance was raised by $5 million to $65 million to $85 million. This represents the software portion contribution from the Athena product.
On the earnings call, management pointed toward the software helping to raise forward key metrics: “But, as far as the, say the philosophy of the business, I think that's where it gets super interesting is that the bookings growth really, determines what's going to happen longer term for us. And that's really, so we're kind of locking in and that's where the CAR metric comes in. And so you're starting to lock in long term long dated software contracts during that time period.”
The company also reported contracted backlog of $727 million and a pipeline of $5.6 billion, up 229%.
When you look at forward fiscal year estimates, there is a marked slowdown to 73% in FY2023 and 45% in FY2024. Here is what two of the eight covering analysts have said recently about Stem:
Northland analyst Abhishek Sinha initiated coverage of Stem with an Outperform rating and $24 price target. The U.S.-based complete battery storage solutions provider is "well positioned" with "a very dominant position" as the global push for lower emissions, vast improvements in battery technologies and a solid support by the passage of IRA bill should drive industry participants to make extensive use of energy storage systems, Sinha tells investors. Stem "has a significant head start against competition," as evident from the fact that it has over 50% repeat customers in Q3 bookings, the analyst added.
Morgan Stanley analyst Stephen Byrd raised the firm's price target on Stem to $20 from $13 and keeps an Equal Weight rating on the shares. The analyst increased growth rates for solar, wind, energy storage, and clean hydrogen, and raised price targets on many clean tech stocks, due to the clean energy support featured in the new Inflation Reduction Act legislation. The bill recently passed by Congress and signed by President Biden will accelerate the decarbonization of the U.S. economy, lead to significant increased domestic manufacturing, and provide the necessary support to jump-start decarbonization technologies that are on the cusp of being commercially viable, Byrd tells investors in a research note.
More on Product
Stem offers in-front of the meter storage (FTM) and behind-the-meter storage (BTM). FTM relies on the grid whereas BTM is independent of the grid. Per the earnings call, 91% of Stem’s sales are coming from FTM at the moment.
Athena is Stem’s AI software, which is designed to lower energy costs, reduce carbon emissions, stabilize the grid, solve intermittency, and create storage networks. As cumulative installs grow, Athena becomes more intelligent through continuous learning, creating more value to new and existing customers.
Athena AI optimizes time-of-use and demand charges, resulting in 10% – 30% monthly electricity bill reductions. The product saves clients’ money and helps them meet their ESG targets without changing the way they operate. Stem’s SaaS contracts range from 10-20 years and contain recurring monthly payments that are driven by storage assets under management (AUM). The company’s customer list includes Amazon, Whole Foods, Facebook/Meta, UPS and Adobe.
In the 10-Q filing, the company discloses that in Q2, one customer “Customer D” made up 50% of their revenue.
The Athena software is leveraged at times when Stem does not supply the software. Per management: “One is the largest behind the meter portfolio down in Southern California was a replacement with Athena software on an existing platform. And we have talked about that in the past. That's not inclusive in this 10X obviously, but I would say the majority of what we're seeing are large front of the meter projects whereby the developer may be procuring their own hardware and utilizing Athena and all the attributes that we bring.”
As the analyst pointed out, this scenario is the ideal scenario as software can ramp much faster than hardware in a supply constrained environment: “Biju Perincheril: Got it. Now I was thinking, this is a sort of nice tailwind sort of adding to your hardware plus software business making that transition to the software, becoming a bigger part of the business, making that a faster transition.”
Stem recently acquired AlsoEnergy, a company that offers an application called PowerTrack. The app allows for remote troubleshooting, identification of hardware faults, access to site documentation and customized dashboards. Per the earnings call, AlsoEnergy ranks number one in its category for an app for standardizing clean energy portfolios on one interface and for lowering total cost of ownership. This was a software acquisition, which is good for Stem’s longer-term gross margin.
Valuation
Stem is the rare small cap that is outperforming the Nasdaq and the Russell 2000. Some of this comes from the outperformance of the solar industry, yet it certainly challenges the narrative overall as Stem has weak margins.
Due to the company’s weak margins, we cannot value the stock based on the bottom line. However, renewable energy certainly has a plethora of higher risk stocks to comp the top line valuation. Plug Power has negative gross margins on average of (25%). Chargepoint has a worse operating margin than Stem at (84%) to (110%) in the most recent two quarters. Blink takes the cake with a negative operating margin of (193%) and (153%) in the most recent quarter. Prior to this, the GAAP OM was (300%).
Despite these weak fundamentals across the board, Stem has the lowest top line valuation.
With that said, on an individual level, Stem is trading at its highest top line valuation for the year and the stock fails frequently around the 12 current P/S mark and the 6 forward P/S mark. Therefore, Stem is not a buy for our portfolio right now until the valuation comes down OR until there is a clear, undeniable breakout where the market is signaling its ready for a higher valuation for Stem and others. It’s likely the first scenario will happen.
Catalysts and Risks
IRA legislation which we covered in detail here is a catalyst for Stem’s customers. 90% of Stem’s revenue comes from the United States, which is key for the subsidies. Management pointed specifically to the provision for retrofitting storage as less than 10% of solar AuM currently has storage attached.
Stem has stated they have fully contracted their 2022 supply and are current contracting supply for 2023 and 2024. This is what was discussed on the call regarding IRA and a potential increase in sales:
Mohit Manrai
Got you, and then probably just on the previous question here, from Brian on just for next year demand over here if we get like an IRA or not, if when we get the IRA approved, do we have enough supply for batteries to support that kind of demand here?
John Carrington
I'd say that we have to understand exactly the details around this as far as what the demand looks like. If you, as I said, if you look at some of the third party estimates, it's ranging from 20% to 300%. So we're have to — we'll have to unpack that.
Note: Management is referring to a 20% to 300% increase in the addressable market for the storage market, per industry analysts.
In December of 2021, the Uyghur Forced Labor Prevention Act was signed to prevent goods from being imported if those goods are developed through forced Uyghur labor. The effective date was June 2022. Stem noted that some of its customers could be impacted from this new law. “On the solar side, the AD/CVD and UFLPA issues could impact near-term panel deliveries for customers. And as I stated before, we have seen an impact on utility scale solar projects. The UFLPA process is presenting some uncertainty for developers, specifically more paperwork and compliance requirements are slowing logistics and delivery times.”
Brief Note on First Solar:
By Royston Roche
First Solar is a leading provider of photovoltaic (PV) energy solutions. It is one of the major beneficiaries of the Inflation Reduction Act of 2022 in the form of solar manufacturing tax credits.
The company also recently announced its plan to invest $1.2 billion to expand its solar module manufacturing in the U.S. It includes a $1 billion investment for a new manufacturing facility in the Southeast U.S. and $185 million for the upgradation of the existing Ohio facility.
The company’s revenue in the Q2 2022 fell by 1.3% YoY to $620.96 million. It beat the analysts' revenue estimates by 2.4%. Analysts expect revenue to grow 27% YoY to $738.51 million in Q3 and to decline 3.9% YoY to $872.21 million in Q4. For the full-year, analysts expect revenue to decline 11% YoY to $2.61 billion. Management guidance for the full year revenue is $2.68 billion at the mid-point of the guidance, representing a YoY decline of 8.5%.
The operating income in Q2 2022 was $144.83 million with an operating margin of 23% compared to an operating income of $110.38 million with an operating margin of 18% in Q2 2021 and an operating margin of -16% in Q1 2022.
The operating income primarily benefitted from increased module sales, gain from the sale of the Japan project development platform of $245 million, and partially offset from the impairment of legacy systems business asset in Chile of $58 million.
The company has a record backlog of 44.3 gigawatts. Mark Widmar, CEO of the company, said in the recent earnings call, “The 10.4 gigawatts of new bookings since our prior earnings call in April are mostly for deliveries in 2024 to 2026 time frame and have a base ASP, excluding adjustors of $0.301. These new deals bring our total year-to-date bookings to 27.1 gigawatts. From an ASP perspective, we are encouraged by the pricing trajectory of our bookings as we continue to transact for deliveries as far out as 2026.”
Goldman Sachs is among the notable recent stock upgrades. Analyst Brian Lee upgraded First Solar to Buy from Sell with a price target of $172, up from $60, as part of a broader research note on Solar names. The analyst states that the company is best-levered in his coverage to the tailwinds of the Inflation Reduction Act as the most immediate beneficiary of manufacturing credits as well as benefits from demand tailwinds given its above-80% exposure to the U.S. Lee also states that he has a more constructive outlook on First Solar's module gross margin recovery.
The company benefits from the Inflation Reduction Act and also from the strong demand for alternative energy. However, we will not be buying the stock since the company’s revenue growth lacks consistency. This could change with the IRA and we will monitor this as we go along.
This article was originally published on Forbes on Sep 9, 2022,02:02pm EDTForbes on Sep 9, 2022,02:02pm EDT
Solar energy stocks have outperformed the S&P 500 Index YTD with the most noticeable divergence June-August. The S&P 500 index is down 17% YTD and Nasdaq-100 index is down 26%, yet solar stocks are leading the tech industry as Enphase Energy is up 72%, Maxeon Solar Technologies is up 62%, and First Solar is up 56% YTD.
Source: YCHARTS
Similarly, we can see in the below chart that Invesco Solar ETF (TAN) is up 13% YTD and iShares Global Clean Energy ETF (ICLN) is up 7% YTD, and have outperformed other popular ETFs by a wide margin, particularly the Innovator IBD 50 ETF (FFTY) is down (39%), and Cloud Computing ETF (CLOU) is down (36%) YTD.
Source: YCHARTS
Solar Stocks Have Two Important Catalysts
There are two additional catalysts that may help to support the performance of solar stocks this year. The first is the Inflation Reduction Act which is expected to allocate $369 billion to energy security and climate change. Jon Hale, Global Head of Sustainability Research at Morningstar, said that the clean energy sector ETFs had a net outflow of $223 million two weeks before the July 27th announcement and the two-week subsequent, it had net inflows of $434 million.
The second catalyst is the energy crisis in Europe. The price of natural gas is rising, which will become a tailwind for alternative forms of energy. In some cases, the cost for base load energy prices in France, Spain, Italy and Germany are quadrupling or worse year-over-year with one expert saying it’s “like paying $500 for a barrel of oil.” We look at this in detail below.
Sign up for I/O Fund's free newsletter with gains of up to 403% – Click hereSign up for I/O Fund's free newsletter with gains of up to 403% – Click hereClick here
The Inflation Reduction Act of 2022
The Inflation Reduction Act of 2022 aims to reduce the budget deficit, invest in domestic energy production and manufacturing, lower healthcare costs, and reduce carbon emissions. Our primary aim is to keep an eye on the clean energy industry as IRA unfolds.
According to the estimates, the Act is expected to raise $737 billion from increased corporate taxes, prescription drug reform and through IRS tax enforcement. This will be primarily allocated to energy security and climate change ($369 billion), affordable care act ($64 billion) for a total deficit reduction of $300 billion. The bill which was passed in both the Senate and the House of Representatives, was finally signed by President Joe Biden on August 16th.
The revenue will be raised primarily from $265 billion by allowing Medicare and others to negotiate drug prices with drug companies, $222 billion from the new 15% corporate minimum tax for companies that earn more than $1 billion a year in profits, $124 billion from the stricter IRS tax enforcement, and $74 billion from the 1% stock buyback fee.
The highlight of the bill is investments of $369 billion in energy security and climate change with the goal of reducing carbon emissions by 40% by 2030. It also aims to expand tax credits for the purchase of Electric Vehicles. According to Morningstar analyst Brett Castelli, investors need to focus on three key takeaways:
“First, the act contains a 10-year extension of solar and wind tax credits. These credits had been scheduled to phase out over the next few years and the 10-year provision provides a significant amount of time for clean energy firms to build and benefit from new capacity.10-year extension of solar and wind tax credits. These credits had been scheduled to phase out over the next few years and the 10-year provision provides a significant amount of time for clean energy firms to build and benefit from new capacity.
Second, incentives have been included to support new technology that had not previously been eligible for tax credits. The two areas that we think will see the biggest benefits are hydrogen and energy storage.hydrogen and energy storage.
Third, the act provides incentives for the domestic manufacturing of solar panels and equipment which had largely been imported previously. The provisions in this law significantly increase the incentive to manufacture solar panels and inverters domestically.”domestic manufacturing of solar panels and equipment which had largely been imported previously. The provisions in this law significantly increase the incentive to manufacture solar panels and inverters domestically.”
As stated, electric vehicles are a beneficiary. The previous federal tax credits which were available to Electric Car buyers is going to change with The Inflation Reduction Act of 2022. Companies like Tesla, and General Motors which lost the $7,500 consumer income tax credit when they sold more than 200,000 electric cars, will once again be eligible since the cap of 200,000 EV sales is now removed.
Notably, there is a maximum retail price cap of $55,000 for cars and $80,000 for vans & trucks. There are also other income conditions for the buyers and critical mineral & battery component requirements. President Joe Biden said, “It also gives consumers a tax credit to buy any electric vehicle or fuel cell vehicle, new or used and a tax credit for up to $7,500, if those vehicles were made in America.”
The solar industry will benefit since Inflation Reduction Act includes the extension of Production Tax Credits (PTCs) and Investment Tax Credits (ITCs) for the construction of wind and solar projects beginning before January 1, 2025. It means a three-year extension for PTCs and a one-year extension for ITCs.
It also extends the 30% federal tax credits for installing solar panels on rooftops by another 10 years, from 2022 to 2032. Solar installations are eligible for 26% tax credit for installations in 2020 and 2021. It now extends till 2032 for 30% tax credits, and in 2033 the tax credit will be reduced to 26% and 22% in 2034. There will be no tax credit after this period unless Congress renews it. Home battery systems that store energy generated by solar systems for later use will also be eligible for a 30% tax credit.
The Inflation Reduction Act also has created a new Production Tax Credit for the domestic production and sale of solar and wind components. The tax credit is expected to phase out at a rate of 25% for components sold after 31 December 2029, and no credits will be available after the end of 2032.
European Energy Crisis
The below chart looks at the futures market for the cost for base load energy prices in France one year out. Base load refers to the minimum energy needs to support a grid, and does not include peak energy.
Source: I/O FUND
On August 26th, 2022 the price was $1130/MWh. Twenty Four days earlier the cost was €507/MWh. And one year ago, the same forward price was €78/MWh. Keep in mind, this is the expected cost to power the base load of the French energy grid one year out from now.
This is not just a French problem. The same contract looking at the 1-year percentage increase in the expected cost to power a country’s base load is as follows: Italy +660%, Spain +400%, German/Austria +1200%. Alex Munton, an expert on global gas markets at Rapidan Energy Group, said, “European natural gas is so expensive it’s like paying $500 for a barrel of oil.”
To make matters worse, the French government just bailed out Electricité de France S.A. (EDF), which is the largest supplier nuclear energy to Europe, as well as large supplier of natural gas in France, Belgium, Italy and the UK through its subsidiaries. The €10 billion bailout has made the company 100% nationalized, as the French government scrambles to address the EU energy crisis.
EDF is one of a string of EU energy companies applying for emergency loans as the soaring price of natural gas affects EU supply. Uniper SE, one of Germany’s largest utility companies, was just given a new bailout that allows the German government to take a 30% stake in the company. The on-going losses are unsustainable as rapidly rising energy costs drain needed liquidity to fund daily operations.
Sign up for I/O Fund's free newsletter with gains of up to 403% – Click hereSign up for I/O Fund's free newsletter with gains of up to 403% – Click hereClick here
Uniper was Europe’s largest supplier of Russian gas. They claimed the volume it has received from Russian gas this year has fallen by 80% since June, which forced them to find alternative sources of energy at elevated prices in order to meet demand.
France’s solution to the crisis was to instill price caps on energy prices to its citizens. A politically popular policy with the consequence we are seeing with EDF. The energy suppliers are being forced to buy high and sell low due to these price caps. As a result, France has had to hand over roughly €40 Billion in 2022 to keep EDF afloat this year. Ever since, energy prices have doubled as future prices are expected to increase by about 5 times into 2023. If France maintains price caps, they will be looking at an additional €200 billion to keep EDF afloat through the winter with the current price caps.
Regardless, with energy prices increasing with no end in sight, EU officials are calling for major price caps across the board. The EU is forced to choose between on-going bailouts/nationalization of energy suppliers or face the realization that many citizens will be unable to afford energy needs for basic cooking and heating as we enter the Fall/Winter months.
How can a European utility, which has been historically safe, run into insolvency when energy demand has far exceeded supply? It goes back to standoff between Russia and the EU. Russia supplied 40% of Europe’s natural gas in 2020. In 2022, the EU has taken a stance against Russian imports due to the invasion of Ukraine.
As of July 2022, EU has seen a 60% drop in Russia natural gas deliveries, as we move into Fall/Winter. Furthermore, the Nord Stream 1 pipeline, which accounts for 1/3 of all EU’s natural gas imports from Russia, has seen around 1/5 of normal inflows this year. As a result, basic energy price throughout the EU are approaching prices that most citizens simply cannot pay.
Much like the US saw a contagion in banking in 2008, which forced a quasi-nationalization of the industry, it appears that the EU is heading in the same direction with its energy companies. With the multi-year move to shift towards a green energy grid, coupled with the sudden loss of Russian energy supply, the EU appears to have no viable option to avoid blackouts into the coming fall/winter months.
Conclusion:
The NDX is down (26%) YTD and this is one of four years in the last two decades the broader tech index has seen double digit losses. However, there are pockets of growth even in this market and solar is the leader in this regard.
On top of this sector’s excellent performance over the past few months, we foresee its leadership position continuing due to these two catalysts which will create a new trajectory in global demand for renewable sources of energy. We publish premium deep dive reports on individual stocks for our premium members with a focus on Solar this upcoming week.
Knox Ridley, Portfolio Manager at I/O Fund, and Royston Roche, Equity Analyst at I/O Fund contributed to this article.
Please note: The I/O Fund conducts research and draws conclusions for the Fund’s positions. We then share that information with our readers. This is not a guarantee of a stock’s performance. Please consult your personal financial advisor before buying any stock in the companies mentioned in this analysis.
SentinelOne had an excellent earnings report. There are a few things to unpack, yet the 10,000-foot view is that the company has continually proven its capable of growth during a time of uncertainty for other cloud peers.
Key metrics accelerated including customers with ARR over $100,000 and dollar-based retention rate. The most notable positive surprise was the company’s dollar-based net retention rate of 137%. This is a record for the company and marks an acceleration from 131% last quarter and from 125% in the year ago quarter.
You can reference our product overview on SentinelOne from a year ago here on Forbes and updated in January here on the premium site.
Financials:
SentinelOne reported revenue growth of 124% for $102.5 million compared to a consensus of 109% growth based on revenue of $95.7 million. The company raised Q3 guidance to 98% growth for $111 million compared to a consensus of 93% growth based on $108 million consensus. The full year guide was also raised to $416 million, up from $406.4 million previously. This represents growth of 103% for FY2023 ending in January, up from guidance of 98% growth for the full year.
The Attivo acquisition adds ARR of $35 million to the numbers stated above and SentinelOne is not breaking out the numbers any further now or in the future. Management stated the growth outlined above does not come from Attivo, rather came from growth in the organic business. They do feel identity will grow in the future but did not in the immediate quarter.
Remaining performance obligations for SentinelOne, which includes deferred revenue and other non-cancelable contract revenue was $444.7 million with 84% recognized as revenue over the next 24 months.
The margins are where the rubber meets the road with SentinelOne. The GAAP gross margin of 65% is improving from the GAAP gross margin of 59% in the year ago quarter. The adjusted gross margin of 72% also shows significant improvement from the 62% adjusted gross margin a year ago.
We’ve previously covered in detail how the company operating expenses in sales and marketing, R&D and also stock-based compensation contribute to a weak operating margin. This has resulted in an GAAP operating margin of (106%) and adjusted operating margin of (57%). This is an improvement from a GAAP operating margin of (147%) and an adjusted operating margin of (98%) in the year ago quarter. This is also an improvement from the previous quarter at (115%) GAAP operating margin.
This was a beat for Q2 as operating margin was previously guided to be (75%) to (73%). We noted this would make meeting the FY2023 guide a bit tough so it’s good to see this in line with the FY2023 guide on operating margin.
Notably, the company has doubled its spend in sales and marketing, research and development and G&A from the year ago quarter. Stock based compensation was 40% of revenue in Q1 at $31.6 million and is still roughly 40% of revenue in Q2 at $41 million in the current quarter.
However, the management team has delivered on its promise to greatly improve its margins. At the onset of the year, it was stated the company would reach Non-GAAP operating margin in FY2023 of (60%) to (55%). The company is now stating: “we're improving our full year range to negative 58% to 55%, a one-point improvement at the midpoint from our prior range.”
Management is guiding for the same margins next quarter in Q3 which is 71% adjusted GM and (57%) OM.
The company has stated its goal is to become cash flow positive by 2025. The company’s free cash flow was ($66) million. If we assume the company spends $250 million in cash per year with $1.2 billion in cash, cash equivalents and short-term investments, there shouldn’t be a capital raise unless there are more unforeseen acquisitions. The Attivo acquisition cost $351.5 million in cash and 6.032 million shares of Class A stock for an aggregate value of $185.9 million and 379K assumed options to purchase shares of Class A stock.
The company’s adjusted net loss per share is ($0.20) compared to ($0.38) for the same period last year. It beat the analysts’ consensus estimates by $0.05.
The company’s valuation is 17 forward P/S. Bottom line valuations don’t work well in cloud due to how few companies are profitable. With that said, SentinelOne’s valuation is in line with Crowdstrike and is between cybersecurity companies such as Cloudflare and Zscaler.
Key Metrics:
The company provided ARR of $438 million for growth of 122%. It was unclear if Attivo’s $35 million was included in the ARR provided. If it was, then organic ARR for the quarter was $403 million for growth of 103%. I’m assuming it’s the 103% as total customer count combined both organic and acquired. This marks a deceleration from 110% in the previous quarter.
Regardless of the ARR growth, the customer segment with ARR above $100K grew 117% to 755 total customers, up from 348 in Q2 of last year, and this is unlikely to have been affected by Attivo. Total customer count was 8,600 with 750 organic adds and 350 acquired from Attivo, up from 5,400 in Q2 of last year. According to the SEC Filing, no customer accounts for more than 4% of revenue and 33% of revenue is from outside the United States.
“Our financials now incorporate the acquisition of Attivo, which performed in line with our expectations and is on track for our full year ARR target of $45 million or more. We do not intend to break out Attivo financials going forward as it becomes part of our broader platform offering as our identity suite.”
Note: Attivo’s current ARR is $35 million with a target of $45 million for the full year.
Dollar-based net retention rate was 137%, up from 131% in the previous quarter and up from 125% in the year ago quarter. This is record DBNRR for the company. The company noted it fits the Rule of 60 and has plans to continue fitting the Rule of 40. SentinelOne’s Magic Number is above 1.3.
According to management, the fastest growing module is Singularity Cloud, followed by data retention and Ranger. The company mentions that even in cases where companies are using a competing security company on endpoint, they will use SentinelOne for cloud run time protection.
When asked if SentinelOne has had success in replacing the endpoint provider by leveraging it’s best-of-breed cloud protection, the company responded it provides a back door yet the bigger opportunity is in protecting the cloud architectures. “But to be honest, I mean, when we look at how these cloud opportunities, especially with the cloud-native companies, they're probably 4x, 5x, sometimes 10x the size of the endpoint footprint and the endpoint opportunity.”
We covered from the Q4 earnings call that management expects cloud to be equal or greater than the endpoint opportunity. We also covered that “Cloud is a Growth Lever” in our full length premium report.
The company has recently expanded its platform to include data ingestion on the backend that is now seamless with the user interface on the front end. When we discussed the differences between SentinelOne and competitors, we pointed toward the company’s data-forward approach. The company reiterated this in the recent earnings call, stating the platform runs petabytes of data everyday while “competitors can handle only a fraction” of this scale. The company also points towards data retention, which helps to reduce storage costs while maintaining critical information.
Data retention is important because it drives down costs. Per management: “So our ability to process more data for customers, our ability to retain it for longer and really be a cost saver for customers. Obviously, in this macro environment, that's fixed volumes.”
From the Q4 call, we discussed that by going with a different EDR vendor, customers have to then figure out how they are going to retain data on the backend of a different platform, which can be costly.
In addition to the data retention, the new platform product is the DataSet, or the ingestion of data from the backend that is now seamless with the front end.
Here is what the company stated about this new platform development:
“We completed the migration of our back-end DataSet, which was a meaningful undertaking that we completed in just over a year [..] It positions us extremely well in the future of XDR, a unified, scalable and efficient data back end, gives us a significant competitive advantage. And evident by our Q2 gross margin, it's already supporting our path towards our long-term gross margin targets.”
We’ve covered the Ranger product in the past, which is the product that helps to identify unsecured endpoints through a fingerprinting engine that runs an inventory of IP-enabled devices. Ranger and Ranger Pro detects and notifies IT teams of unsecured endpoints.
Overview of Earnings Call:
We’ve referenced how management teams in cloud are hesitant to pull forward the Q2 beats to an equal or greater full year fiscal guide. Rather than these management teams becoming bold macro economists who feel they can predict with certainty Q3 and Q4, they are instead playing it safe.
SentinelOne beat Q2 by $6.8 million and guided for a Q3 beat of $3 million. The company carried this entirely through to the full year guide but did not go any further to raise Q4 at this time. This is marginally better its cloud peers who did not pull the Q2 beat forward, in some cases.
Additionally, this is what management said about the current macro environment:
Demand is strong, and we remain extremely well positioned. At the same time, enterprises across all sectors of the economy are being impacted in different ways by evolving macro conditions. Like other software companies, we've seen some signs of cost consciousness and prudence around IT budgets. This has resulted in marginally longer sales cycle and more budgetary approvals.”
The company was asked again in the call about macro and any impact it may have had on visibility around demand, and the CEO stated: “We still feel pretty good about demand. I think what you see reflected in our guidance is the level that we feel we need to be conservative and prudent. And all in all, again, things remain incredibly strong.”
The analysts on the call believe that part of SentinelOne’s success in the face of global budgetary slowdowns partly rests on the company’s channel partner strategy, which includes resellers and distributors, managed service providers (MSPs) and managed security service providers (MSSPs).
Whether customers are direct or through the channel partner network, customers adopt the Complete product first and then upgrade across any combination of 15 modules. The modules upgrade is helping to drive a higher DBNRR as customers stay to spend more on the platform with the CEO stating 30% of revenue comes from the modules. They feel this is where the expansion opportunity remains.
When asked about the high net retention rate, management responded with the following:
“I think one of the very most exciting things about our business is the incredible demand that we're seeing from MSPs, MSSPs and – investments partners, many of which have become MDRs or managed detect and response providers themselves. And I think there's a couple of fascinating elements to this part of the business. One, it really lets us, in a very efficient way, cover a tremendous part of the market. Two, it absolutely fits amazingly well in today's macro environment where folks are looking to efficiently protect their networks, efficiently protect their data and their users and expand their security prowess without having to make a lot of capital investments. And managed services do exactly that. Third is incredible velocity in terms of deal cycles.”
Later, the CFO emphasized the channel partners by saying:
“As we've gone through an evolution of MDR and other more sophisticated security service providers, we're starting to see small, medium and large enterprises go with a managed service. And so, we've seen from an overall global trend perspective, I think the scrutiny around spend has lent itself to an upsell in that type of business.”
Another reason SentinelOne has performed well in the current macro backdrop is because it’s best-of-breed across many attack surfaces, including cloud and now identity with Attivo. The company also allows now data to be ingested for a stronger, singular platform and drives down costs with data retention.
Conclusion:
I agree that SentinelOne is best-of-breed and is combining modules to accelerate DBNRR – this is one of the best indicators we have in tech as to a product’s strength. It also helps to illustrate that growth is not at any cost as this typically includes a high churn rate and lower retention if S&M is bringing in lower quality leads. Since its IPO, SentinelOne has illustrated its competitive prowess, whether it’s through product development and R&D or an impressive acceleration in key metrics. For example, ARR accelerated in January of 2021 and continued to accelerate for many quarters. We are seeing this again with DBNRR.
SentinelOne’s stock price hinges on the company keeping its word to improve its margins. There are ample catalysts to sustain the company’s growth, primarily Singularity Cloud and data retention. Both emphasize SentinelOne’s strength in automation which now includes data ingestion on the backend.
Investors will want to see a clearer path toward profitability next year as SentinelOne will need to assuage any concerns it’s a “growth at any cost” company. Additionally, acquisitions will need to remain limited until the company is free cash flow positive as the company has enough cash until 2025 barring any new acquisitions. Analyst consensus has SentinelOne with positive EPS in January 2025 in a predictable path; if SentinelOne can deliver on this then I believe it will be one of the better performing cybersecurity stocks on the market.
For most of August, we have been providing free webinars in prior blog posts outlining an “imminent pullback.” You can access these here, and here. In this article, we will discuss key levels that must hold in order to maintain a long-term bullish bias. We also discuss why a direct drop to new lows may not play out, even if the bear market resumes. We then discuss the supporting markets that need to work in unison with equities before we can see a meaningful uptrend resume.
There is a popular saying on Wall Street – equity markets are discounting machines. In other words, equities are looking 6-9 months into the future to create prices today. Because of this fact, we regularly see market scenarios that sometimes do not make sense.
For example, in April/May of 2020, the high-frequency data was literally off the chart. We were seeing record unemployment, as well as PMIs falling off a cliff. This was coupled with companies in the service sector reporting losses that were nearly unprecedented. Yet, the market powered higher as this data continued to come in week after week. Ultimately, the market was right, as the US economy saw a relative recovery, and avoided the worst-case scenario.
We saw this phenomenon again last month. The June CPI number hit another 40-year high, beating consensus expectations. This was followed up by the Producer Price Index beating estimates to the upside, which implies rising inflation into the future. We then saw bank earnings come in mixed to bad, kicking off the feared earnings contractions brought on by over a year of real earnings seeing MoM declines due to wages unable to keep up with inflation. On the back of this bad news, the market failed to make a new low, and instead rallied nearly 700 points into late August.
When we see the market rally on bad news, what the discounting machine is telling us, is that all the bad news that is currently known, and can be modeled, is now priced in. We tend to see markets bottom in a place of despair, with most market participants certain we are going lower, while markets tend to top into euphoria, where most market participants are certain we are only going higher.
How to Model Investor Sentiment
The inability to model investor sentiment has been an ongoing issue with economic models for many years. It was one of the primary issues in 2008 when most models failed to see such a dramatic drop. Sidney Winter, Wharton School Professor, stated, “As computers have grown more powerful, academics have come to rely on mathematical models to figure how various economic forces will interact. But many of those models simply dispense with certain variables that stand in the way of clear conclusions. Commonly missing are hard-to-measure factors like human psychology and people’s expectations about the future.”
The only way to truly model investor sentiment is through technical analysis. Market patterns show up time and time again throughout history and across all assets being traded between humans. The art of properly interpreting these patterns can help investors get ahead of big moves.
The market pattern we are currently trying to interpret in real-time is a corrective pattern, which will unfold in 3 legs: A wave down, B wave up, C wave down. The question for the remainder of 2022 is simple – is the current 3 legs of the bear market that bottomed on June 16th the entirety of the correction, or is it just the 1st leg of a much larger correction?
We should know the answer to this question within the coming month. Assuming that the June low was the low, the current uptrend would be developing a new large-degree 5-wave pattern off the low.
As of now, we only have 4-waves. So, in order for this to be true, we need to see the market bottom soon, and then push back above the 4330 SPX level. This would give us a clean 5-wave pattern off the low, which would be wave 1 of the larger 5-wave uptrend developing. Here is a visual to show what this would look like.
If we instead break below 3920-3900, then the odds favor a continuation of the bear market. However, I would not be expecting a straight drop, if this does happen. Assuming that we are currently in a large degree bear market bounce (B wave), there is one major clue that we do have to help us determine where this bear market will take us. The move from the ATH to the June low occurred in a rather straight-forward 3 wave fashion.
Note how the make-up of this larger 3 wave move was 3 down, 3 up, and then a 5 wave move into the June 16 low. If this is only the first leg of a larger bear market, it appears to be in the form of what is called a Flat corrective pattern. If this is true, then there are only 3 Flat Corrective Patterns to consider for an outcome.
Note how in each Flat corrective pattern, the B wave (up) retraces a large portion of the A wave down. If we are in an Expanded Flat, the B wave makes a new high before the final leg drops to new lows. In my experience with Flat corrections, we tend to see the B wave retrace at least to the 61.8% retrace level of the entire A wave, and the B wave tends to be nearly as long as the A wave in time.
Sign up for I/O Fund's free newsletter with gains of up to 403% – Click hereSign up for I/O Fund's free newsletter with gains of up to 403% – Click hereClick here
As of today, we have come close to this target in price, yet we have fallen short in time. Playing the probabilities, it is highly irregular to see a Flat corrective pattern’s B wave be so brief relative the length of the A wave down. Anything is possible, which is why we plan to stick with the probabilities until critical supports break. If this is accurate, we are likely more than halfway through the bear market bounce. Once we bottom in the current selloff, as long as we hold the 3720 level, we should then see a 5 wave rally to a new local high into Fall.
Inter Market Analysis
Our economic grid analysis has moved into what we call the Big Risk-Off grid for the first time since 2020. This means that the rate of inflation is slowing along with the rate of economic growth.
Historically, this grid tends to accompany the C wave down in a bear market. However, in 2022, the market exhibited a sell-now-and-ask-questions-later mentality, as we saw the S&P 500 decline by 24% and the NASDAQ-100 decline 34% over a 5.5 month period. These are rare moves, and one has to wonder if the worst is priced in – including the global slow-down in growth? I do believe it’s cavalier to assume that at this point, and prefer to let the broad market prove it to me over the coming month. We will remain cautious until then, and respect the Big Risk-Off grid that we are now in.
If we have, in fact, found a meaningful low, we would not only need to see the S&P 500 give us that 5th wave up, but we would also need to see rates, the USD and oil move down or sideways. Bull markets do not happen in vacuums and tend to be supported by various markets firing in unison. As of today, this confluence of inter-market dynamics is not supporting a direct uptrend in equities.
Bonds
We have talked for several months about how the bond market is not buying what the equity market was rallying on. If we did just to see peak inflation in the U.S., we would then expect the bond market to start trading on the global slow-down in economic data. This would cause a bid under bonds, as the bond market scrambles to lock in high yields as the economy moves towards a deflationary event. However, we are seeing the opposite.
This suggests that the bond market is not yet convinced that inflation is behind us. Until TLT moves past $117.50, the odds remain that rates have not peaked, yet. If rates continue higher, expect volatility to follow, as companies must reprise their future cash flows/earnings due to rising borrowing costs.
The U.S. Dollar
The dollar (USD) has also been a catalyst for volatility in 2022. The USD has seen a sharp uptrend, drying-up international sales and thus affecting revenues. With peak inflation behind us, a FED pivot would likely start getting priced into the USD along with stocks.
Furthermore, The EU just posted the highest CPI and PPI readings sin e the inception of the Euro. Furthermore, Germany, who accounts for nearly 30% of the Eurozone economic output, just reported that consumer costs rose 8.8% vs. 8.5% a month prior. This is the largest increase since 1973, and far exceeds European wage growth of 3.8%. Therefore, the EU has accelerating inflation that far exceeds wages.
Sign up for I/O Fund's free newsletter with gains of up to 403% – Click hereSign up for I/O Fund's free newsletter with gains of up to 403% – Click hereClick here
The reason this matters is because the U.S. has potentially seen peak inflation, with data surprising to the downside.
The FED is far ahead of the ECB in terms of rate hikes, which means the EURO is likely to head higher, as the USD starts topping. As the FED reverses course to flight deflation, a loose dollar would be implied, causing a peak in the dollar. We are simply not seeing that yet. This implies that global fears are still present, as investor rush to the safety of the USD.
The Dollar Index, DXY, is hitting a confluence of big resistance on weakening momentum. If we see a strong break above the 45-degree line (1×1 in red) it could spell trouble for equities. As of now, it is holding the resistance, which we now need to see a follow-through to the downside to relieve pressure from equities.
Energy
The Oil market is also looking ready to push to new highs. The global economy is slowing down, making the need for energy less than it was a year ago. However, the crude oil charts look primed to make a new high.
What would cause a push to new highs is yet to be known. However, in the face of slowing growth, it would likely be a catalyst the market is not pricing in yet. Many times, markets provide warnings that a new risk is on the horizon, and if we are to see a new leg lower, it would likely be a catalyst that is not known or being taken seriously.
Potential Catalysts
Next week, we will discuss the most concerning catalyst for the continuation of a bear market in our free newsletter. Here is a secondary catalyst we are tracking:
China/Taiwan:
Taiwan is an island off of the Chinese mainland that was governed independently from China since 1949. China views the island as a renegade province and has repeatedly threatened to force submission to Chinese law and political views. In 2016, the election of president Tsai Ing-wen, was a statement that the people wanted a further divide between Taiwan and China. Tsai instilled a movement of separatism and nationalism, which goes against the vision of the Peoples’ Republic of China, which continues to build today.
These tensions have continued to escalate into 2022 where they have reached a boiling point. We have seen numerous threats from China, coupled with Taiwanese leaks that seem to be preparing their citizens for war. Whether this will escalate or not is yet to be seen.
However, like Russia’s military drills in the region grew just before an invasion, China’s military drills continue to grow in the Taiwanese region as well. It also does not help that Russia and China have engaged in joint military drills recently, as the US announced that it has sent two warships to the Taiwan Straight.
If we do see an invasion, expect crude oil to move to new highs. This will put pressure on global oil markets, which will likely push inflation concerns higher, causing bonds to continue their decline as the USD is bought as a flight to safety.
Conclusion
The biggest tell will come from the US equity market over the next month. If we can get that 5th wave up, the US market is leaning towards the low being in, implying that the catalyst for a C wave lower is unlikely. On the other hand, if we break below 3975, the equity market is telling us that something is not right. The great discounting machine will be discounting something the rest of the market is simply not aware of until it is too late.
Please note: The I/O Fund conducts research and draws conclusions for the Fund’s positions. We then share that information with our readers. This is not a guarantee of a stock’s performance. Please consult your personal financial advisor before buying any stock in the companies mentioned in this analysis.
There are a few reasons MongoDB saw a severe reaction its earnings report. The first is that the cash flow is much lower than it’s been in recent quarters. We wrote in May that this is the top thing to watch across cloud stocks and we positioned our portfolio for those that were FCF positive.
Here is what I have for MongoDB’s FCF:
($22M): Q2FY22
($9M): Q3FY22
$16.9M: Q4FY22
8.4M: Q1FY23
($48.6M): Q2FY23*
In Q1, MongoDB was expected to report ($0.06) adjusted EPS and the company reported $0.20 EPS instead. This was a $0.30 beat. In Q2, MongoDB reported a beat of ($0.23) adjusted EPS versus ($0.28) adjusted EPS expected. However, Q3 and the full year guide missed on adjusted EPS consensus with Q3 at ($0.13) expected versus ($0.16) to ($0.19) EPS guided. For FY2023, consensus was at ($0.21) versus ($0.28) to ($0.35) EPS guided. I break down the reasons for the miss in the Financials section below.
Q1 was a “perfect 10” quarter. The company stood out as insulated to discretionary spending compared to its peer Snowflake who analysts questioned at length due to its rumored exposure to Coinbase and other heavyweight consumer-facing companies. Perhaps most importantly, in Q1, MongoDB posted adjusted profitability for the first time.
Another reason for the AH selloff is that in Q2, MongoDB and Snowflake switched seats. Analysts are now more concerned MongoDB has outsized exposure to macro conditions rather than Snowflake, as Q2 was a perfect quarter for Snowflake.
Current revenue growth would suggest there is robustness to MongoDB, yet this management team is mirroring more of Datadog’s approach, which is they are not raising full year guidance to match the Q2 revenue beat. If a company does this, it implies the other two quarters will be weaker than expected. MongoDB gave a solid raise to Q3, so that implies that Q4 will be weak despite being seasonally strong.
I also want to be a messenger and say that another reason we are seeing strong price activity is that analysts are concerned that enterprise spend will be the next shoe to drop. This concern was expressed across quite a few cloud companies’ earnings calls. The thinking is that enterprise spend will follow consumer spend, (eventually), yet is slower because budgets are cut more slowly and added back more slowly.
Any sign of weakness is being interpreted as this more serious concern. Whether it’s overblown or whether it’s being prudent is something every investor must decide for themselves as it requires a time machine to truly know when the macro environment will clear, and most importantly, the depth of the effects it will have on cloud.
Some cloud companies can show immediate effects and MongoDB, Snowflake, Confluent, etc, would be that group due to being the consumption model as usage can be increased/decreased fairly quickly whereas SaaS models would require subscription cycle to show these effects. This is not a company or developers electing to reduce usage on MongoDB, rather it’s a trickle down effect from lower usage within applications.
Here’s a quote as this was discussed many times:
“As we discussed last quarter, it's important to understand that the slower than historical consumption growth is a result of slower usage growth of our customers' underlying applications due to macro conditions.
Our customers spend on our platform is well aligned with the performance of their business. In the current environment, some businesses and consequently, their applications are growing more slowly.”
It’s important to note that slower usage from the underlying applications is distinguished from discretionary spending. However, for our purposes as investors, the result is similar, which is that even if MongoDB is a core product, it’s impacted by macro.
The company also stated that it’s a lower rate of workload expansion contributing to their cautious Q4 guide rather than a lower rate of new customers: “As you think about the business more holistically, new customers and new workloads are what really determine the long-term outcome and the long-term success […] As it relates to expansion of existing workloads, which is sort of the other piece of the equation, that's more relevant in the short term not as relevant in the long term. And so, that's where we've seen the slower growth that we've described. And so, we're continuing to take a long-term orientation”that's where we've seen the slower growth that we've described. And so, we're continuing to take a long-term orientation”
Financials:
MongoDB reported revenue of $304 million, which beat consensus of $282 million by 7.6%. In terms of percentage, this was a larger beat than Q1 at 6.9%. The company is guiding for Q3 revenue of $301.5 million at the midpoint compared to $294.5 million consensus. The two quarters combined translate to $29 million in additional revenue. However, the company is only raising full year guidance by $16 to $18 million as the previous guidance was $1.8 billion for FY2023 and is now $1.196 to $1.206 billion. This would imply Q4 being lower than anticipated by $10 million at $320 million instead of consensus of $330 million.
It seems like this market is splitting hairs but it’s what the overall Q4 miss represents, which is, will cloud see extended lumpiness from the recession.
The adjusted operating margin fell from 6% in Q1 to (4%) in Q2 during a time when the market is especially bottom line sensitive. This is the lowest adjusted operating margin over the past five quarters.
The company stated the increased opex is due to an increase in sales and marketing and R&D. Translation: tech companies spend for growth, it’s part of their DNA. Tech companies spend on growth if they think it will help them expand market share at critical point of adoption. The current market doesn’t like this but previous market conditions have not cared. (Tech companies have not changed and how they operate, the market has). This puts extreme pressure on a company — do you stop spending and risk growth and losing market share OR do you ignore the market and continue spending. It’s not good for MongoDB’s stock right now but spending to increase market share is almost always the right answer.
The GAAP operating loss also increased in the recent quarter. It came at ($114.8M) compared to an operating loss of ($72.5M) in the same quarter last year and ($75.9M) in the Q1 FY23. The operating margin was -38% in the recent quarter compared to -36% in Q2 FY22 and -27% in Q1 FY23.
Net income also saw a deceleration and the current market conditions do not take kindly to this. MongoDB adjusted net loss was ($15.6M) down from adjusted net loss of ($7.7M) in the year ago quarter. MongoDB had demonstrated a path to profitability recently and this has now been reversed.
The cash from this quarter (noted in the intro) was impacted by the conference MongoDB World, yet we aren’t getting much from management in terms of a turnaround on the bottom line as the year continues. For our purposes, MongoDB is no longer a positive FCF company and this is a marked change in the fundamental story. We felt very strongly that our cloud positions must be free cash flow positive this year.
The guide is adjusted operating loss in Q3 to be ($10M) to ($8M). The FY2023 guide is for adjusted operating loss to be ($13M) to ($8M). At the midpoint this is ($10.5M) which implies a weaker bottom line the rest of the year at ($9M) for Q3 and ($4M) for Q4.
The company’s stock-based compensation is high. In the recent quarter, it was $96.56 million (32% of revenue) and in the Q1 FY23, it was $83.57M (29% of revenue), which is one of the key metrics investors are tracking in the recent quarters.
Key Metrics including Atlas
Atlas decelerated from 82% growth last quarter to 73% growth this quarter. This was the larger decel we’ve seen in the previous four quarters, which have been range bound between 82% to 85% growth. Atlas customer growth was at 29% compared to 33% last quarter. However, the contrast is clearer when compared to the year ago quarter at 44% Atlas customer growth.
Management expects this trend for lower Atlas growth (compared to the previous four quarters) to continue.
“First, we expect the Atlas consumption trends we experienced in Q2 to continue for the remainder of the year. Second, in the second half of last year, as we called out at the time, we had exceptionally strong Atlas consumption growth leading to difficult Atlas year-over-year compares to the back half of the year. And third, we expect a sequential decline in Enterprise Advance in Q3 as the renewal base is sequentially lower. Looking into Q4, we expect a seasonal uptick in revenue from EA. But recall, we faced a very difficult year-over-year comparison given strong EA new business activity we saw last year.”
Customers over $100,000 were up 27%, this is down from 30% growth last quarter. Overall customers grew 27.5%, down from 31% growth last quarter. The net ARR expansion rate was “over 120%” which is the same information provided in previous quarters.
Comments on the Call:
The call centered around a few things. The first is how macro headwinds affect MongoDB’s business where management described puts and takes. There are actually tailwinds, according to management, as the migration away from legacy databases is now more prioritized:
“On your first question, I just want to remind everyone, we're not seeing any change in deal sizes or sales cycle times. I think your point about as customers face this macro headwind, is there an opportunity for them to essentially drive more efficiency in their business? And we're definitely seeing customers starting to do that. We're definitely seeing customers look at their legacy platforms and recognize how expensive and brittle those platforms are and are more motivated to move on to more modern platforms like MongoDB.We're definitely seeing customers look at their legacy platforms and recognize how expensive and brittle those platforms are and are more motivated to move on to more modern platforms like MongoDB.
Frankly, to help customers in that journey, that was a motivation for us to release the Relational Migrator product because this is not a new trend to help customers just reduce the cost of moving off relational to MongoDB. And I think you're going to see more and more customers take a hard look at their legacy infrastructure and think about modernizing potentially sooner than later.”that was a motivation for us to release the Relational Migrator product because this is not a new trend to help customers just reduce the cost of moving off relational to MongoDB. And I think you're going to see more and more customers take a hard look at their legacy infrastructure and think about modernizing potentially sooner than later.”
There was quite a bit of conversation around “digital native” companies. There are many large enterprises that are digitally native (Amazon, for example) and so I took the mid-market digital natives to mean startups, especially e-commerce, which are seeing slower usage and strapped for funding right now. It can also mean any other consumer-facing applications that are stagnant/not growing but e-commerce comes to mind.
“Moving on to the mid-market channel. For context, the customers in this channel tend to be traditional medium-sized businesses. This channel included — tend not to be traditional medium-sized businesses. This channel includes a disproportionate share of digital native, fast-growth companies that have built their businesses on MongoDB […] Our expectation that the mid-market slowdown we saw in Europe in Q1 would become global in Q2. This is what we experienced, but the slowdown was more significant than we had expected, specifically the digit layer subset of the mid-market experienced slower growth in their applications as a result of macroeconomic conditions, and therefore, their underlying consumption growth of MongoDB slowed as well.”
Of course, the softer operating income was drilled into and this is what was stated:
“Jason Ader: Guys, in thinking about the lower op income guide, are you basically saying that the mix of new customers versus existing customers is different than what you expected a quarter or two ago and basically new customers are more expensive to transact with? Is that the right way to think about the lower op income for the year guidance?
Michael Gordon: No, that's not how I think about it. I think about it as being — we are continuing to see good customer wins and strong receptivity in the market that underscores or translates into strong customer unit economics. And so, we are continuing to invest in building out sales. And as you think about what the implication is in terms of rolling through some of the slower cohort expansion of existing Atlas customers that we're seeing. And when you run the math through, that winds up having a slight impact to our full year op income guide.
So I wouldn't take it as any kind of judgment or try to do any math unless some sort of incremental value of workloads or slicing and dicing it that way, just simply us, saying, us looking at the market, having a long-term orientation, continuing to see strong new wins, no increases in customer churn, continuing to have the value proposition resonate and being sort of at the top of the customer priority list.”
Translation: Management was consistent in saying the operating expenses are increasing to help attract more new customers, an area of strength for them (note: although recent quarter did show a deceleration in new customers). Where MongoDB has been impacted is in “cohort expansion” or workload expansion.
Conclusion:
The economy is tough right now and it’s being echoed across many management teams. As much as we want to believe there are companies that are immune (Snowflake this quarter, MongoDB last quarter), it seems macro headwinds are catching up to nearly every industry. What the market is most concerned about is whether enterprise budgets will follow in the footsteps of consumer spending, with enterprise budgets typically being slower to cut and slower to add back in.
There’s nothing inherently wrong with MongoDB’s report except the company can’t grow as rapidly as it can during perfect market conditions. In addition, the company wants to spend to grow new customer accounts while the expansion opportunity presents itself. There’s nothing inherently wrong with that, it’s simply the market conditions aren’t favoring free cash flow negative companies right now which puts immense pressure on management teams to decide between growth or profits.
MongoDB has leverage and they have cash of $1.8 billion. There shouldn’t be any reason in the foreseeable future the company has to dilute shareholders to raise cash. That’s the most logical reason to care about negative cash flow but the market is sensitive and emotions are running high. Valuation, of course, is also key as the top cloud companies in terms of valuation are all free cash flow positive which means MongoDB cannot be in the top 5 on valuation until it returns to FCF positive.
Coupled with the decreasing margins, MongoDB is not being able to provide anything on the horizon to look forward to as a few cloud companies have asserted to do so would be to become an economist. Right now, Q3 and Q4 are expected to mirror Q2.
If you join the webinar today, Knox is going to speak about a long overdue bounce that we still hope is coming and will provide us the opportunity re-arrange positions. I don’t see us holding MDB at this high of allocation and I also don’t see us closing it – it’ll be something in-between.