Skip to content
Logo-main-white.860316a8

I/O Fund

  • Home
  • Free Stock Analysis
  • AI Stocks
  • BEST OF 2025
  • Analysts
  • Nvidia Hub
  • About
    • Case Studies
    • About Us
    • Premium Services
    • Pricing
    • Notable Wins
    • I/O Fund Reviews
    • Media
  • Contact Us

Category: Ctv

Top 3 Ad-Tech Stocks For 2024

Posted on March 18, 2024June 30, 2026 by io-fund
Top 3 Ad-Tech Stocks For 2024

This article was originally published on Forbes on Forbes Forbes on Mar 14, 2024,07:01pm EDT

Ad spending growth is widely forecast to accelerate in 2024, after a challenging macro environment significantly dented budgets and growth in 2023. The US advertising market is already showing positive signs of growth, starting off 2024 with a 4.3% YoY increase in January, the strongest January on record and a tenth straight monthly increase.

We’re tracking ad-tech at the moment for three key reasons: a robust ad market backdrop with multiple major event tailwinds, strong cash flow generation, and improvements in operating leverage. We’ve previously covered the 2024 outlook for four major digital advertising verticals in our analysis “Ad Spending Growth to Accelerate In 2024” at the end of December; now, we take a look at three of the advertising industry’s top stocks: Meta, The Trade Desk, and Alphabet.

Meta: The Juggernaut Has Returned

The Juggernaut is back — Meta has been the second-best performing stock of the Magnificent 7, with its 44% return since the end of 2021 and a 301% return since the end of 2022 beaten only by Nvidia. This rally has been supported by significant improvements in operating leverage as revenue growth has reaccelerated to the mid-20% range.

Meta has stood out amongst social media peers for its strong growth in ad impressions, a recovery in ad pricing, and its ability to generate strong cash flows while still spending tens of billions on R&D. We’ve tracked Meta’s strong ARPU acceleration, but the more impressive (and arguably more important) story for Meta is how this translates into a substantial degree of operating leverage.

Meta’s operating margin expanded over twenty percentage points YoY to 40.8% in Q4, returning to a margin not seen since Q1 and Q2 2021. FY23 operating margin improved 990 bp YoY to 34.7%, with room for improvement in FY24. This is helping drive a strong improvement in the bottom line, with Meta reporting a net margin of 34.9%, a second straight quarter above 33% and a strong 2040 bp YoY expansion. Improvement from the 2022 bottom in fundamentals is easily visible in the chart below.

Meta Platforms Margin

Source: YCharts

The rebound in leverage comes despite Meta pouring tens of billions into Reality Labs – operating loss for Reality Labs totaled ($16.1) billion for FY23, or a massive ~1195 bp headwind to operating margin.

Sign up for I/O Fund's free newsletter with gains of up to 221% – Click hereClick hereClick here

Meta’s Momentum to Continue in 2024

Meta’s momentum with strong revenue growth is expected to continue in 2024, supported by ARPU trends. In addition, the implementation of AI features, a favorable ad market backdrop, and improving operating leverage supports substantial EPS growth this year.

Meta guided for a very strong Q1, calling for 24.8% YoY growth, a third straight quarter with growth >20%, though it comes against a weak 2.6% YoY comp. Accelerating ARPU in Facebook’s two core geographies, the US/Canada and Europe, supports this revenue growth story.

Facebook ARPU Growth YoY

Source: Meta

Also supporting the growth story is a favorable social media ad spend backdrop, as well as major political and sporting events, namely the US presidential election in November and the Summer Olympics. Globally, social media ad spend has one of the fastest projected growth rates in the ad industry at +13.8%.

In the US, growth is expected at a similar rate, with Insider Intelligence projecting 13.5% YoY growth to $82.9 billion. This represents a $7.8 billion increase from their Q1 2023 forecast, with the market benefiting from “higher ad loads, a focus on lower-funnel ads, and an improved advertising economy,” driven by both Meta and TikTok.

For 2024, key metrics are supporting a return to >40% operating margin for the full year and a possible >33% net margin, driven by increasing ad pricing, strong engagement trends and impressions growth, aided by the release of numerous AI features. Reaching those margins for the full year would imply EPS growth of nearly 38% to $20.50 on $160B in revenue. Meta would be trading at a 24x forward PE ratio under that EPS growth assumption, 15% cheaper than its 5-year average PE of 27x; however, this is the peak multiple we’ve seen so far in Meta’s rally.

The Trade Desk: CTV Tailwinds Offer Growth Outlet

The Trade Desk, which offers a cloud-based digital advertising purchasing and optimization platform for advertisers across many mediums, from CTV to display, audio, digital out-of-home, and more, continues to be one of the fastest growing ad-tech stocks in the industry. Revenue grew 23% in FY23 to $1.95 billion, outpacing a tepid ad market but representing a 9 percentage point deceleration from 32% revenue growth in FY22.

Though revenue has decelerated, profitability has remained solid, and GAAP net income more than tripled YoY to a nearly 10% margin this year, though that is much lower than historical levels. Operating income is showing signs of stability and improvement on a TTM basis, after periods of volatility in 2021 and 2022.

The Trade Desk TTM

The Trade Desk's operating income has quadrupled from $50 million in early 2017 to $200 million in2023 despite a deterioration in operating margin. Source: YCharts

Despite a steady deterioration in TTM operating margin over the past six years, from the 30% range to the 10% range in FY23 (after briefly dipping negative), operating income has grown, in fact it has quadrupled from $50 million in early 2017 to $200 million in 2023.

The challenge now for The Trade Desk is maintaining this more rapid trajectory in operating income growth through 2024 and into 2025 given that revenue growth is expected to decelerate. This will be critical in driving expansion in GAAP net margin, which hovers just below 10% currently, compared to above 15% as it had maintained for more than three years.

The Trade Desk Profit Margin

The Trade Desk's net profit margin hovers just below 10% currently, compared to above 15% as it had maintained for more than three years. Source: YCharts

Every Thursday at 4:30 pm Eastern, the I/O Fund team holds a webinar for premium members to discuss how to navigate the broad market, as well as various stock entries and exits. We offer trade alerts plus an automated hedging signal. The I/O Fund team is one of the only audited portfolios available to individual investors. Learn more here.Learn more hereLearn more here.

CTV, Kokai Provide Growth Opportunities in 2024

CTV ad spend and the ramp of The Trade Desk’s new AI-powered buying platform Kokai offer two potential growth outlets for 2024.

CTV ad spend is forecast to be digital advertising’s fastest growing channel this year, with Dentsu placing growth at 30.8%, while BIA is expecting growth as high as 39.5%. CTV ad spend in total has surged 400% since 2019, as use of streaming services soared through 2020 and 2021; now, rising adoption for major streamers’ ad-supported tiers beckons to bring more spend through CTV. This trend bodes well for The Trade Desk, as CTV “continues to be the fastest-growing channel at scale” for the company, as it sees that “ad supported streaming is going to be an essential strategy for any successful TV provider moving forward.”

Kokai, which launched in June 2023 as The Trade Desk’s AI-powered buying platform, has been labeled by CEO Jeff Green as the “largest platform overhaul” in its entire history. Kokai will be scaling throughout the year, and promises a new degree of optimization for ad buyers while providing KPIs throughout the entire funnel, instead of simply at the last click. In essence, The Trade Desk sees Kokai as an “upgrade in almost every way” to its existing platform.

Though determining the growth trajectory of Kokai over the next few quarters may be challenging, tracking gross spend and The Trade Desk’s take rate provides insights into revenue acceleration trends, and if Kokai and a strong CTV ad market are driving an acceleration in spend and improvements in take rate.

The Trade Desk Take Rate

Source: The Trade Desk

The Trade Desk’s take rate has fluctuated between 19% and 21%, hovering around 20.3% in FY23. While it may seem obsolete to track a metric that fluctuates within a tight 200 bp range, the impact of a 100 bp change in take rate is actually quite large. Take FY21 as an example, when The Trade Desk recorded its lowest take rate at 19.4% — had this been 100 bp higher at 20.4%, revenue growth in the year would have been 700 bp higher, at 50% versus the 43% reported growth.

If gross spend can accelerate via a robust CTV market and Kokai’s improvements and efficiency gains for buyers, maintaining a take rate above 20% or driving growth to above 20.5% can help revenue growth accelerate to the high-20% range. However, the upcoming phase-out of cookies provides a significant risk to take rate, in that if The Trade Desk fails to get significant adoption of UID 2.0, which is the second most-used cookie replacement, it may struggle to command such a high take rate due to a loss of targeting ability in a cookie less digital environment.

Alphabet: Beneficiary of Search, CTV Ad Spend

Alphabet is a beneficiary of both search and CTV ad spend, and has seen growth accelerate this year as it works to integrate generative AI features and AI-based tools to drive improved ROI for advertisers – Alphabet recently reorganized its digital ad business to place more emphasis on generative AI and AI automated ads.

Alphabet reported $65.5 billion in advertising revenue, up 11% YoY, its first double-digit growth rate in six quarters, driven by strength in Search and YouTube. Alphabet has nearly doubled its quarterly run rate in just four years.

Alphabet Total Ad Revenue

Source: Alphabet

Search and YouTube ad revenue growth accelerated in each quarter this year, from the low single-digits to 12.7% and 15.5% in Q4 respectively. What Alphabet is demonstrating is that AI-powered ad solutions are helping drive resilient Search ad revenue growth, at the same time that strong engagement metrics for YouTube Shorts (>2B MAUs, 70B daily views) and increasing watch times for YouTube TV are boosting YouTube’s ad revenue growth.

YouTube Revenue Growth

Source: Alphabet

AI Integrations Provide Opportunity for Growth

Alphabet is steadily making progress in integrating AI features in Search via Search Generative Experience (SGE) and in advertising campaigns via Performance Max (PMax). Executives have previously mentioned how these “AI-powered solutions like Search and PMax are helping retailers drive reliable, strong ROI and meet customers wherever they are across the funnel.” This is the value-add of SGE and PMax – driving CPM higher from via higher ROIs from improved targeting and optimization, while letting Alphabet toy with new ad placements and formats in Search pages. Alphabet sees “significant opportunities” to “actually deliver incredible ROI at scale” from these AI-powered features.

Alphabet’s Demand Gen is instrumental in driving long-term growth momentum across its more than 3 billion monthly active YouTube and Gmail users. Alphabet explains it as its “big bet to help social advertisers find and convert consumers via immersive, relevant, visual creatives” across these channels. Alphabet shared some color on Demand Gen in Q4, saying that “tens of thousands of advertisers are testing and, on average, seeing 6% more conversions per dollar versus image-only ads in Discovery campaigns.”

Gemini is also playing a more forward facing role in advertising products, powering Alphabet’s new conversational features in Google Ads. While it is still in beta in the US and UK, early tests have shown “advertisers are building higher-quality Search campaigns with less effort,” streamlining the campaign building process.

Cash is King

As the saying goes, cash is king, and Meta, Alphabet, and The Trade Desk stand out for strong cash flow generation metrics. Meta leads the Magnificent 7 with a nearly 53% operating cash flow margin, while The Trade Desk and Alphabet command OCF margins in the low-30% range.

Alphabet and Meta TTM Change

Source: YCharts

To put how strong this cash flow generation is in perspective, Meta and Alphabet have grown operating cash flow 1,400% and 425% respectively. This is incredibly impressive given the scale of the duo’s cash flows, with Meta generating $71 billion and Alphabet $101 billion.

Conclusion

Ad-tech stocks are on 2024’s watchlist for a few reasons: strong cash flow generation and growth, a positive ad-market backdrop buoyed by major political and sporting events, and implementation and integration of AI features to help drive improved ROI for advertisers. Meta, Alphabet and The Trade Desk look best positioned to capture and capitalize on the ad industry’s acceleration this year.

My firm is not buying these stocks at the moment as we believe we can get them lower than where they’re currently trading. Though Meta is trading lower than its 5-year average PE ratio, it’s at the peak level sustained so far during 2023’s rally, leaving less room for upside. On the top line, it trades at a 9.6 with 11 being the highest its traded since 2019 (the stock was valued at 11 during Covid when ad-tech was surging from high social media use). The 3-year median is 6.4 and the 5-year median is 8.3.

Alphabet is the cheapest of the Mag 7, trading at a 20x forward PE although EPS growth is expected to be more tepid at just 17% this year, versus 38% for Meta. The company is trading right at its 3-year median and 5-year median on a PS ratio. Some of the softer price action could be due to the anti-trust lawsuit which has closing arguments set for May.

The Trade Desk is more expensive than the two on the bottom line, trading at 123x forward earnings, although it is expected to deliver 82% growth to $0.66 in GAAP EPS. Its trading at it’s 3-year median and 5-year median with a PS ratio of 20.6.

Every Thursday at 4:30 pm Eastern, the I/O Fund team holds a webinar for premium members to discuss how to navigate the broad market, as well as various stock entries and exits. We offer trade alerts plus an automated hedging signal. The I/O Fund team is one of the only audited portfolios available to individual investors. Learn more here.

I/O Fund Equity Analyst Damien Robbins contributed to this report.

Please note: The I/O Fund conducts research and draws conclusions for the Fund’s positions. We then share that information with our readers. This is not a guarantee of a stock’s performance. Please consult your personal financial advisor before buying any stock in the companies mentioned in this analysis.

Recommended Reading:

  • Cybersecurity Stocks: CrowdStrike Soars While Palo Alto And Zscaler Fall
  • The Magnificent 7 Are Falling Like Dominos; Only 3 Remain
  • Nvidia Stock Gained $1.5 Trillion To Surpass The FAANGs – Apple Is Next
  • Palantir Stock Surges From Artificial Intelligence Platform
Posted in Ctv, Digital Ads, Tech StocksLeave a Comment on Top 3 Ad-Tech Stocks For 2024

Ad Spending Growth to Accelerate In 2024

Posted on January 1, 2024June 30, 2026 by io-fund
Ad Spending Growth to Accelerate In 2024

This article was originally published on Forbes on Dec 27, 2023, 07:15 am ESTForbes Forbes on Dec 27, 2023, 07:15 am EST

Ad-tech stocks have generally enjoyed strong returns in 2023, buoyed by a rather fierce tech rally. Ad spending growth showing initial signs of stabilizing in the back half of the year, with ad spend growing YoY in each month from July to October.

Ad spending growth is widely forecast to accelerate in 2024, after a bumpy start to 2023 stemming from macro uncertainty as growth forecasts were pulled lower mid-year. The market looks to be cheering on a return to higher growth in 2024, along with new synergies from generative AI advertising offerings from Big Tech and pockets of stronger growth in digital and retail media ad spend.

Lower budgets in 2022 and early 2023 affected nearly every ad-tech stock, including companies that draw audiences in the billions – on a three-year basis, only three of ad-tech’s primary names have a positive return: The Trade Desk (TTD), Alphabet (GOOG), and Meta (META), and the latter two only recently broke back into positive territory. The rest of the sector is still struggling to cope with a significant slowdown in growth, from 19.6% in 2021 to the low single digits in 2023.

Sign up for I/O Fund's free newsletter with gains of up to 221% – Click hereClick hereClick here

Growth Forecast to Gain Steam

Growth forecasts from Magna, Dentsu and GroupM generally point to an acceleration next year, at around 5.7% on average between the three, compared to 4.7% in 2023.

Global Ad Spending Growth Forecasts

Source: I/O Fund

Dentsu is projecting 4.6% YoY growth in 2024, almost 2 percentage points higher than its final 2.7% growth forecast for 2023. This outlook is positively impacted by stronger growth in CTV, digital and retail media ad spend. However, Dentsu sees media price inflation contributing 2.1 percentage points of growth in 2024; stripping out that effect, global ad spend is expected to increase just 2.5% YoY, a slight deceleration from 2023. media price inflation contributing 2.1 percentage points of growth in 2024; stripping out that effect, global ad spend is expected to increase just 2.5% YoY, a slight deceleration from 2023.

Magna tends to lean more bullish in its forecasts compared to Dentsu, projecting 5.5% growth in 2023 and a 1.7 percentage point acceleration to 7.2% in 2024. Magna’s outlook is boosted by “economic stabilization and lower inflation,” themes that have been broadly supported by a slew of macroeconomic data over the past two months. Magna and Dentsu both see positive effects from political spend, and major sporting events including the UEFA EURO 2024 and the Summer Olympics.

GroupM is forecasting a 0.5 percentage point deceleration to 5.3% growth in 2024, with this weaker outlook driven primarily by “uncertainty in some markets and interest rates.” Despite the weaker forecast, GroupM is more positive on retail media ad spend, similar to Dentsu, seeing the segment growing 8.3% in 2023.

Below, we will take a look at some of the dominant names across four major digital advertising categories: search, social media, streaming/CTV, and retail media for more color on the ad industry in 2024. 

The I/O Fund provides entries and exits through real-time trade alerts for the stocks the portfolio owns. The team is ramping our analysis for our 2024 portfolio now. Learn more here.here.

Search Ad Spend to Decelerate, But AI Showing Promise

Search ad spending is projected to decelerate in 2024, dropping from an expected 12.5% in 2023 to a projected 9.5% next year as advertisers shift dollars to other mediums, primarily social media and CTV. Even with this deceleration, search ad spend is still projected to outpace global ad spend’s growth.

Google has seen Search revenue growth accelerate in each quarter this year, from just below 2% in Q1 to 11.3% in Q3 – the highest growth in five quarters driven by retail vertical growth. What Google is showing in Q3, and likely in a similarly strong Q4, is that AI-powered ad solutions are helping drive resilient Search ad revenue growth.

Google is rolling out AI-driven features and is now reorganizing its digital ad business to place more emphasis on generative AI and AI automated ads. SVP Phillip Schindler explains that these “proven AI-powered solutions like Search and PMax are helping retailers drive reliable, strong ROI and meet customers wherever they are across the funnel.” Increased ROI and improved targeting help keep advertisers engaged and could potentially draw some additional advertising spend to Search.

Google Search Revenue YoY Growth

Source: I/O Fund

We discussed in the past how Google is on the precipice of a multi-decade disruption driven by generative AI: Google is showing early promise with Search Generative Experience (SGE), while Microsoft is actively deploying generative AI to search via Bing Chat.

Deploying generative AI search experiences opens the door for different ad formats and placements, as well as an increase in surfaced links and content. AI can also drive help revenues higher from bid optimization. Google’s AI campaigns, including Performance Max and Smart Bidding, are tapping AI and machine learning tools to analyze millions of data signals to better predict future ad conversions and improve bidding performance.

Today, Google dominates the search advertising market, with estimates placing the giant holding over 60% of the market, however, anti-trust risk is still present for Google as regulators seek to determine if the company has been engaging in anti-competitive behavior across its search engine and demand-side platform (DSP).

For a deeper dive into Alphabet and how the Search giant is entering its Year of Execution, read more here.here.

Social Media Ad Spend Remains Robust

Social media ad spend is expected to remain robust in 2024, and may potentially overtake search ad spending this year, according to estimates from WARC. This medium will enter 2024 with one of the fastest projected growth rates at +13.8%, with spend estimated to climb to $227.2 billion, or less than 1% below search advertising’s $229.2 billion.

Social media’s share of total daily time spent on the internet remains above 35%, at more than 2 hours and 20 minutes per day on average. Combine that with billions of MAUs across the most popular platforms, and it’s easy to see why social media continues to be a popular place to park ad dollars.

Meta dominates the market with more than 60% share and has shown positive trends heading into the end of 2023 that are likely to carry over into 2024. Advertising revenues rose 23.5% YoY to $33.6 billion in Q3. This was driven by 34.2% growth in Europe to $7.77 billion as ARPU rose 33.8%, and 16.8% growth in US and Canada to $15.19 billion.

Pinterest (PINS) and Snapchat (SNAP) also mirror the trend of strong European growth, with Pinterest reporting European revenues rising 33% to $618 million as ARPU increased 26% in Q3. Pinterest said that its shift to Direct Links generated “88% higher outbound click-through rates and a 39% decrease in cost per outbound click for CPC objectives” for early adopters.

Snapchat’s European revenues rose 19.6% as ARPU rose 15.3%, the slowest of the three but much quicker than its overall revenue growth of 5.3%.  

Meta Ad Impressions & Ad Pricing Growth, YoY

Source: I/O Fund

There are two factors currently driving this strong increase in revenues, especially for Meta – a surge in ad impressions to >30% YoY growth, and a recovery in ad pricing, which is nearing an inflection back to growth after declining throughout 2022 and 2023 to-date.

Engagement trends also remain positive, from both a user and advertiser standpoint. Meta noted that “AI-driven feed recommendations continue to grow their impact on incremental engagement,” driving a “7% increase in time spent on Facebook and a 6% increase on Instagram” this year.

Every Thursday at 4:30 pm Eastern, the I/O Fund team holds a webinar for premium members to discuss how to navigate the broad market, as well as various stock entries and exits. We offer trade alerts plus an automated hedging signal. The I/O Fund team is one of the only audited portfolios available to individual investors. Learn more here.Learn more hereLearn more here.

Streaming/CTV to See Double-Digit Growth

With 91.8% of internet users between ages 16 to 64 watching content via streaming services, it’s easy to see why advertisers are favoring CTV and YouTube over linear TV. CTV ad spend has risen 400% since 2019, as use of streaming services surged through 2020 and 2021, while linear TV spend has been declining. CTV ad spend is forecast to be the fastest growing channel next year – Dentsu places growth at 30.8%, while BIA expects growth as high as 39.5%.places growth at 30.8%, while BIA expects growth as high as 39.5%.

Major streaming providers had expanded into ad-supported tiers, which are demonstrating both strong growth and strong ad revenue generation. Netflix’s ad-supported tier accounted for 30% of all sign-ups in September and now accounts for ~6% of all US subscribers, per Antenna.

  • Netflix is projected to reach $1.03 billion in ad revenue in 2024, an estimated 50.3% increase from ~$684.6 million in 2023, according to Insider Intelligence.
  • Disney+ is expected to see a slower ramp in ad revenue, with a projected 16.1% increase to $911.9 million in 2024 followed by a 20.2% increase in 2025.
  • Amazon is rolling out its ad-supported Prime Video tier next year, and is projected to generate $3.13 billion in CTV ad revenue, topping Roku to become the third-largest CTV ad platform.
  • YouTube is also sharing in these gains, with ad revenues rising 12.5% to $7.95 billion in Q3, the fastest growth rate in six quarters.
Netflix, Disney+ Ad Revenue ($M)

Source: I/O Fund

Although Roku saw strong contributions from video advertising, it added a bit a caution on the market, saying that the “macro environment continued to pressure the overall U.S. advertising market” in Q3. Roku sees video ads continuing this trajectory in Q4 as it witnesses positive ad momentum driven “in part by diversifying demand sources of advertisers on our platform and expanding partnerships.”

The Trade Desk CEO Jeff Green summed up the CTV opportunity perfectly: “‘Executives at every major streaming giant with both an ad-supported and an ad-free tier, (including Disney, Netflix, Paramount, Warner Bros Discovery and NBC Universal) say that total revenue per user is higher on the ad-supported plan than it is on the ad- free plan.’ Not only do media companies generate more revenue per user within an ad supported option, but the potential for growth is much greater. Ultimately, there’s a limit to how much viewers will spend on subscriptions. Economic pressures on the consumer, right now, are increasing the appeal of a free or low-cost option, that is supported by ads. However, this model is only sustainable if the ad load is significantly lower than traditional linear TV. And the only way we get there is if the ads are relevant to the viewer, so that advertisers are willing to pay more for each of them.”

Retail Media Emerging as One of the Fastest Growing Categories

Retail media ad spend is quickly emerging as one of the fastest growing digital ad categories — US retail media ad spend is forecast to grow nearly 23% next year to more than $55 billion before almost doubling by 2027. Globally, retail media ad spend is expected to increase 10.4% to $141.7 billion, driven by this US growth. Amazon and Alibaba are a dominant duo in this market, with nearly 70% estimated share in 2023, but Walmart, Etsy, eBay and other retailers and e-commerce platforms share in the gains.

Retailers and advertisers are prepping for a longer and stronger holiday season, with holiday spending on the rise despite weaker consumer sentiment. Amazon is “still seeing a lot of strength in the lower-funnel ad products like sponsored products,” even as companies remain a bit more cautious on upper-funnel ads such as display and video.

Amazon’s ad revenues grew 26% YoY in Q3 to more than $12 billion, setting up for a potential $14 billion quarter in Q4 with supporting seasonal strength. For 2024, Amazon is expected to drive a majority of the market’s growth, as it is forecast to see ad revenues rise 16.7% from $45.4 billion to $52.7 billion. Amazon’s Q4 and Q1 ad revenue growth will give a clue into how retail ad spend growth may unfold.

Amazon Ad Revenues

Source: I/O Fund

Other benchmark companies are showing similarly strong trends: Meta noted that its “online commerce vertical was the largest contributor” to growth in Q3, while its AI tools for Advantage+ shopping campaigns “reaching a $10 billion run rate” with more than half of its advertisers using those tools.

2024 Outlook

2024 is widely expected to see an acceleration in ad spending, with major sporting events and political spend aiding the growth forecast. Retail media is expected to see 23% growth in the United States as it begins to shift to other mediums. CTV’s rapid growth outlook of 30% to 40% is boosted by major streaming media companies introducing ad-supported tiers. CTV ads are currently expected to be the strongest growing segment of the four covered here.

Although search ad spending is forecast to soften, Google’s reorganization of its digital ad business to further integrate and utilize generative AI shows promise in reinvigorating growth. Social media ad spend remains robust, and improving pricing trends combined with strong impression growth and AI opportunities could send growth higher next year.

Macro uncertainties are not completely out of the picture. 2022 and early 2023 saw ad-tech stocks get pummeled as growth slowed dramatically from macroeconomic headwinds, so a resurgence of economic growth concerns and any potential budget optimization trends among major advertisers could dent the strong returns enjoyed by a plethora of ad-tech stocks this year. What’s most important to remember is that ad spending can be paused very quickly or resumed quickly, and so this sector is known for sharp moves. We continue to monitor this sector as we build our 2024 portfolio.

I/O Fund Equity Analyst Damien Robbins contributed to this report.

Please note: The I/O Fund conducts research and draws conclusions for the Fund’s positions. We then share that information with our readers. This is not a guarantee of a stock’s performance. Please consult your personal financial advisor before buying any stock in the companies mentioned in this analysis.

Recommended Reading:

  • Top Ad-Tech Stocks: Q3 2022 Sector Overview
  • Alphabet Stock: Search Giant Is Just Getting Started
  • This Stock Price For Netflix Is A “Buy” For 2023
  • Ad Budgets Set To Slow Even More In 2023
Posted in Ctv, Digital Ads, Tech StocksLeave a Comment on Ad Spending Growth to Accelerate In 2024

Ad Budgets Set To Slow Even More In 2023

Posted on January 31, 2023June 30, 2026 by io-fund
Ad Budgets Set To Slow Even More In 2023

This article was originally published on Forbes on Jan 27, 2023,12:17am ESTForbes on Jan 27, 2023,12:17am EST

Ad-tech stocks across the board had a tough year last year. Investors are hoping that 2023 will be a better year, yet according to the projected ad spend for 2023, this may not be the case.

It’s clear that lower ad budgets in 2022 affected nearly every ad-tech stock, including companies that own large audiences, such as Alphabet and Meta. It did not matter if an advertising company has audiences as large as 2 billion or more, runs large R&D departments that can leverage AI, or is centered in the leading media growth trend of connected TV (CTV) ads. Broadly speaking, because ad spend budgets were slashed on a year-over-year basis, this one, single headwind caused 50% to 80% selloffs across the advertising industry. Therefore, it’s prudent to look at whether ad-tech budgets will increase this year or if 2023 will look more like 2022 in terms of top line growth.

Here’s What Happened to Advertising Stocks in 2022

The stock market of 2022 was hectic, and the blowoff top in 2021 is primarily blamed for this. However, irrespective of the stock market’s performance in 2021, the global economy and the United States economy is in a slowing growth environment.

Here is a quote from Insider Intelligence published in November:

“Total digital ad spending worldwide will not grow as robustly over the next two years as we expected in our Q1 forecast. We now project 2022 digital ad spending worldwide to reach $567.49 billion, up 8.6% over 2021. In our previous forecast, we expected 15.6% growth to $602.25 billion. Our Q1 forecast predicted digital ad spending worldwide would reach $756.47 billion by 2024, but we now expect it to reach only $695.96 billion.

The key words here are “will not grow as robustly as we expected.” Stock investors get trapped when growth slows and forecasts come down mid-year. This is because not only must stock valuations contend with a growth rate cut in half (8.6% versus 15.6%) — but analysts must also try and figure out when a bottom will form on the slowing growth. Most will lean conservative, which pushes valuations down even further.

GroupM also lowered their forecast for 2022, from 8.4% to 6.5% (excluding US political advertising), and pure play digital advertising was cut from 11.5% to 9.3%.

Sign up for I/O Fund's free newsletter with gains of up to 221% – Click hereClick hereClick here

What to Expect for Ad Spend in 2023

According to the sources noted above, 2023 will not be the year of recovery for ad budgets. As of now, growth is expected to be lower than 2022.

Magna predicts that global advertising revenue will grow to $833 billion in 2023, or about 5% year over year, compared to 7% in 2022. GroupM is projecting 5.9% growth, or $856 billion in 2023 (excluding US political advertising), compared to 6.5% in 2022 (excluding US political advertising). Both of these 2023 estimates reflect downward revisions of 1.5% and 0.5%, respectively. Including US political advertising GroupM is projecting 7.8% for 2022 and 4.6% in 2023.

Global Advertising  YoY Growth Projections

Source: Company Websites

According to Insider Intelligence, China will weigh heavily on 2023 numbers as the second-biggest digital ad market is expected to “post its lowest digital ad growth on record” due to “tougher regulations and economic headwinds.”

According to IAB, the U.S. advertisement market is expected to grow by 5.9% in 2023, which is lower than the 9% growth seen in 2022. The slowdown in growth is the direct result of the challenging macro environment.

On a brighter note, the CTV market is expected to grow 14.4% in 2023 and will grow faster than the overall advertisement market. They forecast Linear TV spending to see a drop of (6.3%). Across the advertising channels, digital video, including CTV, is expected to have the highest share of 22.4%, up from 19.3% in 2022.

There are also positive comments from other ad-tech companies on CTV. Hunain Khan, Director, Programmatic CTV supply at Xandr said, “2023 marks a new age of CTV, due to the increased amount of available premium inventory through AVOD platforms.”

Similarly, Hitesh Bhat, Director, CTV/OTT, EMEA at PubMatic said, “2023 will be an interesting year for CTV in Europe, but I’m avoiding “the year of CTV’ hyperbole. The ad-funded opportunity will grow significantly with the entrance of huge players such as Netflix, Disney+, Paramount+ and the combined HBO/Discovery+ offering. I think Netflix and Disney will be careful in terms of ad loads, so as not to annoy viewers who are still also subscribers.

The Dentsu ad spending report forecasts that global advertising spending in 2023 to increase by 3.8% YoY to $740.9 billion. It is lower than the 8% expected growth for 2022 and the 19.6% growth reported in 2021. The forecasts have been slashed from the July report, which projected a growth of 5.4% for 2023. Some of the reasons mentioned in the report for the slowdown include rising inflation, interest rates, recessions, and political uncertainty. The report suggests that if we exclude the media price inflation, ad spending is forecasted to drop (0.6%) in 2023.

The Americas region is expected to grow 3.7% YoY to $339.1 billion, the EMEA region to grow 3.8% YoY to $156.7 billion, and Asia Pacific is forecasted to grow 4% to $245.1 billion.

Digital ad spending is expected to grow 7.2% YoY to $422.8 billion. It is down from 13.7% expected growth in 2022. Digital ad spending accounted for 57.1% of all advertising spending in 2023. The share is expected to increase to 59.5% in 2025.

According to Insider Intelligence, digital ad spending is expected to grow 10.5% in 2023 from the expected 8.6% in 2022, both of these estimates reflect downward revisions of 2.6% and 7%, respectively.

The CMO survey done in September 2022 showed that the marketing spending increased by 10.4% in the previous one year for marketers. However, they predict that the growth will slow down in the next one year to 8.8% and will start trending toward the pre-Covid level of 5.8%.

A majority of the companies say that the inflationary pressures are decreasing marketing spending levels. Marketing leaders in large companies report marketing spending reduction due to inflation and on the other hand, marketers in the smallest companies report an increase in marketing spending. The survey also suggests that the marketing expenses as a percentage of total revenue have reverted to the pre-Covid levels, as seen in the below chart. It reached a high of 13.2% in February 2021 to 8.7% as per the September 2022 survey.

Marketing Expenses % of Company Revenues

Source: CMO SEPTEMBER 2022 SURVEY

The I/O Fund has launched a new $99/year Premium Newsletter called "Essentials" — this newsletter delivers premium samples for our readers who want more actionable analysis for their tech portfolios. This month, we released a stock pick that we believe will be a leader in 2023 plus a video with the buy plan.$99/year Premium Newsletter called "Essentials" — this newsletter delivers premium samples for our readers who want more actionable analysis for their tech portfolios. This month, we released a stock pick that we believe will be a leader in 2023 plus a video with the buy plan.

Google May Be the Stronger Ad-Tech Company in 2023

According to analyst consensus, Google is expected to generate $168.44 billion in net digital ad revenues worldwide this year, down from Q1 expectation of $174.81 billion. By 2024, Google’s ad business will reach $201.05 billion—or 2.8% below the Q1 expectation.

“Google has an edge over its other ad-reliant competitors in an economic downturn, as advertisers facing budget cuts typically prioritize lower-funnel channels with higher ROI like search,” said Evelyn Mitchell, analyst at Insider Intelligence. “Search has also retained full functionality in the wake of Apple’s privacy changes. Search ads are served in response to a user query and don’t usually leverage data about that user, so they’re less affected when iOS users opt out of being tracked. Meanwhile, social media advertising relies more heavily on consumer data.”

Social Network Users in the U.S. by the Platform 2022 Millions

Source: EMARKETER/INSIDER INTELLIGENCE, NOVEMBER 2021

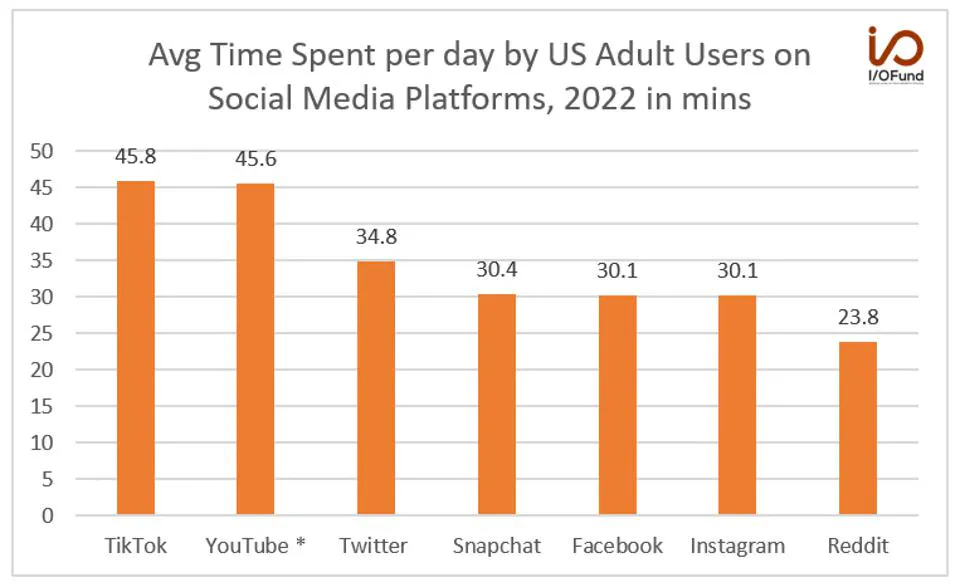
Average Time Spent by U.S. Adults on Social Media in Minutes, 2022

Source: EMARKETER/INSIDER INTELLIGENCE, APRIL 2022

The above two studies from Insider Intelligence show that Facebook and Instagram have the highest number of social media network users in the US. However, these platforms have lost the top spots in terms of engagement as TikTok and YouTube has the highest daily time spent by the users. Due to higher engagement, these platforms are likely to do better for social media advertising makes more sense.

On that note, Insider Intelligence expects Meta to generate $112.68 billion in digital ad revenue for the year 2022, representing a YoY drop of 2%, which is down significantly from the Q1 forecast of $129.16 billion. The firm has lowered the forecast for Meta through 2024 by nearly 20% citing Instagram’s ad revenue to grow by 2.6% YoY to $43.28 billion compared to a 50.2% growth in 2021. The estimate is significantly lower than the Q1 forecast of $54.16 billion. They expect Instagram revenue to reach $59.61 billion by 2024, which is more than 27% lower than the Q1 projection.

Below, Lead Tech Analyst Beth Kindig covers why Meta’s lack of access to third-party data spells trouble for its future growth. This webinar was recorded in April of 2022 yet is still relevant today.

Snapchat ad revenues are also negatively impacted by the economic slowdown. Insider Intelligence has slashed the 2022 ad revenue estimates by 18.3% from their Q1 forecast. They have also reduced the 2024 ad revenue by 33.6% from their Q1 estimates.

The TikTok Threat is Real

Insider Intelligence expects TikTok’s global ad revenue in 2022 to grow 155% YoY to $9.89 billion, below its Q1 estimates of $11.64 billion. They expect TikTok ad revenue to grow 36.7% in the next two years to reach $18.49 billion. However, the 2024 forecast has been by lowered by 21.6% from their Q1 estimates. Jasmine Enberg, the principal analyst at Insider Intelligence, said, “TikTok has transformed from an experimental play to a must-buy for many advertisers,” She further said, “But TikTok isn’t immune to the macroeconomic challenges causing advertisers to trim their overall digital ad budgets. Meanwhile, growing anti-TikTok sentiment among media executives and renewed calls by government officials to ban the platform are causing some advertisers to be more cautious about their spending there.”

According to the Sensor Tower report, social channels accounted for 61% of US digital ad spending in Q3 2022. The US digital ad spending is strong as it grew 5% quarter-over-quarter to $23 billion. Facebook leads the top advertisers in the United States. However, TikTok had the highest growth as it grew 29% QoQ and is a threat to other social media channels.

Disney+ increased its advertising spend in TikTok from $3 million in Q1 2022 to $17.9 million in Q3 2022. TikTok has been successful in being popular among the younger generation audience which has attracted marketers to its platform. As per Omdia research TikTok’s ad revenue is expected to exceed Meta and YouTube’s total video ad revenues by 2027.

Other ad-tech trends to watch for 2023

First-party data ownership is gaining popularity. The data is more reliable even though it might be smaller than the third-party data. The quality of the first-party data is superior and helps better understand the customer’s needs. Contextual targeting is another trend to watch. Contextual targeting means that users will see ads relevant to the topic you are watching or reading. Previously, you used to get ads based on browsing history. Contextual targeting might increase the chances of increasing the return on investment as the ads are relevant to the content. There could also be increased use of AI/ML tools in contextual targeting.

Conclusion

The overall advertising market is expected to slow down in 2023. Some of the crucial reasons are rising interest rates, inflation, and slowing global growth. Even though the estimates have been reduced, the digital ad market is expected to fare better than the broader advertising market.

We believe there will be a handful of winners despite more headwinds in 2023 and we cover these winners for our premium research site. However, until ad budgets resume growth, the industry at large is likely to be volatile in stock price.

Royston Roche, Equity Analyst at the I/O Fund, contributed to this article.

Please note: The I/O Fund conducts research and draws conclusions for the Fund’s positions. We then share that information with our readers. This is not a guarantee of a stock’s performance. Please consult your personal financial advisor before buying any stock in the companies mentioned in this analysis.

Posted in Ctv, Digital Ads, Tech StocksLeave a Comment on Ad Budgets Set To Slow Even More In 2023

Magnite Q3 Earnings: Improving Bottom Line

Posted on November 17, 2022June 30, 2026 by io-fund

Magnite provided a stark reminder that the bottom line is more important than the top line in current market conditions as the stock moved 80% off the earnings report with low revenue growth yet the small cap has rare strength with its improving bottom line and 20% cash flow margin.

Low Growth; Strong Bottom Line

The company reported Q3 revenue of $127 million, which grew 12%, and beat estimates by 2.8%. This is down from 23% last quarter.

For Q4, management is expecting revenue to be $154 million for growth of 8.3%. Perhaps Magnite also benefited by being the last to report as many ad-tech companies guided lower than 8.37%. Analysts were expecting growth of 8.25% for Q4.

CTV ad revenue grew 29% year-over-year to $55.8 million, and represents 44% of revenue. Management is guiding for 10% CTV ad revenue growth next quarter for $64 million in revenue, at the midpoint.

Mobile weighs on the company’s growth with 7% this quarter for $44 million, compared to 14% last quarter for $44 million. The segment was flat sequentially. Mobile represents 35% of revenue. 

Desktop is the weakest segment at (7%) growth this quarter for revenue of $27 million compared to 1% drop last quarter for revenue of $27 million. This segment was also flat sequentially. Desktop represents 21% of revenue.

Magnite breaks down United States and International growth with both regions growing YoY. The United States represents 78% of GAAP revenue.

The United States region GAAP revenue grew 9% YoY to $114 million, up from $106 million last quarter. International grew 18% YoY to $32 million, and was flat sequentially, with $31.2 million last quarter.

The company reported GAAP EPS of ($0.18) and Non-GAAP EPS of $0.18. This is an improvement from Q2 and also an improvement from the year ago quarter. In fact, this was the strongest EPS on GAAP and Non-GAAP basis over the past five quarters excluding the holiday quarter.

Analyst estimates for adjusted EPS next quarter are $0.32. Assuming the company reports this EPS, it will exceed last year’s holiday season with adjusted EPS of $0.26 and it will also beat Q4 2020 with adjusted EPS of $0.19.

This improvement is important to note and to continue to track as few companies are able to improve bottom lines right now let alone a small cap. 

Pictured Above: Magnite stands out for its improving bottom line.

The GAAP gross margin was down from 53% in Q2 to 51%. However, the GAAP operating margin has improved to (15%) in Q3 from (17%) in Q2. The improvement is more evident when you compare to Q1 at (34%) and the year ago quarter at (18%). Excluding the holiday period, Q3 2022 had the strongest GAAP operating margin from the past five quarters.

Down the income statement, the GAAP net margin of (17%) mirrored the operating margin with a 1 point improvement sequentially and YoY. This resulted in $24.4 million in net losses.

On an adjusted basis, the company reported a profit of $25.6 million, up from $20 million last quarter and up from $20 million in the year ago quarter.

Where Magnite shines is the cash flow margins. Operating cash flow of $28.6 million represents a margin of 20% on GAAP revenue. The company stated that it will have free cash flow of “over $105 million” which is up from the previous guide of $100 million. This will represent a FCF margin of 20.5%

Please note the following I/O Fund internal note on Magnite’s FCF calculations which deduct cash interest payments from operating cash flow. 

“Some companies calculate FCF in a different manner. If the company does not provide FCF, we can calculate using operating cash flows minus capex from the cash flow statement. In this case, the operating cash flow calculation itself is different which is a rare case. The operating cash flow is adjusted EBITDA less Capex. The FCF involved the deduction of cash interest payments which is available in the supplemental disclosures of other cash flow information as the recent earnings call provided the interest payments for this quarter, however, they did not provide cash interest separately.” 

The company has $253 million on the balance sheet and $725 million in debt. The debt is less of a concern as long as the company is FCF positiveas long as the company is FCF positive and doesn’t pursue anymore acquisitions. The debt includes $400 million in convertible senior notes and a term loan of $355 million due to the SpotX acquisition.

The company’s net leverage has greatly improved from 6.2X in Q2 2021 to 2.6X in Q3 2022. This also improved from 3.1X in Q1 to 2.8X in Q2.

Magnite reported stock based compensation of $17.4 million, or 13.7% of revenue. 

Magnite Proves the Valuation Trade is Alive and Well

Despite Magnite being comfortably profitable on an adjusted basis and free cash flow positive with a 20% margin, the stock was priced for bankruptcy or another fatal risk at 1.5 forward P/S going into earnings. I believe the stock rallied because the risk/reward didn’t reflect the valuation, rather reflected the broader “small cap” bucket where most small caps have serious profitability issues. 

The low valuation coupled with clear evidence Magnite is unlikely to go out of business anytime led to the stock rallying.

Magnite helps to illustrate that 2022 market conditions continue to be more favorable for stocks with strong bottom lines. This is a critical adjustment for growth investors as Magnite’s top line does not fall into a growth definition at 12% this quarter and 8% next quarter.

Note: All numbers quoted ex-TAC unless otherwise stated. GAAP margin is calculated on the GAAP revenue of $145.8 million. Please note, we do not own Magnite at time of writing but plan to enter if we can find the right technical setup.


Posted in Ctv, Tech StocksLeave a Comment on Magnite Q3 Earnings: Improving Bottom Line

Top Ad-Tech Stocks: Q3 2022 Sector Overview

Posted on August 23, 2022June 30, 2026 by io-fund
Top Ad-Tech Stocks: Q3 2022 Sector Overview

This article was originally published on Forbes on Aug 18, 2022,12:37pm EDTForbes on Aug 18, 2022,12:37pm EDT

The ad-tech sector's performance is closely linked with the macroeconomy. This sector has been hit hard in the last few months due to global uncertainty. We believe this sector will recover when the economy starts picking up. It is practically impossible to time the market. However, we believe that being prudent and buying stocks during the downturn helps to outperform the market in the long term.

Below we review the stocks in the sector to find out which companies have performed well in the recent quarter results and which companies stand out in revenue growth, profits, cash flows, and earnings surprise.

Top Ad-Tech Stocks with the highest revenue growth rates in Q2

Charts: Top Ad-Tech Stocks with the highest revenue growth rates in Q2

Source: YCharts

FuboTV led the ad-tech sector with the highest revenue growth rate in the recent Q2 results. The company’s revenue grew by 70% YoY to $221.9 million. North American revenue grew by 65% YoY to $216.2 million. For the next quarter, it expects North American revenue from $200 million to $205 million, representing a YoY growth of 29% at the mid-point of the guidance.

The company also announced that it would place Fubo Gaming under strategic review due to the changing macro environment. David Gandler, co-founder and CEO of the company, said, “We recognized that the market has changed and therefore, we have made the decision to place fubo Gaming, our online sports wagering business under strategic review. We will no longer pursue this opportunity on our own and are exploring the best path forward to scale the business. We look forward to continuing to update you as conversations progress.” The market reaction was positive following the strong results and the announcement on gaming.

The company’s first investor day on August 16th drew interest as the stock closed the day with 45% gains. The company’s CFO, John Janedis, said, "We continue to work towards long-term targets of adjusted EBITDA profitability and positive cash flow in 2025, and the Fubo flywheel will help us track towards that goal, as we execute a plan of controlled growth, alongside margin expansion."

Quarterly Revenue Surprise

Chart: Quarterly Revenue Surprise

Source: YCharts

DoubleVerify has crushed the analysts’ revenue estimates by 8% in the Q2 results and leads the ad-tech sector. It was followed by PubMatic, which beat analysts’ revenue estimates by 4%. PubMatic’s Q2 revenue grew by 27% YoY to $63 million, and the company reported an adjusted EPS of $0.23, which beat the analysts’ estimates by $0.08. The company’s CFO, Steve Pantelick, said, “We saw broad strength in the Americas region, led by fast-growing ad formats CTV, online video and mobile, and continued momentum in Supply Path Optimization.” The company also benefitted from the diversified portfolio of advertisers from over 20 different verticals.

Sign up for I/O Fund's free newsletter with gains of up to 403% – Click hereSign up for I/O Fund's free newsletter with gains of up to 403% – Click hereClick here

Top Ad-Tech stocks with the highest revenue growth estimate for Q3

Chart: Top Ad-Tech stocks with the highest revenue growth estimate for Q3

Source: YCharts

The Ad-Tech stocks are expected to show strong growth rates in Q3. IAC leads the sector, with the analysts’ expecting its revenue to grow 44%, followed by FuboTV, which is expected to grow 37%, and DoubleVerify is expected to grow 32%. Advertisement measurement and analytics company DoubleVerify shares got listed in April 2021. The company’s revenue in Q2 grew by 43% YoY to $109.8 million. The company’s CEO, Mark Zagorski, said, “We delivered an outstanding second quarter and surpassed our expectations for growth and profitability fueled by record Activation revenue and continued momentum on Social and CTV platforms,” The company also raised the full-year revenue guidance from a 33% YoY growth to 35% YoY growth of $449 million at the mid-point of the guidance.

Top Ad-Tech stocks with the highest revenue growth estimate for Q4

Chart: Top Ad-Tech stocks with the highest revenue growth estimate for Q4

Source: Seeking Alpha

The Trade Desk leads the sector with the strongest expected revenue growth rates for Q4. The company’s revenue in the recent quarter grew by 35% YoY to $377 million and beat analysts’ revenue estimates by 3%. Truist analyst Youssef Squali, said in a note to the clients. "Strength in [connected TV] and record new client relationships drove this performance, which is likely sustainable in [second-half 2022] given 100% Solimar adoption, continued momentum in CTV, in shopper [marketing] and in international, with the additional kicker of political spend around the midterms."

Top Ad-Tech stocks with the highest revenue growth estimate for the current fiscal year

Charts: Top Ad-Tech stocks with the highest revenue growth estimate for the current fiscal year

Source: YCharts

For the current fiscal year, analysts expect FuboTV to have the highest revenue growth estimate among ad-tech stocks. It is followed by IAC, which analysts expect to grow by 49%, and DoubleVerify is expected to grow by 35%.

Sign up for I/O Fund's free newsletter with gains of up to 403% – Click hereSign up for I/O Fund's free newsletter with gains of up to 403% – Click hereClick here

Ad-Tech Stocks based on forward P/S ratio

Chart: AD-Tech Stocks based on forward PS ratio

Source: YCharts

Ad-tech stocks are trading at a very low valuation. We can see from the above chart that the majority of the ad-tech stocks are trading at a forward P/S ratio of below 5.

The P/S ratio chart below shows how Meta Platforms and Netflix are trading at a discount compared to the past five-year period. Companies like Netflix lost cash in 2019 when the company was building the original content pipeline. Now, the management is guiding for free cash flow of $1 billion this year and ‘substantial’ free cash flow in 2023.

P/S ratio chart of Meta Platforms and Netflix

Source: YCharts

Top ranked Ad-Tech stocks based on Free Cash Flow Margin

Chart: Top ranked Ad-Tech stocks based on Free Cash Flow Margin

Source: YCharts

Magnite leads the ad-tech sector with the highest free cash flow margin of 27%. It is followed by The Trade Desk, which has a free cash flow margin of 23% and DoubleVerify has 18%.

Top ranked Ad-Tech stocks based on Net Profit Margin

Chart: Top ranked Ad-Tech stocks based on Net Profit Margin

Source: YCharts

Meta Platforms leads the ad-tech sector with the highest net profit margin. The company’s revenue declined for the first time in Q2. Revenue fell by 1% YoY to $28.8 billion. The company is looking to reduce its expenses due to the revenue slowdown to maintain strong margins. For the full year, it expects total expenses of $85 billion to $88 billion, down from the last quarter’s guidance of $87 billion to $92 billion and the prior estimate of $90 billion to $95 billion.

Royston Roche, Equity Analyst at the I/O Fund, contributed to this article.

Please note: The I/O Fund conducts research and draws conclusions for the Fund’s positions. We then share that information with our readers. This is not a guarantee of a stock’s performance. Please consult your personal financial advisor before buying any stock in the companies mentioned in this analysis.

Posted in Ctv, Digital Ads, Social Media, Tech StocksLeave a Comment on Top Ad-Tech Stocks: Q3 2022 Sector Overview

Moving Magnite Over to Netflix for CTV Ads

Posted on August 11, 2022June 30, 2026 by io-fund

What stood out to me from both The Trade Desk and Magnite’s calls was the emphasis placed on Netflix entering the market.

“If I could actually pick up at the end of where Laura's question was on CTV, and you kind of touched on this, the idea that between Netflix, Disney, HBO, Warner coming together, we're going to see a lot of ad-supported content coming into inventory and this next year here.”

“Yes, hey Matt. Great question. And to be played out, but our sense in talking to the big buyers is when there were rumors of the Netflix perhaps coming online this year they purposefully left money out of the up fronts into the spot market to have optionality.” – CEO Of Magnite“Yes, hey Matt. Great question. And to be played out, but our sense in talking to the big buyers is when there were rumors of the Netflix perhaps coming online this year they purposefully left money out of the up fronts into the spot market to have optionality.” – CEO Of Magnite

To me, this means buyers are excited and already planning to allocate to Netflix and didn’t want to tie up their budgets in the upfront season for this reason.

“I also want to talk about Netflix recent moves. I believe they are in a very strong position to be a leader in AVOD and hybrid pricing models, similar to how they led the way for more than a decade in SVOD.” – CEO of The Trade Desk

The Trade Desk’s CEO, Jeff Green, spent a good deal of time talking about Netflix.

There’s risk that Netflix will have a subscriber miss in the near term –Q3 specifically since more time will be spent indoors in Q4 so less risk here. Yet, there is considerably less risk than usual that Netflix will be able to accelerate revenue next year in 2023.

Surprisingly enough, both stocks are down 50% (more or less) YTD and so there is no penalty by moving this position to Netflix. It’s rare to get a juggernaut on sale, and even rarer to have a juggernaut outline a clear path to accelerate revenue over the next 12 months.

We are strong believers in the connected TV trend — and the trend is painfully early right now. Eventually, all traditional broadcast and cable will be phased out and about 1-3 years after this we will have a mature market. Magnite is not a CTV pureplay right now and we prefer to allocate to those that are.

Magnite’s CTV ad revenue growth is not an issue yet other segments weigh on this company, such as DV+ (desktop video) and mobile. The company will see some tailwinds from political ad spend in Q3, but overall, the revenue mix is weighed by underperforming segments.

We prefer to move this over to Netflix soon given the company’s discount in price.

Closing Magnite:

All numbers are stated in ex-TAC, which means revenue minus acquisition costs.

The chances are high that Magnite provided a conservate guide and will have a sizable beat next quarter. Political campaign spend is expected to exceed 2020’s ad spend levels and Magnite will see tailwinds here.

In the current quarter, Magnite reported 23% YoY growth for revenue of $123.3 million, or up 7% on a proforma basis. Out of an abundance of caution, Magnite guided for flat sequential growth from $123 million ex-TAC in the current quarter to $124 million, at the midpoint, for next quarter.

CTV revenue continues to be strong as a result of the SpotX acquisition. The segment was up 52% year-over-year, or 19% on a proforma basis, for revenue of $52.1 million. In the year ago quarter, the company reported revenue of $34 million. Last year’s comp includes two months of the SpotX acquisition.

The company is guiding for similar revenue next quarter of $53 million at the midpoint. This will be up from $43 million in the year ago quarter. You can see the conservatism here as some political spend will show up in September as the guide implies growth of 23%.

Magnite’s bottom line fluctuates on a GAAP basis due to the amortization of intangible assets from acquisitions. This expense totals $72 million this year and will total $104 million next year. Stock based compensation increased from $16 million to $38 million.

GAAP EPS was ($0.19) and adjusted EPS was $0.14. The company has an adjusted EBITDA margin of 34%. The company has operating cash flow of $30 million and the company has stated their free cash flow for 2022 will be $100 million. The company’s net leverage has improved from 6X to 2.9X with cash of $230 million on the balance sheet and debt of $723 million.

Mobile reported modest growth of 13% with revenue of $44 million compared to $38.8 million in the year ago quarter.

The CTV segment is not an issue but the desktop segment continues to weigh on the company. It was flat year-over-year with $27.2 million this quarter compared to $27.4 million in the previous quarter. You could argue they are seeing the same headwinds as many media properties right now. However, the desktop ad ecosystem also has to overcome Google’s plans to remove cookies on the Chrome browser and the risk here is not present in CTV pure plays.

Perhaps anti-trust measures will prevent Google from moving forward, but Apple certainly was allowed to move forward as the real estate owner, and hoping for a favorable anti-trust outcome is not a risk we care to take on. The reason the deprecation of cookies has been pushed out is not for altruistic reasons by any means, it’s so that Google’s Privacy Sandbox can be tested and roll-out as a stronger product.

It’s true this is delayed until 2024 now but given this segment already weighs on Magnite and we have other CTV pure plays down a similar amount this year (50%-ish), we think it’s prudent to take advantage of the discounts now rather than time this later.

We started our position in Google around the market lows in May and we are now starting a position in Netflix so that we can build with defensible land owners. As stated, it’s rare to get juggernauts on sale. Perhaps they don’t provide the AH pops that high growth does, but the downside is limited and we have clear catalysts (potentially massive catalysts) on the horizon.

Netflix’s announcement to partner with Microsoft confirms our understanding of the value of first-party data as Netflix chose its partner based on Microsoft’s ability to protect its data. As AI/ML builds out, data will move from being the oil of the world to being scarce as diamonds. I believe all of the moves you’re seeing from Apple, Google and Netflix’s choice with Microsoft is to prepare for consumer-driven AI dominance and to protect their large and valuable data sets.

Netflix resources:

October 15th Update: Netflix
Netflix Stock Stronger Than It Seems Following Q2 Earnings
Netflix Stock Could Rally With Ad-Supported Content
The Crucial Difference Between Roku and Netflix
Netflix: Coronavirus Cements The Company as Untouchable
Netflix Stock: Unshakeable Long Term
Why no streaming company will be able to dethrone Netflix

Magnite resources:

Roku, Magnite and Vuzix: Earnings Reviews
LTBH Webinar: Magnite, Roku and IDFA
Earnings Update: TWLO, DDOG, MGNI and ROKU
Video Interviews and Update on Q4 Stocks: MGNI, FUBO, LAZR, QCOM, DT, BABA
Magnite: CTV Ads and Publisher First-Party Data

Posted in Ctv, Digital Ads, Tech StocksLeave a Comment on Moving Magnite Over to Netflix for CTV Ads

Ad Tech Stock Valuations Historically Low – Q3 2022 Earnings

Posted on July 26, 2022June 30, 2026 by io-fund
Ad Tech Stock Valuations Historically Low – Q3 2022 Earnings

Last week, the team of I/O Fund analysts kicked off Q3’s earning season with a member-only webinar to discuss how they will position their portfolio for Q3 2022 and beyond. In this clip from the premium webinar, Beth Kindig examines ad tech stock valuations and answers important questions for investors searching for ad tech growth opportunities. Watch the clip to find out the answer to three important ad valuation questions:

3 Questions Beth Kindig Answers in this video:

Beth Kindig looks back at Facebook ($META), the ultimate ad-tech stock between 2012-2018, to answer the following questions:

  1. What valuations do ad tech stocks usually trade at?
  2. Are ad tech stocks cash-efficient?
  3. What is a reasonable valuation for ad-tech stocks right now and how much upside room do ad-tech stocks have?

The unanswered question: When will ad-tech rebound?

Subscribe for Premium to learn when ad tech stocks will start to rebound. Find out what quarters the I/O Fund predicts these stocks will move again!

Sign Up Here

Get More Free Stock Analysis from Beth Kindig

Beth Kindig is known to identify the biggest investible trends in technology including advertising and media. Subscribe to her free stock analysis newsletter with gains of up to 403%.

About I/O Fund Premium

If you're a serious investor, looking for a performance-oriented tech portfolio, join I/O Fund as a Premium Memberjoin I/O Fund as a Premium Member.

  • Premium Library of institutional-level research and analysis
  • Weekly webinars
  • NEW! Automated Hedge
  • Technical Analysis on Stocks and Broad Markets
  • Community Forum
  • Completely Transparent Portfolio
  • BONUS! Trade Alerts are sent directly to your phone via SMS and email

Sign Up Here


About Beth Kindig

Beth has ten years of experience in competitive analysis and product analysis in the tech industry dating back to 2011. Considering tech growth stocks took off after the financial crisis, she is an experienced professional in every sense of the word. Her tech conference appearances date back to 2014 and her analysis began garnering press in the same year. She is known for making bold calls on tech stocks and offers a weekly free analysis that leverages her ten years of experience in the private markets. It is not only the big gains she has achieved with individual stocks but also the quality and consistency of her analysis.

Disclaimers:

I/O Fund blends fundamental and technical analysis to help retail investors get the best out of growth tech stocks. I/O Funds research does not qualify as financial advice, please consult your financial advisor.

Posted in Ctv, Digital Ads, Social Media, Tech StocksLeave a Comment on Ad Tech Stock Valuations Historically Low – Q3 2022 Earnings

Magnite Update and Q4 Earnings

Posted on March 21, 2022June 30, 2026 by io-fund

Magnite Intro:

Magnite offers an opportunity to have exposure to a higher mix of CTV ads from an independent SSP than what is currently on the market. What is most interesting about Magnite as of late is the company’s programmatic strategy for Live TV and also programmatic SSP products for bids on CTV ad inventory. We discuss this more below.

Similar to Roku, The Trade Desk, PubMatic and other ad-tech companies, Magnite faces the double whammy of enduring eight quarters of high Covid comps at a time when macro headwinds are affecting the ad industry. Magnite has even more whammies, which is being a small cap during a historic small cap selloff, and having financials that are tough to analyze due to a string of acquisitions/mergers.

Bradley wrote about the financials in the Q2 earnings write-up: “While the SpotX acquisition positions the company to succeed in the CTV ad market, it also unfortunately complicates MGNI’s accounting. For example, SpotX recognizes sales on a gross basis, while MGNI had previously recognized most of its sales on a net basis (net of TAC). As a result, the company has reported an adjusted pro-forma growth rate to help investors better gauge MGNI true topline growth rate.

Moreover, since SpotX recognizes sales on a gross basis, this can artificially dampen MGNI’s reported gross margins, as the topline is inflated while gross profit remains static. As well, accounts receivables are accrued on a gross basis, which makes MGNI receivables balance appear severely outsized relative to sales. A ballooning receivables balance can signal that a company is pulling forward sales, which is a negative trend and something investors tend to avoid. We suspect that MGNI’s complex accounting is having a temporary negative impact on MGNI share price, due to a subdued gross margin and an inflated receivables balance. However, these concerns will likely dissipate as MGNI’s results start to annualize and the Street gains a better understanding of MGNI’s future growth prospects. At the moment, the Street is dependent on management’s adjusted, pro-forma metrics.”

To illustrate that SpotX was a merger and not really an acquisition, consider that Magnite paid $1.2 billion for the company meanwhile Magnite reported $221 million in revenue in 2020, around the time the acquisition was announced. This acquisition combined two CTV players to create scale and efficiencies. Magnite has stated the company expects to realize $35 million in annualized cost savings from its mergers and acquisitions: "We expect some of those increases to be offset by cost saving activities that began in the second quarter of 2021 and continue to be in process. We are targeting in excess of $35 million in run-rate operating cost synergies over a two year period. As of December 31, 2021, we have achieved more than half of our cost synergy target on a run-rate basis.” However, Magnite also reported $20 million in interest and so the high debt levels are technically a risk.

We see softer growth in Q4 compared to Q3 but it would be tough to say this is reflective of the company. The next few guides on Q2 and Q3 are more important for Magnite than what we’ve seen during the winter months. This is because ad spend is expected to rebound in H2 and by Q3 the company will be fully past the one-year mark for the SpotX acquisition (which was almost more of a merger), which will help normalize the year-over-year comparisons.

On the earnings call, management discussed a product that can help differentiate Magnite, which is Live Stream Acceleration (LSA). The product was announced in February and has been tested with Sling by serving programmatic ads for five weeks to help increase fill rates. Live sports are expected to account for 22% of ad spend and this product helps publishers deal with large spikes in traffic, sporadic time-outs or play reviews by referees by lowering the throttle and increasing fill. LSA helped Sling see a 47% lift in ad conversions during the trial period by filling ad slots that would have normally timed out.

The company also launched BidLink to help publishers improve ad rates and yield by creating a real-time auction. The programmatic features of link to 22 SSPs to increase bids regardless of what ad server publishers use. This is key because Magnite is going to full leverage the Telaria and SpotX acquisitions to potentially help drive publishers to its platform. By using CTV as the anchor, Magnite can expand its footprint and leverage its positioning as the largest independent SSP by being full-featured and competitive in its product R&D. We’ve seen a slew of announcements on Magnite being chosen as a preferred SSP and/or omnichannel partnerships, including from Fubo/Molotov, Samsung Ads, Plex, CH Media and GroupM.

That is a lot of product and partnership movement for a small cap with a seasoned management team although currently the forward revenue guide isn’t reflecting this with “more than 20% revenue growth this year” (see below). I think it’s clear to see Magnite is not a momentum play for us in terms of top line growth, rather it’s a strong choice for those who think CTV ads are going to rip over the next few years (I am in this group).

We also covered private marketplaces in the past and why CTV inventory is unique in terms of how many SSPs a publisher will work with. These newer products help differentiate the private marketplace deals and also any upfront contracts that Magnite might see with more tools for Live TV publishers. Essentially, private marketplace inventory is more premium and this helps edge a (marginal) defense for Magnite against other independent ad-tech companies. Magnite must still compete against heavyweights like FreeWheel and Roku, especially for upfront contracts, yet medium-sized publishers who see working with these two as cannibalistic will likely prefer Magnite.

On the call, the company discussed The Trade Desk’s OpenPath product which is attempting to pull more direct publishers to the DSP. The announcement came with a list of media companies that plan to utilize OpenPath, such as The New York Times, Conde Nast, etcetera. This does not prevent those media companies from also working with a SSP to procure higher bids and so TTD will need to be competitive with SSPs in order for this to succeed. Magnite argues in the earnings call it may not drive higher ad rates for publishers who will prefer to stay with a SSP because the tools are more optimized for publishers.

“In the end, most publishers find it insufficient to rely solely on a direct connection versus the breadth and depth of what a full-featured SSP like Magnite offers. I'm not just talking about capabilities like yield management, inventory curation, ad quality tools, billing and reconciliation or access to seasoned monetization experts, though, all of that is critical. Magnite also facilitates demand for publishers across all formats, in many cases, directly from brands and agencies.”

The company is stating it may be more advantageous in the long run if advertisers to go direct to SSPs: “For select publishers that want a direct connection to buyers, the approach can be additive to the unified auction, potentially lifting of publishers revenue. Demand Manager, our header bidding software based on prebid, makes it easy for publishers to activate direct connections to buyers such as the Trade Desk.”

The management also stated The Trade Desk moving away from Google’s Open Bid was a slight tailwind for them: “But I'm also going to move outside that action with a direct connection and compete against those auctions, sometimes compete against ourselves. And a publisher's way of thinking is that could just be increased bid density and it could lift yield. And so therefore, the only reason why I wouldn't want to do it is if Trade Desk came in and said, "I don't want to participate in a unified auction. I want to be put as a tag in the server, and I want to be first look on everything and then everyone else gets to look at everything." That's the world of nonheader-bidding that used to exist in the SSP world.

And so publishers have spoken. They want it as part of a unified process. Interestingly enough, a lot of publishers, as you know, through our Demand Manager product don't have the wherewithal to even manage a unified auction in prebid. And so in — weird way economically Trade Desk moving outside of moving as another source of demand in the head helps us economically from Demand Manager, because, as you know, we get paid on every successful auction, whether it's a Magnite auction or not. And so if it's more demand inside the header and it's going through Demand Manager, it actually — it works out well for us.And so in — weird way economically Trade Desk moving outside of moving as another source of demand in the head helps us economically from Demand Manager, because, as you know, we get paid on every successful auction, whether it's a Magnite auction or not. And so if it's more demand inside the header and it's going through Demand Manager, it actually — it works out well for us.

Typically, if publishers go direct to the demand side successfully, it’s because the DSP has some kind of rich first-party data that the publishers can gain from (Facebook/Audience Network, Google/AdMob). I’m not sure The Trade Desk has enough leverage in terms of data for this strategy to successfully recruit publishers in terms of offering an advantage on higher ad rates for publishers, but let’s see/monitor this. Instead, it could be a defensive move from The Trade Desk in terms of third-party data becoming weaker. I suspect Google is not going to work with Universal Ad ID 2.0 as there is little incentive to invite a new ID after getting rid of cookies. My educated guess is Google will want to protect their properties. I’ll try to write more about Google’s changes on Android as it unfolds in a separate analysis.

You’ve probably heard the term walled garden. Well, we are now going to have fortified stone walled gardens in terms of Google protecting their properties and data and not allowing cookies/IDs. Apple is doing the same. This is under the guise of privacy but given that Google sells fire alarms that spy on people in their personal residence, I doubt ethics or privacy is driving the decision.

Regardless of what Big Tech’s motivation is, I believe there is alpha in some of our ad-tech stocks because this shift is so little understood. The reason Snap and Facebook’s earnings were important for us is that it provided a nod that we are on the right track – as the publisher (Snap) is guiding strong while the third-party data exchange (Facebook) is expecting top line erosion in ads. Given the opaque backdrop on macro/supply chain, this at least provided a glimpse of the longer-term picture, which should become clearer when macro/supply chain clears up. I think I’ve been pretty clear that my money is on first-party data and on the publisher/supply side. I do want to emphasize that I don’t expect the first-party data thesis to materialize overnight, the shift will be gradual. However, despite the shift being gradual, I believe it will be permanent and that’s most important to us investors in terms of a material change to the advertising industry.

Review of Q4 Earnings Report

By Bradley Cipriano

Magnite reported revenue of $142.1 million for proforma growth of 10% and revenue ex-TAC growth of 76%. CTV revenue growth continues to be a strength, up 23% proforma and up 252% on an ex-Tac basis to $54 million.

The adjusted EBITDA was $68 million during the quarter, or 48% of ex-TAC revenues, which was an improvement from the 37% EBITDA margin in the year-ago quarter, driven by the SpotX acquisition and organic growth. This led to EPS of $0.26 in Q4 and operating cash flow of $60 million.

In 2021, Magnite reported total revenue of $416 million. CTV revenue grew 52% on a proforma basis and accounted for roughly 40% of revenue. Magnite stated they reach 80 million households every month (similar to Roku) and they estimate this to be 20% market share. The company’s mobile revenue was low at 6% growth and desktop was very thin at 1% growth.

The company is guiding for ex-TAC revenue of “well above $500 million” for 2022, or at least 20% growth. The first quarter ex-TAC revenue is expected to be $107.5 million, at the midpoint. The company expects CTV revenue growth to be similar to Q4 although a lower amount at $41 million due to the seasonality of Q1. Management stated that Q1 adjusted EBITDA margin will be in the low 20s on a percentage basis primarily due to the timing of annual raises, which were pulled forward from April to January, general increase in wages to improve retention and increased costs related to returning to the office. As a result, the path to 35% to 40% adjusted EBITDA margins has been extended, but management nonetheless reiterated the guide. CFO David Day stated during the Q4 call that “we don't see any changes in the long-term trajectory to our 35% to 40% [adjusted EBITDA] margin targets”.

The company’s current mix is 38% CTV / 36% mobile / 26% desktop. This is up from a mix of 19% CTV exposure in Q4 2020, highlighting the rapid repositioning Magnite has made in one year.

Adjusted EBITDA margin for the year was 35.7% with adjusted EPS of $0.55. The company has $230 million in cash and $720 million in long-term debt, or about $500 million in net debt. With $148 million in annual adjusted EBITDA, Magnite’s net leverage ratio is 3.3x as of Q4, down from 4.1x as of Q2 2021 and management explained on the Q4 call that they aim to reduce their leverage to 2x over time. The company’s strong cash flows will help reduce debt, and Magnite guided that its free cash flow (defined by the company as Adj. EBITDA less capex less intertest expense) will be over $100 million during the year, and will grow faster than adjusted EBITDA over time. The company is currently in compliance with its debt covenants as well.

Additional Reading:

Magnite: CTV Ads and First-Party Publisher Data
LTBH Webinar: Magnite and Roku
Q3 2021 Earnings: Roku and Magnite
Roku, Magnite and Vuzix: Earnings Reviews

Posted in Ctv, Digital Ads, Tech StocksLeave a Comment on Magnite Update and Q4 Earnings

Magnite Update and Q4 Earnings

Posted on March 21, 2022June 30, 2026 by io-fund

Magnite Intro:

Magnite offers an opportunity to have exposure to a higher mix of CTV ads from an independent SSP than what is currently on the market. What is most interesting about Magnite as of late is the company’s programmatic strategy for Live TV and also programmatic SSP products for bids on CTV ad inventory. We discuss this more below.

Similar to Roku, The Trade Desk, PubMatic and other ad-tech companies, Magnite faces the double whammy of enduring eight quarters of high Covid comps at a time when macro headwinds are affecting the ad industry. Magnite has even more whammies, which is being a small cap during a historic small cap selloff, and having financials that are tough to analyze due to a string of acquisitions/mergers.

Bradley wrote about the financials in the Q2 earnings write-up: “While the SpotX acquisition positions the company to succeed in the CTV ad market, it also unfortunately complicates MGNI’s accounting. For example, SpotX recognizes sales on a gross basis, while MGNI had previously recognized most of its sales on a net basis (net of TAC). As a result, the company has reported an adjusted pro-forma growth rate to help investors better gauge MGNI true topline growth rate.

Moreover, since SpotX recognizes sales on a gross basis, this can artificially dampen MGNI’s reported gross margins, as the topline is inflated while gross profit remains static. As well, accounts receivables are accrued on a gross basis, which makes MGNI receivables balance appear severely outsized relative to sales. A ballooning receivables balance can signal that a company is pulling forward sales, which is a negative trend and something investors tend to avoid. We suspect that MGNI’s complex accounting is having a temporary negative impact on MGNI share price, due to a subdued gross margin and an inflated receivables balance. However, these concerns will likely dissipate as MGNI’s results start to annualize and the Street gains a better understanding of MGNI’s future growth prospects. At the moment, the Street is dependent on management’s adjusted, pro-forma metrics.”

To illustrate that SpotX was a merger and not really an acquisition, consider that Magnite paid $1.2 billion for the company meanwhile Magnite reported $221 million in revenue in 2020, around the time the acquisition was announced. This acquisition combined two CTV players to create scale and efficiencies. Magnite has stated the company expects to realize $35 million in annualized cost savings from its mergers and acquisitions: "We expect some of those increases to be offset by cost saving activities that began in the second quarter of 2021 and continue to be in process. We are targeting in excess of $35 million in run-rate operating cost synergies over a two year period. As of December 31, 2021, we have achieved more than half of our cost synergy target on a run-rate basis.” However, Magnite also reported $20 million in interest and so the high debt levels are technically a risk.

We see softer growth in Q4 compared to Q3 but it would be tough to say this is reflective of the company. The next few guides on Q2 and Q3 are more important for Magnite than what we’ve seen during the winter months. This is because ad spend is expected to rebound in H2 and by Q3 the company will be fully past the one-year mark for the SpotX acquisition (which was almost more of a merger), which will help normalize the year-over-year comparisons.

On the earnings call, management discussed a product that can help differentiate Magnite, which is Live Stream Acceleration (LSA). The product was announced in February and has been tested with Sling by serving programmatic ads for five weeks to help increase fill rates. Live sports are expected to account for 22% of ad spend and this product helps publishers deal with large spikes in traffic, sporadic time-outs or play reviews by referees by lowering the throttle and increasing fill. LSA helped Sling see a 47% lift in ad conversions during the trial period by filling ad slots that would have normally timed out.

The company also launched BidLink to help publishers improve ad rates and yield by creating a real-time auction. The programmatic features of link to 22 SSPs to increase bids regardless of what ad server publishers use. This is key because Magnite is going to full leverage the Telaria and SpotX acquisitions to potentially help drive publishers to its platform. By using CTV as the anchor, Magnite can expand its footprint and leverage its positioning as the largest independent SSP by being full-featured and competitive in its product R&D. We’ve seen a slew of announcements on Magnite being chosen as a preferred SSP and/or omnichannel partnerships, including from Fubo/Molotov, Samsung Ads, Plex, CH Media and GroupM.

That is a lot of product and partnership movement for a small cap with a seasoned management team although currently the forward revenue guide isn’t reflecting this with “more than 20% revenue growth this year” (see below). I think it’s clear to see Magnite is not a momentum play for us in terms of top line growth, rather it’s a strong choice for those who think CTV ads are going to rip over the next few years (I am in this group).

We also covered private marketplaces in the past and why CTV inventory is unique in terms of how many SSPs a publisher will work with. These newer products help differentiate the private marketplace deals and also any upfront contracts that Magnite might see with more tools for Live TV publishers. Essentially, private marketplace inventory is more premium and this helps edge a (marginal) defense for Magnite against other independent ad-tech companies. Magnite must still compete against heavyweights like FreeWheel and Roku, especially for upfront contracts, yet medium-sized publishers who see working with these two as cannibalistic will likely prefer Magnite.

On the call, the company discussed The Trade Desk’s OpenPath product which is attempting to pull more direct publishers to the DSP. The announcement came with a list of media companies that plan to utilize OpenPath, such as The New York Times, Conde Nast, etcetera. This does not prevent those media companies from also working with a SSP to procure higher bids and so TTD will need to be competitive with SSPs in order for this to succeed. Magnite argues in the earnings call it may not drive higher ad rates for publishers who will prefer to stay with a SSP because the tools are more optimized for publishers.

“In the end, most publishers find it insufficient to rely solely on a direct connection versus the breadth and depth of what a full-featured SSP like Magnite offers. I'm not just talking about capabilities like yield management, inventory curation, ad quality tools, billing and reconciliation or access to seasoned monetization experts, though, all of that is critical. Magnite also facilitates demand for publishers across all formats, in many cases, directly from brands and agencies.”

The company is stating it may be more advantageous in the long run if advertisers to go direct to SSPs: “For select publishers that want a direct connection to buyers, the approach can be additive to the unified auction, potentially lifting of publishers revenue. Demand Manager, our header bidding software based on prebid, makes it easy for publishers to activate direct connections to buyers such as the Trade Desk.”

The management also stated The Trade Desk moving away from Google’s Open Bid was a slight tailwind for them: “But I'm also going to move outside that action with a direct connection and compete against those auctions, sometimes compete against ourselves. And a publisher's way of thinking is that could just be increased bid density and it could lift yield. And so therefore, the only reason why I wouldn't want to do it is if Trade Desk came in and said, "I don't want to participate in a unified auction. I want to be put as a tag in the server, and I want to be first look on everything and then everyone else gets to look at everything." That's the world of nonheader-bidding that used to exist in the SSP world.

And so publishers have spoken. They want it as part of a unified process. Interestingly enough, a lot of publishers, as you know, through our Demand Manager product don't have the wherewithal to even manage a unified auction in prebid. And so in — weird way economically Trade Desk moving outside of moving as another source of demand in the head helps us economically from Demand Manager, because, as you know, we get paid on every successful auction, whether it's a Magnite auction or not. And so if it's more demand inside the header and it's going through Demand Manager, it actually — it works out well for us.And so in — weird way economically Trade Desk moving outside of moving as another source of demand in the head helps us economically from Demand Manager, because, as you know, we get paid on every successful auction, whether it's a Magnite auction or not. And so if it's more demand inside the header and it's going through Demand Manager, it actually — it works out well for us.

Typically, if publishers go direct to the demand side successfully, it’s because the DSP has some kind of rich first-party data that the publishers can gain from (Facebook/Audience Network, Google/AdMob). I’m not sure The Trade Desk has enough leverage in terms of data for this strategy to successfully recruit publishers in terms of offering an advantage on higher ad rates for publishers, but let’s see/monitor this. Instead, it could be a defensive move from The Trade Desk in terms of third-party data becoming weaker. I suspect Google is not going to work with Universal Ad ID 2.0 as there is little incentive to invite a new ID after getting rid of cookies. My educated guess is Google will want to protect their properties. I’ll try to write more about Google’s changes on Android as it unfolds in a separate analysis.

You’ve probably heard the term walled garden. Well, we are now going to have fortified stone walled gardens in terms of Google protecting their properties and data and not allowing cookies/IDs. Apple is doing the same. This is under the guise of privacy but given that Google sells fire alarms that spy on people in their personal residence, I doubt ethics or privacy is driving the decision.

Regardless of what Big Tech’s motivation is, I believe there is alpha in some of our ad-tech stocks because this shift is so little understood. The reason Snap and Facebook’s earnings were important for us is that it provided a nod that we are on the right track – as the publisher (Snap) is guiding strong while the third-party data exchange (Facebook) is expecting top line erosion in ads. Given the opaque backdrop on macro/supply chain, this at least provided a glimpse of the longer-term picture, which should become clearer when macro/supply chain clears up. I think I’ve been pretty clear that my money is on first-party data and on the publisher/supply side. I do want to emphasize that I don’t expect the first-party data thesis to materialize overnight, the shift will be gradual. However, despite the shift being gradual, I believe it will be permanent and that’s most important to us investors in terms of a material change to the advertising industry.

Review of Q4 Earnings Report

By Bradley Cipriano

Magnite reported revenue of $142.1 million for proforma growth of 10% and revenue ex-TAC growth of 76%. CTV revenue growth continues to be a strength, up 23% proforma and up 252% on an ex-Tac basis to $54 million.

The adjusted EBITDA was $68 million during the quarter, or 48% of ex-TAC revenues, which was an improvement from the 37% EBITDA margin in the year-ago quarter, driven by the SpotX acquisition and organic growth. This led to EPS of $0.26 in Q4 and operating cash flow of $60 million.

In 2021, Magnite reported total revenue of $416 million. CTV revenue grew 52% on a proforma basis and accounted for roughly 40% of revenue. Magnite stated they reach 80 million households every month (similar to Roku) and they estimate this to be 20% market share. The company’s mobile revenue was low at 6% growth and desktop was very thin at 1% growth.

The company is guiding for ex-TAC revenue of “well above $500 million” for 2022, or at least 20% growth. The first quarter ex-TAC revenue is expected to be $107.5 million, at the midpoint. The company expects CTV revenue growth to be similar to Q4 although a lower amount at $41 million due to the seasonality of Q1. Management stated that Q1 adjusted EBITDA margin will be in the low 20s on a percentage basis primarily due to the timing of annual raises, which were pulled forward from April to January, general increase in wages to improve retention and increased costs related to returning to the office. As a result, the path to 35% to 40% adjusted EBITDA margins has been extended, but management nonetheless reiterated the guide. CFO David Day stated during the Q4 call that “we don't see any changes in the long-term trajectory to our 35% to 40% [adjusted EBITDA] margin targets”.

The company’s current mix is 38% CTV / 36% mobile / 26% desktop. This is up from a mix of 19% CTV exposure in Q4 2020, highlighting the rapid repositioning Magnite has made in one year.

Adjusted EBITDA margin for the year was 35.7% with adjusted EPS of $0.55. The company has $230 million in cash and $720 million in long-term debt, or about $500 million in net debt. With $148 million in annual adjusted EBITDA, Magnite’s net leverage ratio is 3.3x as of Q4, down from 4.1x as of Q2 2021 and management explained on the Q4 call that they aim to reduce their leverage to 2x over time. The company’s strong cash flows will help reduce debt, and Magnite guided that its free cash flow (defined by the company as Adj. EBITDA less capex less intertest expense) will be over $100 million during the year, and will grow faster than adjusted EBITDA over time. The company is currently in compliance with its debt covenants as well.

Additional Reading:

Magnite: CTV Ads and First-Party Publisher Data
LTBH Webinar: Magnite and Roku
Q3 2021 Earnings: Roku and Magnite
Roku, Magnite and Vuzix: Earnings Reviews

Posted in Ctv, Digital Ads, Tech StocksLeave a Comment on Magnite Update and Q4 Earnings

Magnite and FuboTV: Premium Analysis Update

Posted on April 21, 2021June 30, 2026 by io-fund

The market has been especially tough on these two names and so I want to take the opportunity to go back over our conviction and to cover any risks.

You can find my past analysis on these companies here:

·         Magnite Premium Blog: Connected TV Ads SSP

·         Magnite Update: CTV Ads and Publisher First-Party Data

·         FuboTV Premium Blog: Overview

·         FuboTV Update for Premium Subs

·         FuboTV article on Forbes

As I write this, we haven’t gotten Snap’s earnings which will be followed by other ad-tech companies reporting next week. This will be our first glimpse into the rebound from the economy opening back up. My hunch is that both of these names (MGNI and FUBO) will see a boost from increased ad spend (as well as a few others we hold in the portfolio). There was an excellent post on the forum about the boom in advertising.

Magnite

When we look at the messy ad ecosystem, it's rare to find a management with this level of focus in capturing a specific market. The market that Magnite is focused on is the Connected TV programmatic and omnichannel supply-side market. That's a mouthful, and at first glance, it may sound like every other ad platform out there, but that’s why we look deeply at product to give our readers and the I/O Fund a competitive advantage. Nuances matter.

Magnite is not the shiniest company to analyze if you’re a financial analyst. The former company, Rubicon, struggled after the walled gardens of Facebook and Google were built, which led to total domination of digital advertising.

Prior to this, Rubicon was a well-known name in online programmatic. Still, it's understandable if more traditionally trained financial analysts saw the negative revenue growth between 2016-2017 and wonder how this management can stage a comeback.

Magnite’s CEO was the former CEO of Millennial Media, a company that took an incredibly hard hit when the walled gardens (Facebook, Google) leveraged their first-party data to compete with traditional ad-tech companies.

There are critics of the CEO’s background but we are neutral and don’t extract anything meaningful here as the fate of Millennial Media was out of the CEO’s control. Google and Facebook wiped out many ad-tech companies around 2014.

In early 2020, Rubicon acquired Telaria, and then the combined company, Magnite, faced a tough two-quarters due covid's shelter-in-place. We saw juggernauts like Google report negative revenue growth, which reflects the challenges all ad-tech faced. To complicate matters, Magnite is acquiring SpotX, which requires extra work for a financial analyst to piece together, and there is uncertainty with Apple’s IDFA changes.

My point here is that Magnite requires in-depth product analysis – and we can’t solely rely on the financials. I will touch on financials and future growth, but the main key points are hidden in the product and the unique advertising environment that is Connected TV. The stock has seen extreme volatility, as has Fubo, yet it's important to revisit why we have conviction so that market sentiment doesn’t push us to fold our hand.

What “Independent SSP” Really Means

My webinar on Twilio spelled out why PII and an omnichannel marketing platform could take some budget from data management platforms, which primarily deal with second-party and third-party data. In the presentation, I had discussed how Facebook and Google have the strongest positioning for DMPs because they also mix their own first-party data (anonymously).

First-party data is always owned by the publisher. Facebook and Google are publishers, which is why they have first-party data to mix at the DMP level. Magnite is on the publisher side of the transaction. This was less desirable with display where 10 or sometimes 25 SSPs would compete on an open programmatic marketplace for a $0.20 placement.

However, Connected TV inventory is unique as the inventory is premium and goes for $25 to $40 for placements on a private marketplace. This means that publishers will work with maybe one or two SSPs total as the private marketplace does not result in higher bids because the pricing is already agreed on.

When I talk about ad-tech, I repeatedly say there’s no such thing as a moat. It’s a convoluted space and even Facebook/Google are seeing their moat become challenged by Apple. The only moat is owning the audience. The other pieces are in a state of constant flux.

However, there are advantages that a company can have to gain market share – for Roku, this is the operating system and owning the whole stack. Roku owns the audience and there is an even bigger bonus to owning the stack as Roku has access to data at the device level from thousands of apps on the device and any publishers on its ad platform.

SSPs and DSPs especially come under pressure because they don’t own the audience. However, Magnite is leveraging a few key strengths, such as becoming the primary independent SSP in the Connected TV arena. On the earnings call, the management stated that it would be hard for other SSPs to compete at this point, given the unique private marketplace environment of Connected TV. This is due to Magnite’s acquisition strategy, and we see the effects of this in the Disney partnership, where Magnite is the obvious choice on the supply side.

“And as it relates to the ability for an SSP that has never done in CTV to jump in. I just put myself in their shoe before we bought Telaria, and we were going through that build by partner scenario, and it just dawned on us that the build scenario would cost a lot of money. You'd have to hire a lot of talent, and there's a lot of risk because the market is always moving. And by the time you build your first version, the market might be onto the fourth version.” – Magnite management on why they are likely to be unrivaled as the leading independent SSP” – Magnite management on why they are likely to be unrivaled as the leading independent SSP

Being the leading independent SSP on Connected TV may mean that Magnite will likely outpace all other SSPs; however, they still have Comcast's FreeWheel and Google to compete with. For the next 18 months at least, this is very doable because the company has Disney’s data and publisher segments to work with (more on Disney below).

Being the preferred partner for Disney on CTV inventory is a considerable head start for Magnite, while the company builds out the best software solutions for publishers. With the SpotX acquisition, Magnite now has 250 software engineers aimed at building the best product possible on the supply-side.

Google clearly is not the easiest company to compete with on engineering talent yet small and mid-size publishers are more likely to work with Magnite. Case in point, Magnite and SpotX work with the following list: Discovery, Disney/Hulu, Roku, Samsung, Sling TV, ViacomCBS, Vizio, WarnerMedia, A+E Networks, Crackle Plus, The CW Network, Electronic Arts, Fox Corp., fuboTV, Microsoft, Newsy, Philo TV, Pluto TV, Tubi, Vudu, and Xumo.

As stated, it’s not uncommon for a publisher to work with more than one SSP but the private marketplace greatly reduces the number of relationships a publisher has to the point where it’s inconsequential to work with multiple SSPs.

From the most recent earnings call:

“As I said before, on a previous question, I don't see this becoming an open market world. It will be private marketplace. And when you do private marketplace deals, you tend to do hundreds of deals and you create a deal library, and buyers get used to where this deal library sits. And they're generally not sprinkled around 10 SSP players. They're sprinkled around 1 or 2 because there's just no advantage to it. Because they're not open market, the pricing has already been agreed upon. You're just transacting through pipes. And so keeping the deal libraries with 1 or 2 players is what's occurring today and, I believe, is what you're going to see long term. So I don't see this evolving to 25 SSPs like you would see in the display world.” -Magnite management on why their positioning on CTV should not be compared to the SSP positioning on displayAnd they're generally not sprinkled around 10 SSP players. They're sprinkled around 1 or 2 because there's just no advantage to it. Because they're not open market, the pricing has already been agreed upon. You're just transacting through pipes. And so keeping the deal libraries with 1 or 2 players is what's occurring today and, I believe, is what you're going to see long term. So I don't see this evolving to 25 SSPs like you would see in the display world.” -Magnite management on why their positioning on CTV should not be compared to the SSP positioning on display

Software and Identifiers

Magnite is currently in beta on their proprietary CTV Unified Decisioning solution. This will help programmatic ad rates (CPMs or cost per one-thousand) exceed ad rates sold direct (CPMs). The software solution helps publishers drive higher yields by mixing direct and programmatic in the bidding process. This allows publishers to sell direct and programmatically in a hybrid format. Management indicated this won't be something that can be financially modeled this year as it's still in beta.

Comcast’s FreeWheel launched Unified Decisioning a year ago when the company decided to leverage its audience, create publisher segments and work with 20+ DSPs to cut SSPs out of the media buying process. This is Magnite’s primary competitor and notably Comcast owns the audience.

Regarding identifiers, Magnite packages first-party data as publisher segments and these are more insulated from Apple's mobile ID and tracking changes.

 Magnite and Adform measured monetization lift based on first-party identifiers, including environments that currently disallow third party cookies such as Firefox and Safari. Initial results from Q1 2021 showed significant lift, with overall eCPMs increasing more than 30%, compared with ad requests which did not contain first-party identifiers. A similar study also showed click-through rates on Safari impressions doubled, showing an increase in performance for buyers. including environments that currently disallow third party cookies such as Firefox and Safari. Initial results from Q1 2021 showed significant lift, with overall eCPMs increasing more than 30%, compared with ad requests which did not contain first-party identifiers. A similar study also showed click-through rates on Safari impressions doubled, showing an increase in performance for buyers.

SpotX Acquisition – Why It’s Important:

In February, Magnite agreed to buy SpotX for $1.7 billion for combined revenue of $350 million, of which 67% came from CTV and video advertising in the fourth quarter. Meanwhile, the merger results in $35 million in cost savings. Non-video business will comprise 33% of total revenue.

It’s easy to see the synergy with Magnite pursuing more CTV market share. Beyond the obvious OTT ad synergies, the two main strengths of the SpotX acquisition is omnichannel online video (OLV) and also SpotX’s global reach.

By offering CTV and OLV through one SSP, Magnite can gain strategic positioning as most advertisers will want to buy omnichannel inventory across multiple digital video formats. Roku with DataXu is also omnichannel and excels at Connected TV omnichannel advertising due to first-party data. The obvious question here is why not double down on Roku – especially since the company owns the audience? It is because I believe Magnite can move faster globally than Roku.

SpotX is the largest global supply-side platform. Last year, global ad spend on SpotX grew 42% and was driven by OTT, which accounted for 70% of ad spend. Business in EMEA and APAC grew 107% and 66% respectively. SpotX reaches 25 million CTV households in EMEA, or about half of all ad-supported CTV households.

SpotX’s biggest market currently is the United States as it’s also the most mature market. The supply-side platform reaches 70 million CTV households with a 40% increase in household reach since May 2020 and a 67% increase since December 2019.

Disney Partnership:

In March, Disney announced the Disney Real-Time Ad Exchange (DRAX) which follows the launch of Disney Hulu XP (DHXP) in January. This positions Disney as a bidding solution and leverages Disney’s data for audience targeting. Specifically, DRAX is for “programmatic buys and Disney Select for data-driven targeting,” which means Disney inventory will be more attractive due to the company leveraging its audience graph.

As investors, we have to look at both scenarios – best case and worst case. The best-case scenario is that Disney renews the partnership with Magnite after 18 months. The worst-case scenario is that Disney removes the need for a SSP and handles the auction themselves like Comcast Freewheel.

Right now, Magnite is a preferred partner on Disney inventory but not ESPN.

Disney, obviously, being a far-reaching media empire with many, many, many media formats, the exclusivity or the preferred partner lies around the cross-platform inventory. So if you were to buy inventory from the DXHP that Disney cross-platform sale, all of that goes through Magnite. all of that goes through Magnite.

And specifically, if you were to buy Hulu only and didn't buy any of the cross-platform inventory, that too would go through Magnite. You're capable of buying ESPN without going through Magnite, but conversely, Magnite is very capable of selling ESPN inventory, as well. So, we have access to all of it. Some of it's in a preferred partnership, others is in an open market partnership.

The case for Disney staying with Magnite on SSP:

Comcast FreeWheel will need to attract more publishers in order to scale. If Disney becomes a SSP, then they are limited to only their inventory (Hulu, ESPN, etc) or they must attract publishers to its ad platform. It would be better if Disney sold its segments on its inventory first and then across hundreds of thousands of applications second.

Secondly, Disney will need to do omnichannel, which is desirable as advertisers can reach customers across multiple digital formats and measure campaigns.I don’t see Disney launching (or acquiring) an omnichannel ad platform on the supply side to compete with Magnite but I could be wrong. (I must admit, I do wonder if Disney would acquire Magnite someday though).

If we look at the path that Facebook and Google took, it was not only to transact on their own inventory but they eventually took the place of the SSP and signed on many publishers to build a walled garden across mobile applications. These tech giants knocked out demand side platforms, as well, because the advertisers could go direct. Therefore, it’s not clear which side Disney would go after if they entered the ad-tech market. You could argue they’ll do what Comcast did or maybe they’ll encourage media buyers to go directly to Disney with Magnite’s omnichannel programmatic offering on the backend. Right now, Magnite is building a custom marketplace for Omnicom, for example.

The case for Disney not staying with Magnite as SSP:

I think it’s very (very) unlikely that Disney would work with another independent SSP on CTV ad inventory. As stated above, Magnite really is the best choice when it comes to an independent SSP and Disney’s nod with a preferred partnership supports this.

However, the other option is that Disney becomes the SSP like Comcast’s Freewheel. There is a 50/50 chance this happens after the 18 months is up. Nobody can tell you what will happen here.

As an investor in Magnite, I prefer to see what Magnite can do with Disney’s data and preferred partnership plus the recent SpotX acquisition before jumping to conclusions around the impact this might have. Meaning, Magnite should report solid earnings over the next 1.5 years and it’ll be hard for the market to ignore this. My hope is that the global footprint is large enough by then to where Magnite will be prepared for growth without Disney’s partnership (should the worst-case scenario play out).

Financials Snapshot

In Q4, Magnite grew revenue 69% YoY, or 20% on pro forma basis, to $82 million. CTV revenue was $15.3 million, representing an increase of 53% YoY on a pro forma basis. Online Video (OLV) revenue grew 35% YoY on a pro forma basis. 

In total, Magnite recorded 34% of revenue from its CTV segment, 33% of revenue from its OLV segment, and 33% from its display, audio, & other segment. 

When combining Magnite with SpotX for revenue of $350 million, 67% came from CTV and video advertising in the fourth quarter.

GAAP based gross margin for Q4 was 74%, up from 66% in Q3. Net income was $5.9 million in Q4 versus net income of $1.5 million in the fourth quarter of 2019. Adjusted EBITDA was positive $30 million while free cash flow totaled $20.7 million, representing an impressive 25% free cash flow margin. 

Magnite guided for $60 million of revenue at the midpoint of its Q1 outlook, representing 65% YoY growth.  In the company’s Q4 earnings call, Magnite management talked about their expectations for a strong year-over-year growth rate led by CTV.  Management also raised its long-term adjusted EBITDA targets to 30%-35%, based off the successful acquisition of SpotX to reflect the higher margins from SpotX. 

Below is a comparison of three ad-tech stocks: MGNI, TTD, and ROKU:

Magnite management has set a long-term target of 20% top line revenue growth annually.  The company expects the acquisition of SpotX to accelerate both growth rates and margins.  In total, analysts are projecting 30% YoY revenue growth for Magnite in 2021 and 21% YoY revenue growth for Magnite in 2022. We don’t make earnings calls but we think the company is more than capable of meeting this guidance.

We are on the cusp of earnings from Snap and it will be interesting to see what management teams are saying in regards to the economy opening up. There are industries that spend a significant amount on ads that are finally able to reach paying customers – such as travel, auto, entertainment and sports.

When you compare Magnite’s growth during this challenging time to other ad-tech companies, it has done an excellent job despite travel, sports, etc not participating in its revenue growth.

FuboTV

FuboTV is not for the faint of heart. Regardless of the price weakness, which is probably more broad market driven, we remain long as we see a nice set-up for a company centered in the important trend of live sports OTT and a near-term catalyst with sports betting.

We outline the main risk we see below fundamentally in the Conclusion (yes, that’s my way of saying you should read the whole thing).

I’ve said since early January that the short sellers have one solid argument which is the negative gross margins. The issue is they are hammering on the lagging financials (and scaring retailers) and are not modeling the sports betting opportunity. In fact, the short argument has only gotten weaker since the reports were released in December, which asserted FuboTV’s traffic had fallen off a cliff and the sports betting book was an impossibility.

As you can see in the chart below, not only did Fubo’s traffic not fall off a cliff but the company’s growth stands out compared to other top growth stocks when you look at both Q4 and forward estimates.

The sports betting book launch is the easiest part of the equation, so I did not waver on this point before there were any announcements. Now, we have both free-to-play and the betting app coming out this year. The hard part to tech and all media is amassing an audience. It doesn't matter if you're as big as Facebook or as small as FuboTV – your company's value is determined by the size of the audience and the growth of that audience year-over-year. Products and features can be built and launched fairly quickly if you have the audience. You can pivot, expand, etc – again, as long as you have the audience.

That doesn’t mean FuboTV doesn’t have hurdles to clear – my point is that as investors we should have a mental checklist of what is most important for the stocks we own. The first for a media company is always audience.

As FuboTV investors, it's in our favor that the world's two biggest global sporting events coincide this year – the Olympics and the World Cup. What's even more interesting is the economy is re-opening this year and we may see record advertising levels during a time when FuboTV is reaching important live sports audiences.

I’m not going to say it’s a slam dunk (i.e. there are no guarantees) but FuboTV’s path to beating guidance and improving their financials is easier than it appears right now. It probably has the most tailwinds of any company we own in that regard. I say this because the Olympics and World Cup content will demand sizable ad revenue.

North American football rights are in a tug-of-war with even Amazon Prime now in the mix. Hulu announced a carriage deal with the NFL Network and NFL RedZone for Hulu’s Live TV service. The reason why I’m not too worried is that the live sports audience is massive – in fact, these moves may signal a time when cable TV no longer exists and that’s the ultimate goal for a $5 billion market cap company like FuboTV, which will see tremendous windfall if this occurs.

Roku makes this argument frequently when analysts are concerned about competitors, such as Peacock. The argument Roku management makes is that any eyeballs that cut the cord is a windfall for them. If the media conglomerates help push the remaining 74 million cable subscribers in the United States to cut the cord, this helps Roku because the stats show that about 35% to 40% of those 75 million will choose Roku.

We aren’t sure what FuboTV’s true share of the live sports OTT market is because I’ve repeatedly said live sports OTT is too early to draw definitive conclusions. Remember when I said connected TV ads was the future for Roku in 2018 and here we are three years later? I'd say that's similar to where we are with live sports OTT. Another analogy would be subscription video on-demand in its early days (maybe circa 2006). I'm not saying FuboTV’s path to monetization will look like those two companies – I’m trying to give you an understanding of how early we are to the live sports OTT microtrend. We are very early.

FuboTV is not the next Netflix or the next Roku although time will tell if the story is as misunderstood as those two stories were. I believe FuboTV could have similar staying power because of the monetization method — which to be crystal clear — is betting and gamification. Before I expand on monetization, I want to reiterate that live sports is the holy grail for cable subscribers and the microtrend we are invested in – but this is different from a monetization method. Live sports were the last to convert because sports fans are, well, fanatical. In this case, OTT saved the best and highest-paying customers for last.

I don’t have access to Board meetings, obviously, but we can follow the money to see that Disney and Comcast don’t see FuboTV as a competitor. They are backers, and in my opinion, they want a piece of the gamification of live sports. This means free-to-play, betting, and AR/VR. Fubo’s oddball merger with Facebank can lead to AR/VR integration – for instance, a virtual reality boxing match starring Floyd Mayweather. The possibilities here are endless and it doesn’t take much imagination to consider a sports audience to be the perfect AR/VR enthusiasts.

Despite short sellers not seeing how or why a sports betting app could merge with live sports content, we now see DraftKings partnering with Sling/DISH. I guess content and sports betting does go together, after all (insert sarcasm). It’s surprising that the short reports written by telco and media analysts said it cannot be done despite Sky Media having the most successful sports betting model globally.

From purely a user acquisition standpoint, in-app ads with your own content is nearly frictionless and you have a mountain of data to effectively target. FuboTV with Comcast and Disney as backers is much more interesting to me as an investment – and I also believe the NFL Network carriage deal with Hulu will affect DISH more than FuboTV.

Regarding Fubo’s monetization potential, David Gandler has made it clear in this excellent article that 22% of their customers plan to spend more than $100 a month on betting. The number will likely be higher once the product has actually launched. There is also an enviable customer acquisition cost (CAC) and lifetime value (LTV) user acquisition loop between the content and betting. For instance, Fubo can give free sports content away and offer other rewards that are not possible unless you own the audience.

Financials Overview:

In Q4, Fubo grew revenue 98% YoY to $105 million. Subscription revenue was up 91% YoY to $91.4 million, and advertising revenue was up 157% YoY to $13.1 million. Paid subscribers at the end of Q4 totaled 547,880, an increase of 73% YoY. 

For the first quarter of 2021, Fubo guided for $102 million in revenue at the midpoint, representing growth of 100% YoY.  In the Q4 earnings call, management talked about their expectations for a softer Q1 sequentially, which is in line with historical seasonality trends.

Fubo management discussed their plans to continue to focus on expanding the business through growing its top line.  Although the key focus is on top line revenue growth, Fubo still expects to make progress in its path to profitability and margin improvement:

“In terms of the adjusted contribution margin, we don’t provide guidance at this point about these metrics, but we are clearly very focused on expanding our business focusing on growth with an eye to ensure that we continue to improve in our path to profitability delivering an year-over-year improvement of our margins.” – Fubo CFO Simone Nardi 

Fubo defines adjusted contribution margin as a “figure to measure the variable costs against subscriber revenue. ACM is calculated by subtracting ACPU from ARPU.” 

In the full year 2020, Fubo recorded a 10.1% positive adjusted contribution margin, up from -3.1% in 2019.  In turn, gross margins improved from -16% to positive 4.6% in Fubo’s most recent quarter.  Fubo did not give Q1 or 2021 guidance for contribution margin or gross margins but management confirmed that they are expecting continuous year-over-year improvement in margins.  This is a positive sign for a company whose main focus continues to be growing revenue and expanding the business.    

Fubo guided to end Q1 with subscribers of 520,000 to 530,000, representing growth of 82% YoY at the midpoint. Data from Apptopia shows that Fubo ended March with approximately 585,000 daily active users (DAU) versus the Q1 guide for 525,000 paid subscribers at the end of Q1. 

Download data from Apptopia also revealed what appeared to be a strong Q1 in terms of app downloads.

Further, we are seeing a strong start to Q2 for Fubo as app downloads are currently tracking above 100% YoY in April.

For the full year, Fubo management guided to end 2021 with subscribers of 762,000 to 770,000, an increase of 40% YoY at the midpoint of the range. Fubo also raised its revenue outlook by 9% above the previous guide in its Q4 earnings call.  In total, Fubo is expecting revenue of $465 million for the full year, representing growth of 75% YoY. 

Downloads give us a one-dimensional viewpoint yet it’s important to compare downloads with sessions. When broken down week by week, we see sessions up a minimum of 100% at the low point end of March and ticking up towards 200% for about 150 million sessions by mid-April.

Here’s another glimpse of the quarterly data on FuboTV’s total sessions. 

You’ll have to decide for yourself after looking at Fubo’s numbers in Q1 if you think the company can exceed this guidance.

Please note, that while Apptopia provides app data, we do not make earnings calls with this data. It is purely for informational purposes and you must draw your own conclusions based on the data provided.

We've laid out our thoughts on the Olympics, World Cup and sports betting app. These points aren't lagging, they are forward-looking, and that style isn't for every investor. It's certainly our style, however, and we are comfortable with our position in FuboTV.

Conclusion:

The risk I see will be in Q2 numbers. This should be the weakest quarter for FuboTV and this may be what’s being priced in right now. We are tracking decent growth here right now so let’s see what management says in the earnings call.

Posted in Ctv, Stock Updates (Blogs), Tech StocksLeave a Comment on Magnite and FuboTV: Premium Analysis Update

Posts navigation

Older posts

Recent Posts

  • The IPO Glut of 2020: Why Valuations Have Gone Too Far
  • Zoom Discusses Two Important Catalysts In Q1 Earnings
  • Three Risk Management Tools the I/O Fund Offers
  • Micron Is Up 900%. Here’s Why the AI Memory Trade May Still Have Room to Run
  • Credo: Reliability Leader Aggressively Moves into Optics

Recent Comments

No comments to show.

Archives

  • June 2026
  • May 2026
  • April 2026
  • March 2026
  • February 2026
  • January 2026
  • December 2025
  • November 2025
  • October 2025
  • September 2025
  • August 2025
  • July 2025
  • June 2025
  • May 2025
  • April 2025
  • March 2025
  • February 2025
  • January 2025
  • December 2024
  • November 2024
  • October 2024
  • September 2024
  • August 2024
  • July 2024
  • June 2024
  • May 2024
  • April 2024
  • March 2024
  • February 2024
  • January 2024
  • December 2023
  • November 2023
  • October 2023
  • September 2023
  • August 2023
  • July 2023
  • June 2023
  • May 2023
  • April 2023
  • March 2023
  • February 2023
  • January 2023
  • December 2022
  • November 2022
  • October 2022
  • September 2022
  • August 2022
  • July 2022
  • June 2022
  • May 2022
  • April 2022
  • March 2022
  • February 2022
  • January 2022
  • December 2021
  • November 2021
  • October 2021
  • September 2021
  • August 2021
  • July 2021
  • June 2021
  • May 2021
  • April 2021
  • March 2021
  • February 2021
  • January 2021
  • December 2020
  • November 2020
  • October 2020
  • September 2020
  • August 2020
  • July 2020
  • June 2020
  • May 2020
  • April 2020
  • March 2020
  • February 2020
  • January 2020
  • December 2019
  • November 2019
  • October 2019
  • September 2019
  • August 2019
  • July 2019
  • June 2019
  • May 2019
  • April 2019
  • March 2019
  • February 2019
  • January 2019
  • December 2018
  • November 2018
  • October 2018
  • September 2018
  • August 2018
  • July 2018
  • June 2018
  • May 2018
  • April 2018
  • February 2018
  • January 2018

Categories

  • 5G
  • About
  • Accounting Tips
  • AdTech
  • Ai Platforms
  • Ai Platforms
  • Ai Platforms
  • Ai Platforms
  • Ai Platforms
  • Ai Platforms
  • Ai Platforms
  • Ai Platforms
  • Ai Platforms
  • Ai Platforms
  • Ai Platforms
  • Ai Platforms
  • Ai Platforms
  • Ai Platforms
  • Ai Platforms
  • Ai Platforms
  • AI Stocks
  • AI Stocks
  • Analysts
  • Application Monitoring
  • Application Monitoring
  • Applications
  • Applications
  • Applications
  • Applications
  • Applications
  • Applications
  • Applications
  • AR
  • Audit Reports
  • Autonomous Vehicles
  • Autonomous Vehicles
  • Autonomous Vehicles
  • Autonomous Vehicles
  • Autonomous Vehicles
  • Autonomous Vehicles
  • Autonomous Vehicles
  • Avod
  • Avod
  • Battery Charging
  • Bear Market
  • Bitcoin
  • Bitcoin
  • Bitcoin
  • Bitcoin
  • Bitcoin
  • Bitcoin
  • Bitcoin
  • Blockchain
  • Blockchain
  • Blockchain
  • Blockchain
  • Blockchain
  • Blockchain
  • Blockchain
  • Broad Market Today
  • Bull Market
  • Bull Market
  • Chainlink
  • Chainlink
  • Chainlink
  • Chainlink
  • China Stocks
  • Cloud
  • Cloud Infrastructure
  • Cloud Infrastructure
  • Cloud Infrastructure
  • Cloud Infrastructure
  • Cloud Infrastructure
  • Cloud Infrastructure
  • Cloud Infrastructure
  • Cloud Platforms
  • Cloud Platforms
  • Cloud Software
  • Cloud Software
  • Cloud Software
  • Cloud Software
  • Cloud Software
  • Cloud Software
  • Cloud Technology
  • Company
  • Company
  • Console Gaming
  • Console Gaming
  • Console Gaming
  • Consumer
  • Consumer
  • Consumer
  • Consumer
  • Consumer
  • Consumer
  • Consumer
  • Consumer
  • Consumer
  • Consumer
  • Consumer
  • Consumer
  • Consumer
  • Consumer
  • Consumer Tech
  • Corrections
  • Crypto Investment
  • Ctv
  • Ctv
  • Ctv
  • Ctv
  • Ctv
  • Ctv
  • Ctv
  • Ctv
  • Ctv
  • Ctv
  • Cybersecurity
  • Cybersecurity
  • Cybersecurity
  • Cybersecurity
  • Cybersecurity
  • Cybersecurity
  • Cybersecurity
  • Cybersecurity
  • Cybersecurity
  • Cybersecurity
  • Cybersecurity
  • Cybersecurity
  • Data
  • Data Analytics
  • Data Analytics
  • Data Analytics
  • Data Center
  • Data Center
  • Data Center
  • Data Center
  • Data Center
  • Data Center
  • Data Center
  • Data Center
  • Data Center
  • Data Center
  • Data Center
  • Data Center
  • Data Center
  • Data Center
  • Data Center
  • Data Center and Processing
  • Data Warehousing
  • Data Warehousing
  • Data Warehousing
  • Data Warehousing
  • Databases
  • Databases
  • Databases
  • Databases
  • Dating
  • Defi
  • Digital Ads
  • Digital Ads
  • Digital Ads
  • Digital Ads
  • Digital Ads
  • Digital Ads
  • Digital Ads
  • Digital Ads
  • Digital Ads
  • Digital Ads
  • Digital Ads
  • Digital Ads
  • Digital Ads
  • Digital Ads
  • E-Commerce
  • Earning Updates
  • Earning Updates
  • Earning Updates
  • Earning Updates
  • Earning Updates
  • Earnings Report
  • Earnings Report
  • Earnings Report
  • Earnings Report
  • Earnings Report
  • Earnings Report
  • Earnings Report
  • Earnings Report
  • ECommerce
  • Electric Vehicles
  • Electric Vehicles
  • Electric Vehicles
  • Electric Vehicles
  • Electric Vehicles
  • Electric Vehicles
  • Electric Vehicles
  • Energy Stocks
  • Enterprise
  • Enterprise
  • Enterprise
  • Enterprise
  • Enterprise
  • Enterprise
  • Enterprise
  • Enterprise
  • Enterprise
  • Ethereum
  • Events1
  • Events1
  • Exchange
  • Faq
  • Finance
  • Financial Analysis
  • Financial Analysis
  • Financial Analysis
  • Financial Analysis
  • Financial Analysis
  • Financial Analysis
  • Financial Analysis
  • Financial Analysis
  • Financial Analysis
  • Financial Analysis
  • Financial Analysis
  • Financial Analysis
  • Financial Markets
  • FinTech
  • Fundamental Analysis
  • Gambling
  • Gaming
  • Genomics
  • Glossary
  • Green Energy
  • Growth Stocks
  • Growth Stocks
  • Growth Stocks
  • Headsets
  • Headsets
  • Health Tech
  • Hydrogen
  • Identity
  • Identity
  • Identity
  • Inflation
  • Inflation
  • Inflation
  • Internet of Things
  • Interviews
  • Interviews
  • Interviews
  • Interviews
  • Investing
  • Investing
  • Ltbh
  • Ltbh
  • Ltbh
  • Ltbh
  • Ltbh
  • Macro Trends
  • Macro Trends
  • Market Trends
  • Market Trends
  • Market Trends
  • Market Trends
  • Market Trends
  • Market Trends
  • Market Trends
  • Market Updates
  • Market Updates
  • Market Updates
  • Market Updates
  • Market Updates
  • Market Updates
  • Market Updates
  • Market Updates
  • Market Updates
  • Market Updates
  • Media
  • Membership
  • Mining
  • Mobile
  • Mobile
  • Mobile
  • Mobile
  • Mobile Gaming
  • Mobile Gaming
  • Mobile Gaming
  • Multimedia
  • Music Streaming
  • NVDA | NVIDIA Corporation
  • Performance Updates
  • Pin Content
  • Podcasts
  • Podcasts
  • Podcasts
  • Portfolio
  • Premium Research
  • Press Releases
  • Press Releases
  • Productivity
  • Productivity
  • Productivity
  • Productivity
  • Productivity
  • Productivity
  • Productivity
  • Reports and Whitepapers
  • Research Services Preview
  • Resources
  • Resources
  • Semiconductor Stocks
  • Semiconductors
  • Semiconductors
  • Semiconductors
  • Semiconductors
  • Semiconductors
  • Semiconductors
  • Semiconductors
  • Semiconductors
  • Semiconductors
  • Semiconductors
  • Semiconductors
  • Semiconductors
  • Semiconductors
  • Social Media
  • Social Media
  • Social Media
  • Social Media
  • Social Media
  • Social Media
  • Social Media
  • Software
  • Software
  • Software
  • Software
  • Software
  • Software
  • Software
  • Software
  • Software
  • Software
  • Software
  • Software
  • Software
  • Software
  • Software
  • Solar
  • Solar
  • Stock Analysis PDFs
  • Stock Updates
  • Stock Updates (Blogs)
  • Supplychain
  • Supplychain
  • Supplychain
  • Supplychain
  • Supplychain
  • Supplychain
  • Svod
  • Svod
  • Svod
  • Svod
  • Svod
  • Svod
  • Tech Podcast
  • Tech Stock News
  • Tech Stock News
  • Tech Stock News
  • Tech Stock News
  • Tech Stock News
  • Tech Stocks
  • Tech Stocks
  • Tech Stocks
  • Tech Stocks
  • Tech Stocks
  • Tech Stocks
  • Tech Stocks
  • Tech Stocks
  • Tech Stocks
  • Tech Stocks
  • Tech Stocks
  • Tech Stocks
  • Tech Stocks
  • Tech Stocks
  • Technical Analysis
  • Telehealth
  • Telehealth
  • Telehealth
  • Telehealth
  • Testing Equipment
  • Testing Equipment
  • Top Tech Stock News
  • Travel
  • Trends Report
  • Tutorials
  • Uncategorized
  • Updates
  • Updates
  • Updates
  • Video
  • Video
  • Video
  • Video
  • Video Footage
  • VR
  • Webinar Alerts
  • Webinar Alerts
  • Webinars
Proudly powered by WordPress | Theme: iofund by iofund.co.uk.