Lam Research reported strong Q4 FY2022 results as revenue grew by 12% YoY and 14% QoQ to $4.64 billion. The company beat Wall Street analysts' estimates by $422 million (10% beat). It reported adjusted EPS of $8.83 and beat estimates by $1.50 (20% beat).
The Systems revenue which includes sales of new leading-edge equipment in deposition, etch, and clean markets grew by 8.8% YoY to $3.0 billion. Customer support business group revenue grew by 18% YoY to $1.6 billion.
The company is seeing increased demand in new advanced packaging architectures. Tim Archer, CEO of the company, said in the earnings call, “Our Kiyo plasma etch products with Hydro have a proven record of delivering the productivity and uniformity requirements needed for cost effective front-end device scaling. Leveraging this expertise in high-volume manufacturing, we have now achieved multiple new etch tool of record positions for advanced packaging at a leading foundry logic customer. As customers further develop these architectures in support of greater system performance, we see a growing opportunity for Lam’s etch and deposition solutions.”
The company’s gross margin was 45.3% compared to 44.7% in the Q3 FY2022 and 46.2% in the same period last year. The adjusted gross margin was 45.2% compared to 44.7% in the Q3 FY2022 and 46.5% in the same period the previous year. The gross margin was close to the higher end of the management’s guidance of 43.5% to 45.5%, as strong sales helped to overcome the rise in costs.
The gross margins could be under pressure in the near term due to inflation and increased expenses due to supply chain issues. The management expects it to improve in the long-term. The company is also moving closer to its customers in Asia by building facilities there, which is another point mentioned in the earnings call that could be a hedge for rising freight and logistics expenses.
The operating margin improved to 31.9% compared to 29.4% in Q3 FY2022 and 31.7% in the same period last year. The adjusted operating margin was 31.5%, which was up 210 bps helped by strong sales and was above the management’s guidance of 28.5% to 30.5%. The company’s adjusted net income rose 5.2% YoY to $1.2 billion. The adjusted EPS was $8.83 compared to $8.09 for the same period last year.
The company had cash and investments of $3.9 billion compared to $4.6 billion in the March quarter. The company repurchased shares of $868 million and paid dividends of $208 million in the recent quarter. The operating cash flow were $443.9 million in the recent quarter. It was down from the March quarter of $757.7 million as the company increased the level of inventory in the recent quarter. The company has a debt of $5.0 billion.
The company’s deferred revenue balance was $2.2 billion at the end of the quarter, up from $2.07 billion at the end of Q3 FY2022. The deferred revenue grew by $129 million in the recent quarter compared to $610 million in the previous quarter. It was higher in the last quarter due to part shortages which negatively impacted the recognized revenue in the last quarter.
WFE and guidance
The management has lowered the wafer fab equipment spending outlook for the calendar year 2022 to be in the range of low to mid-$90 billion range on the back of supply chain issues. This is lower than the management’s earlier forecasts of $100 billion. In the earnings call, Tim Archer CEO of the company said, “As suggested by our guidance today, we expect to see incremental improvement in supply chain conditions in the September quarter, but our view is that industry-wide output will continue to be constrained through the rest of this year. Consequently, we are lowering our outlook for calendar year 2022 wafer fab equipment spending to be in the low to mid-$90 billion range.”
In the last earnings call, Tim Archer said, “While continued supply-related delays could potentially limit how much wafer fabrication equipment investment can be executed in 2022, our current WFE view is still in the $100 billion range. We see unconstrained demand exceeding $100 billion in 2022 and any unmet demand should flow into next year.”
The management expects revenue of $4.9 billion at the mid-point of the guidance in the next quarter, representing a 14% YoY growth. It was above the Wall Street analysts’ estimate of $4.6 billion. The adjusted gross margin is expected to be in the range of 44% to 46% after taking into consideration the inflationary pressures due to supply chain issues, adjusted operating margin in the range of 30.5% to 32.5%, and adjusted EPS of $9.50 at the mid-point.
Recent analysts notes:
Wells Fargo analyst Joe Quatrochi raised the firm's price target to $475 from $460 and kept an Equal Weight rating on the shares. While Lam Research's better-than-expected Q4 results/Q1 guide reflect improving supply chain dynamics and execution, the analyst expects investors to focus on expanded China export restrictions and WFE commentary.
DA Davidson analyst Thomas Diffley lowered the firm's price target to $550 from $575 and kept a Neutral rating on the shares. The company posted a beat-and-raise Q4 results amid robust demand and improved operational execution, but the management also lowered its outlook for WFE spending to be in the low to mid $90B range – lower than initial expectations of $100B – due to ongoing supply constraints, the analyst tells investors in a research note. The risk-reward on Lam Research shares looks balanced, Diffley adds.
Conclusion
The company’s results were good as it beat both the top line and bottom-line Wall Street analysts' estimates by a wide margin. The guidance for the next quarter was also strong. The company’s management of rising costs and the slowdown in the WFE are two areas to watch in the coming quarters.
This article was originally published on Forbes on Apr 7, 2022,11:53pm EDTForbes on Apr 7, 2022,11:53pm EDT
Last week, we discussed signs of improvement at key automotive semiconductor suppliers and why this was affecting ad-tech stocks. Supply chain issues are causing a ripple effect due to automotive being a significant category of ad spend and due to low inventory, advertising budgets are being slashed. As stated in last week’s analysis, our expectation is that supply issues will ease by Q3 causing both automotive and ad-tech to rebound.
Specifically, it’s the extremes of seeing a $300 billion drawdown in inventories in Q2 2020 followed by the largest increase on record of inventory levels in Q4 2021. We believe this sharp rebound helps highlight that production is catching back up with demand.
Supply Chain Impact to Roku Stock and Ad-tech Going Forward
Below, we discuss why Roku stock could be set to rebound when supply chain issues begin to ease due to extreme oversold conditions based on transient headwinds. We also discuss more in depth the supply chain rebound we are forecasting for some time around the second half of 2022.
Source: U.S. Bureau of Economic Analysis (I/O Fund)
While supply chain constraints are expected to remain tight in 2022, there are numerous signs that the bottom is in. For instance, aggregate inventories rebounded strongly in Q4 2021 and have made up most of the decline from production halts during Q2 2020. Moreover, inventories relative to aggregate sales are at multi-year highs. The rebound in aggregate inventories suggests that supply chain constraints are normalizing for the broader economy.
Connected-TV (CTV) is particularly exposed to automotive advertising budgets, and a rebound in automotive inventories will be a tailwind for CTV ad-tech companies such as Roku. Automotive ad spend was just 15% of its pre-pandemic levels, largely due to the shortage of automotive inventories.
During the Q4 earnings call (02/17/22), Roku’s management explained how automotive was ‘soft’ during the quarter, yet they expect this to be a temporary trend. Roku CFO Steve Louden made a good point during the Q4 call, stating that automotive manufacturers are much stronger today than they were at the start of the pandemic, meaning that these brands have increased capacity to market their brands going forward.
For instance, if the top two automotive ad spenders (Volkswagen and Toyota) grow their topline by the midpoint of their respective guides and if their sales and marketing margins normalize to pre-pandemic levels, then aggregate ad spending could rise by about ~25% YoY in 2022, up from the ~6% YoY rise in 2021. Rising ad spend from these two leading manufacturers will likely spur marketing investments from peers.
Despite lower growth in Q1, Roku reiterated full year 2022 growth in the mid-30s. Going into the report, analysts were expecting 36% annual growth. The ad platform missed analyst expectations at $703 million compared to $732 million expected.
EBITDA was a miss with company guiding for $55 million compared to the consensus for $79 million in the upcoming Q1 quarter. The company plans to spend $1 billion on operations, which translates to investments in headcount, The Roku Channel (which is producing originals), and the Roku TV program (which means growing operating system market share).
The $1 billion in expenses is not overly concerning although it’s certainly an adjustment in expectations as the Street may have believed that Roku’s earnings were quickly scaling, but this was impacted by a slowdown in expenses during covid, and now those expenses need to ramp in the upcoming year to remain competitive.
Sign up for I/O Fund's free newsletter with gains of up to 403% – Click hereSign up for I/O Fund's free newsletter with gains of up to 403% – Click hereClick here
I/O Fund Financial Analyst Bradley Cipriano stated in a research note to our clients that Netflix's operating expenses ramped nearly $1 billion YoY when it passed $3 billion in revenues in 2011, which Roku is nearing. Viewed differently, the expected revenue growth in FY2022 of $830 million will be accompanied by a $1 billion rise in expenses, meaning that each $1 of expenses will drive just $0.76 of revenue, which is the lowest value in Roku's history. This suggests that growth is much more expensive than in prior years.
However, this is likely due to the slowdown in investments made during 2020 and 2021, and the three-year average for the above metric is 1.08x (including FY2022), meaning that each $1 of expenses resulted in $1.08 in revenues. This is above the prior three-year average of 1.04x (2019-2017), highlighting that over a longer time frame, Roku is in fact demonstrating leverage, albeit it is lumpy. FY2021 and FY2022 also includes the Player gross loss headwind that wasn't the case in prior years, and adjusting for this, the three-year average would be even higher. The takeaway is that the rise in expenses seems in-line with historical trends once we account for COVID.
The lower EPS this year is a headwind to the company's valuation, but it is expected to be profitable in FY2023. The company should be cashflow positive in FY2022 and with $2.1 billion in cash on balance, likely should not need to dilute shareholders despite the losses. There is also some leverage to improve earnings as there were $82m in one-time expenses during the most recent year.
If we widen our view, we will see that 2020 was the first year Roku was EBITDA positive and the company is expected to remain EBITDA positive this year. Most importantly, Roku has leverage with a gross profit of $1.4 billion and they are choosing to spend for top line growth.
Overall, Roku is a more complex product story because the strategy is to conquer from many angles. It’s an ad exchange, it’s a content channel, it’s an operating system and it’s a hardware player. It also owns the best first-party data available on CTV ads and I tend to stick with the data in terms of ad-tech. So, that’s primarily the reason we own Roku and continue to own Roku.
Regarding Roku’s recent price action, we look for dislocations within the markets and we believe transitory supply chain issues have caused the dislocation seen below in Roku’s valuation and its forward estimates. Most of tech has seen a dislocation between January-March, although Roku’s dislocation is particularly steep.
Regarding Roku’s recent price action, we look for dislocations within the markets and we believe transitory supply chain issues have caused the dislocation seen below in Roku’s valuation and its forward estimates. Most of tech has seen a dislocation between January-March, although Roku’s dislocation is particularly steep. (I/O Fund)
What is most striking about the divergence above is that the current selloff has provided a much cheaper stock than during the pandemic when many businesses were shut down entirely and ad budgets halted.
Despite strong growth estimates in the second half of the year, the forward PS on Roku reached 4x, which we consider to be extreme to the downside. We took this opportunity to begin building up Roku and other key ad-tech allocations. We also believe that Q4 2021 will likely represent a ‘bottom’ in automotive supply constraints, and that ad spend from automotive manufacturers will rebound going forward as supply chain constraints begin to ease.
More Data Supports Supply Chain Issues Easing in Q3
The surge in raw materials and work-in-process inventory at major auto manufacturers adds further support that auto companies are positioned to quickly ramp production. As shown below in Chart 8 and 9, both aggregate automotive raw materials and work-in-process inventories have increased to a five-year high relative to total inventory.
Chart 8. Aggregate Automotive Raw Materials to Inventory Ratio
Source: Auto manufacturer filings (I/O Fund)
Chart 9. Aggregate Automotive Work-in-Process to Inventory Ratio
Source: Auto manufacturer filings (I/O Fund)
What this trend shows is that automotive manufacturers have high levels of working capital stored in near-complete inventory. Once semiconductor supplies arrive, we should expect automotive manufacturers to quickly convert this inventory into finished goods. A build in finished goods inventory should also lead to a strong rebound in advertising budgets from the automotive industry.
Sign up for I/O Fund's free newsletter with gains of up to 403% – Click hereSign up for I/O Fund's free newsletter with gains of up to 403% – Click hereClick here
Since the semiconductor shortage is a systemic issue, we should expect auto manufacturers to ramp spending at the same time. Furthermore, auto manufacturers will likely look to quickly offload their inventory to avoid oversupply and capture market share. This trend should help drive demand for ad spend going forward.
Notably, the timing of this ramp remains unknown, with some auto executives expecting H2 2022 to be a return to normal, and others forecasting a longer horizon. We discussed this trend in more detail in last week’s analysis.
Chart 10. Aggregate Automotive Finished Goods to Inventory Ratio
Source: Auto manufacturer filings (I/O Fund)
Automotive semiconductor OEMs report rising inventories and increasing capex
IHS Markit estimated that North American vehicle production in 2021 increased just 1% YoY to 13.1 million. In 2022, vehicle production is expected to rebound and increase 13% YoY to 14.7 million units in 2022 but remain below the 15 million vehicles produced in 2019.
Nonetheless, the rebound in production should support a rebound in ad spend going forward.
While there remains considerable uncertainty due to the cadence of the ramp in vehicle production, there are signs of improvement from key automotive semiconductor suppliers.
For instance, Infineon Technologies, a key supplier of inverters for automotive applications, stated during their latest earnings call (02/03/22) that “the December quarter was the first one in a while where we did not experience [supply] disruptions”. Management added that tightness remains in securing foundry supply, but that wafer supplies are expected to materially improve in the second half of 2022.
The below charts highlight how raw material inventories have been rising for key automotive semiconductor suppliers, a trend that supports a rebound in supply going forward.
A rise in raw materials signals that companies are expected to ramp production in the near term. Furthermore, these automotive semiconductor suppliers have also ramped capacity, as aggregate capex for the group increased 29% YoY to nearly $8 billion. A rise in capex signals that management is increasing supply capacity in anticipation of future demand growth. The concurrent rise in raw materials and capex signals that supply will improve going forward, suggesting that we are nearing a trough in semiconductor imbalances in the auto industry.
Chart 11. Recent Trends in Raw Material Inventories for Automotive Semiconductor Producers
Recent Trends in Raw Material Inventories for Automotive Semiconductor Producers (I/O Fund)
Chart 12. Recent Trends in TTM Capex from Automotive Semiconductor Producers
Source: Company filings (I/O Fund)
We believe that 2021 will likely represent a ‘bottom’ in automotive supply constraints, and that ad spend from automotive manufacturers will rebound going forward as supply chain constraints begin to ease. However, semiconductor supply is expected to remain tight throughout 2022, which is the main bottleneck impacting the ramp in auto production. With record levels of idle work-in-process inventory, we believe that auto manufacturers will quickly ramp ad spend to turnover their inventory once semiconductor supply reaches them. With semiconductor OEMs reporting a ramp in both capacity and raw materials, we believe that automotive ad spend will be a tailwind for ad-tech going forward, with a significant ramp in H2 2022 and into 2023.
Roku has been a strong and steady performer in terms of revenue growth and improvement in the bottom line since going public. In six years, Roku has been able to grow its revenue 850% from $398 million in 2016 to an estimated $3.72 billion for FY2022. The Trade Desk will have grown 687% on a lower revenue base while trading 3X higher.
Even with increased spending of $1 billion, it’s important to consider that the company has leverage in its business model. Critics will point out that TTD has a much better operating margin – but time will tell if Roku has chosen the correct strategy to own the real estate. To me, this is arguably the better business model considering the average consumer owns their connected TV for seven years. If so, the current valuation for Roku is too low compared to its forward growth, which made it a buy in Q1.
Financial Analyst Bradley Cipriano, CFA, CPA at I/O Fund, contributed to this analysis.
Please note: The I/O Fund conducts research and draws conclusions for the Fund’s positions. We then share that information with our readers. This is not a guarantee of a stock’s performance. Please consult your personal financial advisor before buying any stock in the companies mentioned in this analysis.
This article was originally published on Forbes on Apr 1, 2022,01:24pm EDTForbes on Apr 1, 2022,01:24pm EDT
Aggregate Inventories Have Recovered but Auto Inventories Remain Under Pressure:
Supply chain issues have been a well-publicized event that has been hard to predict. While there have been improvements in supply chain management since the harsh production halts enforced during the pandemic, semiconductors continue to be a bottleneck in numerous industries, especially automotive.
Furthermore, the semiconductor bottleneck has had a ripple effect and has impacted industries outside of automotive production, such as ad-tech. In fact, ad-tech has been one of the most beaten-down industries due to the supply chain crisis. This is because automotive is a significant category of ad spend, and without inventory to sell, advertising budgets have been slashed. Nonetheless, we expect that this is only a temporary concern and that ad-tech will rebound in 2022 as supply chain issues begin to normalize. We especially look for discounts in tech that stem from a transient yet external issue outside of any individual company’s control.
The I/O Fund team went beyond relying on management commentary and studied the data to better understand the supply chain bottleneck. We found that aggregate inventory levels have generally recovered, but automotive inventories remain under pressure. I/O Fund Financial Analyst Bradley Cipriano notes that an analysis of automotive inventory composition suggests that the supply-chain issues have likely bottomed and will improve going forward.
The I/O Fund chose to be aggressive during the Q4 earnings season between January and March by building ad-tech positions for this reason. We expect that improving inventory trends will lead to a sharp rebound in automotive advertising in the back half of the year, driving topline growth for the ad-tech sector. We discuss why we believe that the supply chain crisis will ease around H2 2022 below.
Supply Chain Management: Aggregate Inventories Have Recovered but Auto Inventories Remain Under Pressure
The pandemic began in early 2020 and resulted in a whipsaw effect that impacted both supply and demand. With governments enforcing strict shelter in place orders, production of goods declined in 2020 but consumers still demanded goods. Government stimulus further bolstered demand and there was less of a contraction in total demand than there otherwise would have been. This dynamic led to the supply shortage that many sectors have been working through.
Since inventories are essentially the difference between production and sales over a period of time, the dynamic of reduced production but increased demand led to a sharp reduction in inventories in 2020 and 2021. As shown below in Chart 1, changes in private inventories, which is a measure of the value of the physical volume of inventories that businesses maintain to support their production, materially declined in Q2 2020. In fact, the $300 billion drawdown in inventories in Q2 2020 was the steepest drawdown in history.
However, while Q2 2020 represented the steepest decline on record, Q4 2021 represented the largest increase on record, as inventory levels bounced back by over $200 billion. This sharp rebound helps highlight that production is catching back up with demand
Chart 1. 50-year Trend of Changes in Private Inventories
Source: U.S. Bureau of Economic Analysis – I/O FUND
Source: U.S. Bureau of Economic Analysis – I/O FUND
In Chart 3 (below), inventories are also rising relative to sales, suggesting that there has been a build in inventory levels. Furthermore, the metric is above the five-year average, implying that inventories are not tight on a systemic scale.
Chart 3. Five-Year Trend of Private inventories to Final Sales
Source: U.S. Bureau of Economic Analysis – I/O FUND
While the above charts highlight that there has been a strong recovery in inventory levels in the economy, it fails to take into account the types of inventories. Specifically, despite the recovery in aggregate inventories, automotive inventories have fallen to all-time lows.
Sign up for I/O Fund's free newsletter with gains of up to 403% – Click hereSign up for I/O Fund's free newsletter with gains of up to 403% – Click hereClick here
The below chart from the U.S. Bureau of Economic Analysis shows that auto inventories have declined to a record low and are hovering just above 0.Without much inventory to sell, there is little incentive to spend on advertising, which has negatively impacted ad-tech.
Chart 4. Domestic Auto Inventories
U.S. Bureau of Economic Analysis – I/O FUND
Chart 5. Domestic Auto Inventories to Sales Ratio
Source: U.S. Bureau of Economic Analysis – I/O FUND
Data from Dentsu’s Global Ad Spend Report highlights how automotive spending is still below 2019 levels. As shown below in Chart 6, global automotive ad spend declined 16% YoY in 2020, and rebounded just 12% in 2021, meaning that global automotive ad spending was still ~6% below its pre-pandemic levels. Since automotive advertisers spend an outsized amount of their budgets on TV ads, ad-tech companies exposed to connected TVs have been especially impacted by the soft recovery in auto ad budgets shown below. As I’ll discuss in more detail below, we believe that automotive ad spending has bottomed and will be a tailwind for ad-tech going forward.
Chart 6. Automotive Global Paid Search Ad Spend
Source: Dentsu Global Ad Spend Report – I/O FUND
Curiously, despite the fact that auto inventories are at record lows, automobile manufacturers’ inventories are also at an all-time high. As shown below in Chart 7, total inventory levels in the automotive manufacturing industry have surged throughout 2021 and into 2022.
Chart 7. Automotive Total Inventories
Source: U.S. Census Bureau – I/O FUND
These disparate trends are driven by the well-publicized semiconductor bottleneck. As Chart 7 highlights above, automotive manufacturers have large amounts of nearly completed inventory that is sitting idle until semiconductor supply arrives.
Once the supply of semiconductors arrive, automotive manufacturers should be able to quickly ramp and turn work-in-process inventory into finished goods that can be sold. Moreover, this should also drive demand for advertising as auto manufacturers look to quickly convert their inventory into cash.
Fortunately, there are signs of improvement for supply chain issues, specifically from the automotive industry. For instance, Volkswagen Group’s management team explained on their Q4 call that they “expect semiconductor supply bottlenecks to continue in 2022, but gradually improve in the second half of the year” (03/15/22).
General Motors echoed similar sentiment during its Q4 earnings call. GM CEO Mary Barra stated that “by the time we get to third and fourth quarter [of 2022], we're going to be really starting to see the semiconductor constraints diminish” (02/01/22).
However, this sentiment was not shared by all automotive executives. CEO of Stellantis, maker of Dodge RAM, Fiat and other brands, stated on the company’s Q4 call (2/23/22) that the size of the automotive market will be driven by the supply of semiconductors, adding that “hopefully, things will get a little bit better. But we believe it's going to be very slow. It will take time. And 2022 is not going to be from that perspective, the year where we can say we are back to normal. We don't think that will happen”
Looking forward, automotive manufacturers have outsized raw material and work-in-process inventory that will help them quickly ramp production once semiconductor supply improves. The timing of this ramp remains unknown, with some auto executives expecting H2 2022 to be a return to normal, and others forecasting a longer horizon.
Next Tuesday, we will discuss the signs of improvement at key automotive semiconductor suppliers and what this means for ad-tech including one strategic bet the I/O Fund made in ad-tech during the January-March selloff.
Bradley Cipriano, Financial Analyst, CFA, CPA at I/O Fund, contributed to this analysis.
Nvidia’s stock went from unstoppable to nearly uninvestable in the matter of a few weeks last year and has not recovered.
The sudden drop in Nvidia’s stock price and a competitive ecosystem that’s hard to understand are two reasons the chipmaker has scared away growth investors, who have opted for momentum bets such as cloud-software companies. The fact that semiconductor companies are cyclical, and mired in the U.S.-China trade war, has further overshadowed Nvidia’s growth potential.
But the real story is that Nvidia is spring-loaded as its product offerings quietly gather strength in a market of enormous magnitude: artificial intelligence (AI). The path for Nvidia’s market domination in the AI economy, worth $15 trillion over the next decade, will be choppy now and exhilarating later.
Nvidia’s profits have been slammed over the past two quarters, and will require a few more quarters to return to levels before the cryptocurrency bust, which reduced demand for Nvidia’s mid-range graphics chips. A spectacular comeback is not likely when the company reports earnings Thursday after the stock market closes.
In the first quarter, Nvidia reported $394 million in net income and earnings per share (EPS) of 65 cents, down from $1.24 billion and EPS of $2.05 a year earlier. Analysts are predicting EPS of $1.07-$1.24 for the third quarter. Still, profit margins are better than those of rival AMD, which booked net income of $35 million on revenue of 1.53 billion in the second quarter. Despite that, AMD’s stock has risen 79% over the past 12 months, compared with Nvidia’s -40%
Nvidia vs AMD
Taking a somewhat contrarian stance, I do not regard AMD as Nvidia’s primary competitor. AMD is more focused on Intel and taking market share from the CPU data center. Nvidia’s true rivals are FPGA chips from Xilinx and Intel/Alterra. I also believe AMD will have to choose if it plans to go against two 800-pound gorillas (Intel on CPUs and Nvidia on GPUs).
It would be nearly impossible to stave off Nvidia, which is putting all of its weight into the GPU data center with the acquisition of Mellanox and new partnerships such as with Arm on AI and high-performance computing software. That will help strengthen Nvidia’s lead, which already owns over 90% of the cloud infrastructure-as-a-service market.
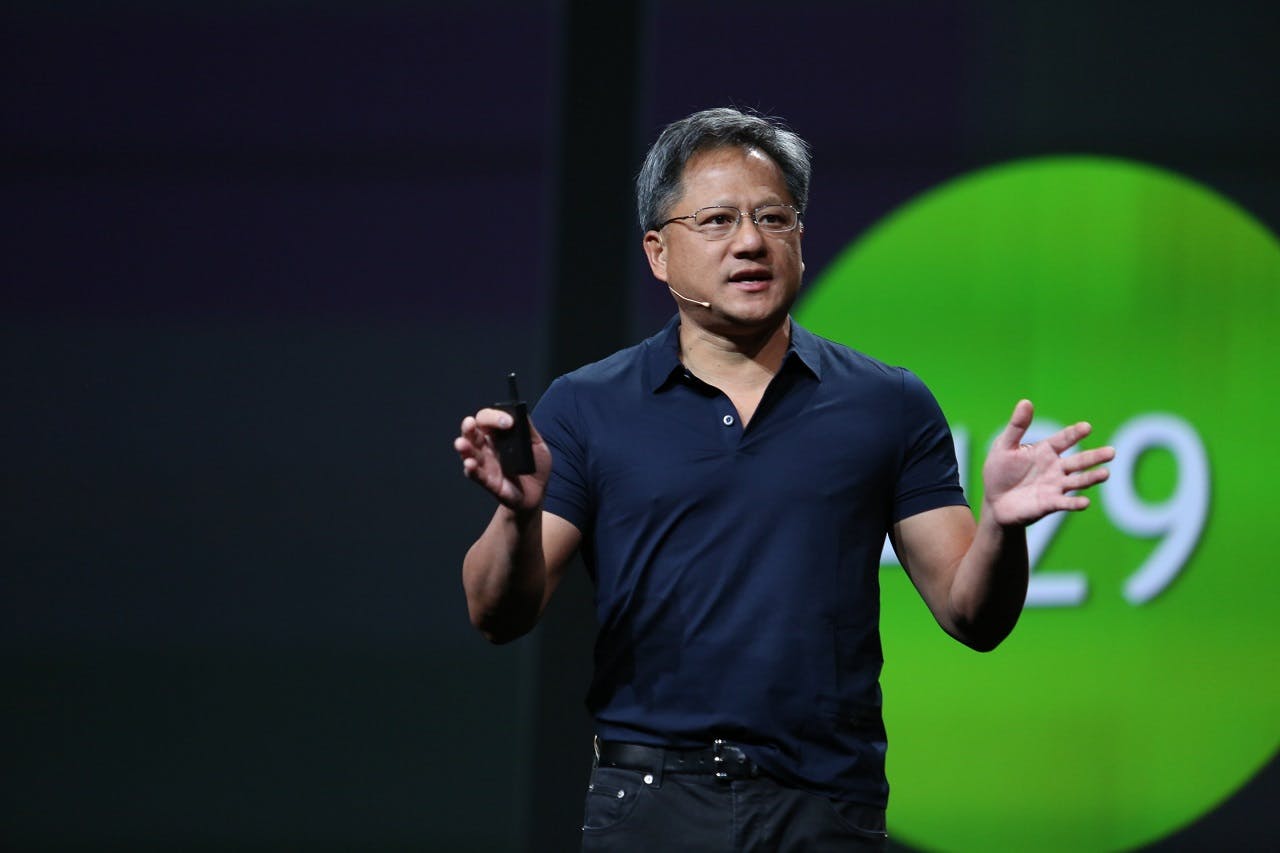
Chief Executive Officer Jensen Huang had an excellent quote that described Nvidia’s ongoing cooperation with CPUs as the necessary backbone to GPUs, and why his focus has been elsewhere in the data center stack. It helps to provide a glimpse into his future strategy.
“These two types of processing are going to be here to stay,” he said. “With accelerated computing, we don’t suffer from Amdahl’s Law — we obey it, and the thing that you don’t accelerate becomes the critical path. We believe in fast CPUs, and that is why we work with all of the world’s fastest CPU makers — IBM, Intel, AMD, Arm.”
Huang went on to say he’s focused on the X factor, or what will accelerate the path forward at the highest percentages possible. Rather than compete with many players on CPUs, Huang wants Nvidia to be the leader in the highest growth piece of the data stack — parallel computing and acceleration, especially in AI.
The $7 billion acquisition of Mellanox, announced in March, will help Nvidia accelerate the performance of GPUs while maintaining a low barrier to entry for developers who favor Nvidia’s CUDA platform for AI development.
Mellanox acquisition
To illustrate how Mellanox accelerates the performance of GPUs, Nvidia and Mellanox support more than 250 of the world’s top 500 super computers, including the world’s two fastest supercomputers, Sierra and Summit, operated by the U.S. Department of Energy.
Mellanox’s Ethernet switch systems are the most used internal system in the top 500 in a recent report released at ISC High Performance, with 247 systems, and InfiniBand is the second most-used, with 140 systems. However, InfiniBand, a computer-networking communications standard, connects the most high-powered computers where the presence of Ethernet is nearly non-existent.
This is clearly a strategic acquisition for Nvidia as Mellanox has small profits (net income of $38.4 million in the second quarter) with profit margins of 2%, and the acquisition will require nearly all of Nvidia’s cash reserves. As a result, Nvidia may have to take on debt.
Some speculate that Chinese regulators could block the acquisition, similar to what happened when Qualcomm attempted to acquire NXP Semiconductors. This is less likely, though, as Nvidia and Mellanox are in separate categories and don’t pose security risks from communications. In addition, China is a large customer of Nvidia for AI applications and stands to benefit from the combined company.
In other words, Nvidia is not acquiring Mellanox to simply own InfiniBand and Ethernet, but rather to boost its GPUs as the best data center option available. Nvidia is aligning its architecture with speed, as Mellanox supports Virtual Protocol Interconnect (VPI), which allows the ubiquitous Ethernet to provide bandwidth as cheap as possible, and InfiniBand to deliver higher throughput and fewer bottlenecks during high loads.
Mellanox has done an excellent job of taking market share from Ethernet incumbents, such as Cisco, Arista Networks, Juniper Networks, Hewlett-Packard, Dell and Intel. Some of this is due to Ethernet, and also InfiniBand, and now a hybrid of the two.
Nvidia’s Mellanox acquisition helps increase Nvidia’s competitive lead on GPUs, while also slightly reducing the requirement for CPUs from companies like Intel and AMD. Mellanox can be leveraged to speed up GPUs while closing the gap in latency performance with FPGAs (Xlinx and Intel/Alterra). This is a strategic acquisition for Nvidia and Mellanox to become the strongest combination for artificial-intelligence and machine-learning computations.
Declining data center revenue
This thesis hinges on data center GPU revenue, which is declining quarter-over-quarter across both Nvidia and AMD. The Mellanox acquisition won’t close until the end of the year. Plus, rumor has it, China may delay trade talks through the 2020 election. Therefore, timing remains a primary challenge for Nvidia investors to capture this forward-looking opportunity.
Nvidia’s data center sales have fallen over the past two quarters by 14% in January and 7% in April. According to MarketWatch, some analysts predict data center revenue will continue to decline through the third quarter of this year.
AMD reported its average GPU sales price was down slightly quarter over quarter due to lower data center GPU sales. Still, sales rose year over year.
Nvidia’s singular focus is GPU-powered cloud and artificial intelligence applications, and FPGAs are the second runner-up rather than AMD’s GPUs. According to Liftr Cloud Insights, 97.4% of cloud infrastructure-as-a-service (IaaS) compute instances deploy Nvidia’s GPUs across the top four cloud providers. The top four cloud providers are Amazon, Microsoft, Google and Alibaba, and account for 62.3% of the IaaS and platform-as-a-service markets. According to the insights report, AMD accounts for only 1% of the cloud IaaS market.
As with many of the best growth opportunities, the current earnings outlook does not accurately portray Nvidia’s potential. This will be true for a few quarters. It may require sniper-like timing (or a generous trailing stop), but betting on Nvidia and AI will have spring-loaded gains when there are clearer skies for semiconductors and hyper growth in the $15 trillion AI economy.
This article appeared on MarketWatch August 14th, 2019.MarketWatch August 14th, 2019.
My premium subscribers received a 12-page report on Roku And TTD prior to earnings, Snap prior to earnings and tech trade war plays to hedge their portfolios. Premium researchPremium research members receive updated recommendations and entry/exit scenarios on tech stocks. Learn more hereLearn more here.