Skip to content
Logo-main-white.860316a8

I/O Fund

  • Home
  • Free Stock Analysis
  • AI Stocks
  • BEST OF 2025
  • Analysts
  • Nvidia Hub
  • About
    • Case Studies
    • About Us
    • Premium Services
    • Pricing
    • Notable Wins
    • I/O Fund Reviews
    • Media
  • Contact Us

Category: About

Thank you for joining I/O Fund Essentials!

Posted on March 27, 2025June 30, 2026 by io-fund

We think you’ll find our service provides a competitive edge in technology, the world’s most valuable and rewarding industry.

The I/O Fund strives to offer high conviction analysis from one of the best tech analysts in the world, Beth Kindig, along with an actively managed portfolio with real-time trade alerts. Our audited performance proves that I/O Fund competes with and often beats Wall Street's highest-performing funds.

For just $99/year with I/O Fund Essentials you will receive:

  • A fully managed, 3 stock portfolio of our highest conviction tech ideas. If we decide to add to the position or trim it, this information will be provided in real-time.
  • Two monthly reports, including (1) fundamental analysis from Lead Tech Analyst Beth Kindig and (1) technical analysis from our Portfolio Manager, Knox Ridley.

For the more advanced investor, our goal is simple – we want to own stocks like Google, Apple, and Amazon long before they become one of the most valuable companies in the world. Our premium memberships are designed to educate and manage risk in these high conviction stocks that we believe are early to major tech trends.

Upgrade at any time to receive a fully managed portfolio of 10-15 stocks including 3 cryptocurrencies, real-time trade notifications, and weekly deep dives. These plans start at $549 and $849. Email premium@io-fund.com for an Essentials Discount of $100 off either Pro or Advanced.premium@io-fund.com for an Essentials Discount of $100 off either Pro or Advanced.

Here’s a breakdown of what you get with each plan:

Notable wins from the I/O Fund team:

  • The I/O Fund has cumulative returns of 210% and a lead over institutional technology portfolios of as much as 219% since inception. 
  • In 2024, the I/O Fund returned 35%, outperforming the S&P 500 by 11% and both the Nasdaq-100 and Invesco QQQ ETF by 10%. 
  • We had 10 positions outperform the NASDAQ-100 in 2024. 
  • We also closed an altcoin for a 99% quick gain and Netflix for a 164% realized gain in 2024. 
  • Our combined realized returns on Super Micro were 243% while utilizing risk management to sidestep volatility. 
  • We opened CrowdStrike in early 2023 and began taking gains in early 2024. We ended up closing the entire position for a realized gain of 87%, just before the vertical drop took CRWD down 41% from our final closing price. 
  • We posted returns of 57% in 2023. If we were an ETF, mutual fund or hedge fund, our ranking would be #4 in the Wall Street Journal’s Winners’ Circle ranking of 1,191 funds. 
  • In 2023, we had five positions with returns over 100% and seven positions beat the Nasdaq. Many were held at high allocations. 
  • The I/O Fund had a 45% allocation to AI going into 2023, one of the highest on record. Today, the AI allocation is higher with many lesser-known names. 
  • Issued 9 trade alerts for Nvidia under $20. Provided over 25 analyses on Nvidia’s AI thesis before the market caught on. 
  • Nearly impeccable record on Bitcoin, buying between $7K to $10K, trimming at $58K, buying again $15K to $16K for the rally to $100K+. All entries and exits are sent as trade alerts. 
  • We were early to the cloud in 2019, then rotated into AI in 2022 with a 45% allocation in 2023. 
  • Released an automated hedge in 2022 to stave off losses during a historic selloff in the tech sector. 
  • Picked the leading sectors in 2021: semiconductors and blockchain. 
  • Picked the two top-performing cloud stocks in 2021 (DDOG and ASAN) 
  • Picked the best-performing asset with a large market cap in 2021 (ETH) 
  • Picked the best stock in the S&P 500 in 2019 (ROKU) 
  • Has beaten other tech-focused funds in every audit since the portfolio’s inception. 

What you can expect from the I/O Fund Essentials Plan:

Institutional-Level Research Monthly

You will receive original analysis by Beth Kindig, Knox Ridley, and Royston Roche monthly, along with an actively managed 3 stock portfolio. We are confident that nothing like the I/O Fund team’s research exists outside of institutions. Knox’s technical analysis perfectly complements Beth’s and Royston’s fundamental research, giving you the best research on the market.

High-quality, timely analysis and updates

As a member of I/O Fund Essentials, you’ll get an email notification as soon as our analysis is posted so you can stay up to date with the latest research from our team.

What you can expect from the I/O Fund Pro Plan:

  • Weekly Tech Stock Analysis, includes fundamental analysis from Lead Tech Analyst Beth Kindig.
  • Premium library of institutional-level research and analysis, including fundamental stock analysis, deep dive research into current tech trends and the companies we believe are setup to benefit from these trends.
  • Quarterly webinars to discuss our positions. We also identify trends/catalysts we are eyeing to fill our new idea pipeline.
  • A completely Transparent Portfolio made up of growth tech stocks and some cryptocurrencies.

What you can expect from the I/O Fund Advanced Plan:

  • Weekly Webinars on macro, the broad market, as well as buy/sell targets for each of our positions, plus quarterly portfolio reviews on the growth tech stocks we are interested in.
  • Technical Analysis on all I/O Fund stocks and Broad Markets, with charts on all major US markets, analysis of inflation and growth, as well as bonds, commodities, futures and more! We use these markets to help better understand the macro landscape, which guides our buys/sells. 
  • A Completely Transparent Portfolio made up of growth tech stocks PLUS crypto that is actively managed by one of the best growth Portfolio Managers in the business!
  • Trade Alerts are sent in real time directly to your phone via SMS and email.
  • NEW! Automated Hedge with advanced signals to help spot approaching risk in the markets, with a 72% win rate going back to 2003 with only 45 signals triggered.

Ready for more? Here’s what you're missing from I/O Fund Advanced:

1. Fully Transparent Portfolio

I/O Fund Advanced has full access to a live portfolio with approximately 15 long-term positions. This portfolio is the culmination of all analysis with a minimum time horizon of +5 years. Our highest convictions can be found listed by percentage of allocation. Similar to Wall Street funds, we vote on our convictions with real money and full transparency.

One unique benefit to our site is that we continually look for good entries into stocks we recommend, as well as places to trim when the broad market appears to be risky. We do not simply give blanket buy recommendations on stocks we covered years ago rather we transparently show you our risk management strategies in real-time.

2. Institutional-Level Research at your Fingertips

You will have full access to a library of research and original analysis by Beth Kindig, Knox Ridley, and Royston Roche on this site. We are confident that nothing like Beth and Knox’s research exists outside of institutions, and many institutions follow our research. Knox’s technical analysis perfectly complements Beth’s fundamental research, giving you the best research on the market.

3. Real-Time Trade Notifications and Advanced Market Signals

We raised the bar by offering real-time trade notifications in our Advanced Market Signals room and every time we enter and exit a position. Each buy or sell is discussed by our portfolio manager at the time of execution through forum posts and webinars. We offer the highest level of transparency possible so you will know if the I/O Fund team is buying, selling or if we feel the market requires no action at all. We are not licensed financial advisors, rather we offer the real-time trades we do on our portfolio to help our Members gauge the current market.

4. Markets Update

Markets are dynamic and fluid systems. They can and do go down on good news and up on bad news and act in seemingly irrational ways. Because of this, we offer regular market updates with key price levels, probable scenarios and likely outcomes based on our intermarket analysis. We also will offer periodic updates on current events, as well as pre-earnings analysis for all of our positions.

5. Webinars

I/O Fund Advanced offers webinars to go over key positions, any entries we are planning and/or exits plus 1-hour intensive deep dives, followed by a Q&A. You’ll get transparent information on the positions we plan to add to, the positions we plan to cut back on, and our thoughts on the market today.
Posted in About, ResourcesLeave a Comment on Thank you for joining I/O Fund Essentials!

I/O Fund Outperforms Leading Active Tech Funds in 2021

Posted on April 24, 2022June 30, 2026 by io-fund
I/O Fund Outperforms Leading Active Tech Funds in 2021

I/O Fund Outperforms Leading Active Tech Funds in 2021

Despite a difficult year for tech stocks, the I/O Fund releases exceptional 2021 results

This press release was originally published on Apr 20, 2022 on Business Wire.Business Wire.

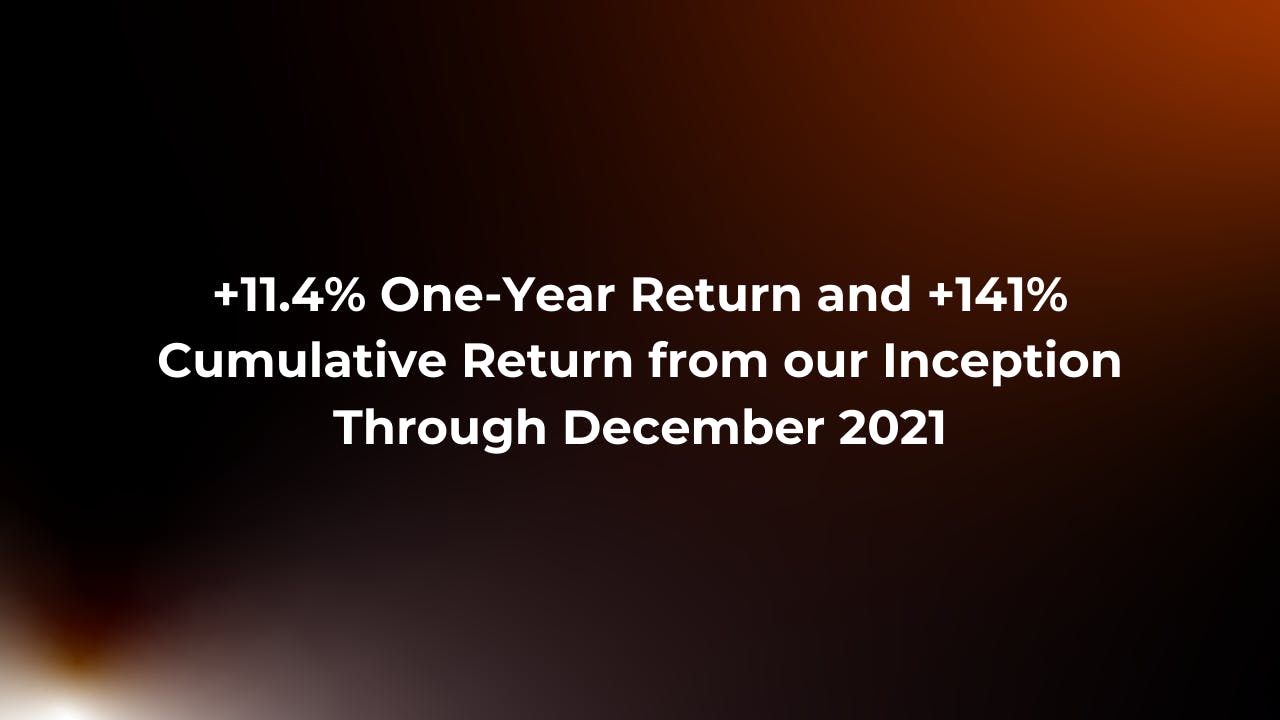
SAN FRANCISCO, CA – (BUSINESS WIRE) – I/O Fund, an actively managed tech portfolio that provides in-depth stock investing research and real-time trade alerts for retail investors, announces a 11.4% return for 2021 and 141% cumulative return from its inception through December 31, 2021. ​​Both figures do not include dividends. These returns were independently audited, and prove I/O Fund’s expertise in the world of tech. 

I/O Fund’s success comes from being first to trends and confidently holding high allocations. In 2021, the all-tech portfolio held an allocation of 30% across leading semiconductor companies and 20% in blockchain assets. The I/O Fund was able to pull ahead of institutional competitors by tactfully selecting leading tech stocks that outperformed in a year when high beta was out of favor.

The 2021 annual report reflects the I/O Fund’s fluency in technology during a turbulent year for tech stocks as the +11.4% returns were nearly 40% higher when compared to popular tech ETFs. On a cumulative basis, the I/O Fund more than doubled the returns from popular tech ETFs since inception. 

I/O Fund 1-Year Returns of 11%

CEO & Lead Tech Analyst Beth Kindig has been covering crypto since 2013, which predates the Ethereum network. Kindig’s in-depth expertise helped the I/O Fund confidently add blockchain positions to an audited stock portfolio with large allocations. The company entered Bitcoin several times in 2020, with entries ranging in the $7,000s – $20,000s, and the I/O Fund rightly trimmed their exposure in Q1 of 2021 in the $52,000 to $58,000 range before the large correction began. I/O Fund premium members were notified of their every move through real-time trade alerts. 

Kindig has also written extensively on Nvidia, predicting that the company would become a leading artificial intelligence stock even when data center revenue was declining. She is a regular contributor to Forbes where she stated Nvidia would become one of the world’s most valuable companies. The I/O Fund leveraged her unique predictions across three additional semiconductor companies, which helped insulate the I/O Fund from weakness in the tech sector.

Sign up for I/O Fund's free newsletter with gains of up to 403% – Click hereSign up for I/O Fund's free newsletter with gains of up to 403% – Click hereClick here

“We firmly believe that tech will generate life-changing gains on Wall Street into the foreseeable future,” says CEO & Lead Tech Analyst Beth Kindig. “We strive to become a valuable resource — and an important alternative to ETFs —- for individuals and funds who are determined to participate in this highly rewarding, albeit volatile, sector.” 

The company also called the two best performing cloud stocks of 2021 – Asana and Datadog. The I/O Fund sold into strength several times, then finally closed their position in Asana with a 286% gain. Datadog was initially bought during the Covid lows at $34.90 with I/O Fund Portfolio Manager Knox Ridley adding to the position several times in 2021, which went on to provide an 80% gain for 2021.

“Our success is largely due to allocations and position sizing,” says Portfolio Manager Knox Ridley. “We were not immune to the tech selloff, rather we use risk management to reduce its impact. Ultimately, we are committed to the tech sector as the world’s leading industry even amidst the current macro headwinds, as we believe the time to be accumulating tomorrow’s FAANGs is when the market is selling out of them.”

The I/O Fund hires an independent accounting firm to conduct its periodic audits. It reviewed statements from January 1st, 2021 to December 31st, 2021 from the fund’s brokerage and blockchain accounts and found no discrepancies.

The I/O Fund publishes institutional-level research in a free weekly newsletter. Premium members have full access to a completely transparent portfolio of 20+ positions, webinars, institutional-level research, real-time trade notifications, and more. 

For more information about I/O Fund, please visit: https://io-fund.com/premium-services-sign-up 

For media inquiries, email us at media@io-fund.com.

Posted in About, Press ReleasesLeave a Comment on I/O Fund Outperforms Leading Active Tech Funds in 2021

I/O Fund Blows Away Competition on One-Year and 2021 YTD Returns

Posted on November 18, 2021June 30, 2026 by io-fund
I/O Fund Blows Away Competition on One-Year and 2021 YTD Returns

I/O Fund Announces Impressive 1-Year and 2021 YTD Returns

Actively managed fund surpasses competitors, including those backed by major corporations

November 15, 2021 09:00 AM Eastern Standard Time (originally published on Business Wireoriginally published on Business Wire)

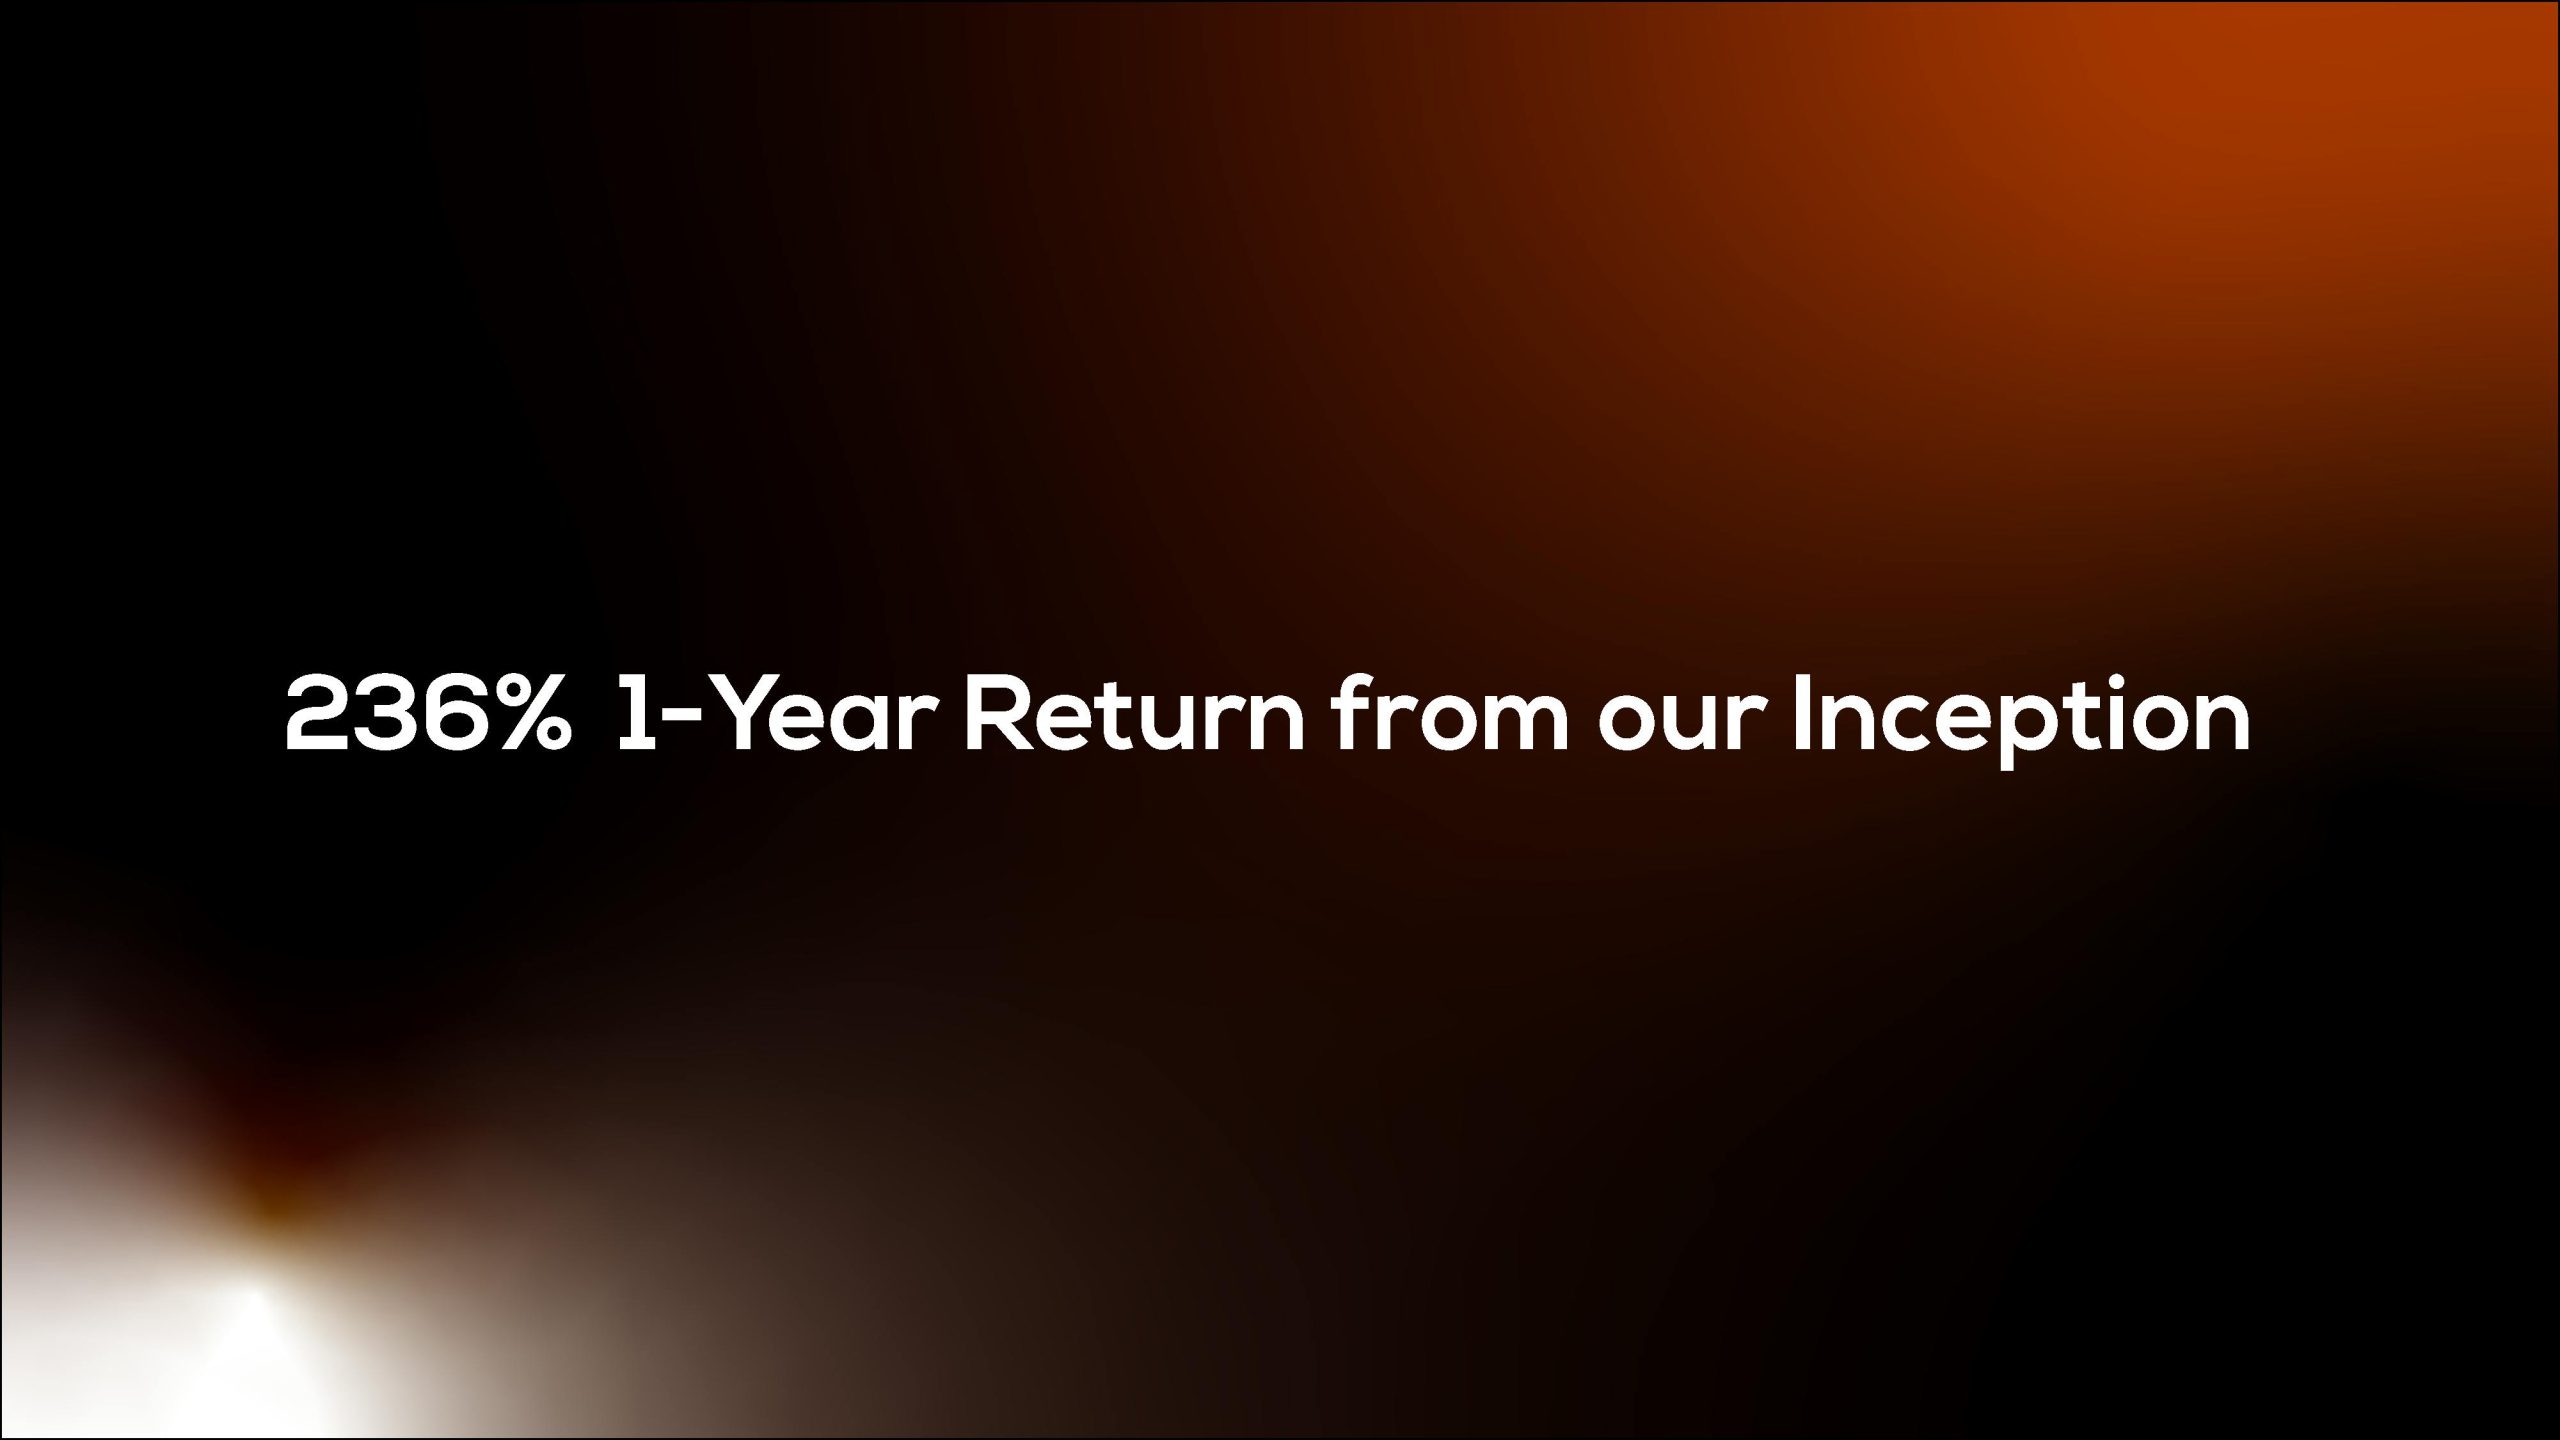
SAN FRANCISCO–(BUSINESS WIRE)–I/O Fund, an actively managed tech portfolio that provides in-depth stock investing research and real-time trade alerts for retail investors, announces a 236% 1-year return from its inception through May 7, 2021*, and a year-to-date cumulative return of 28% through July 31. Both figures do not include dividends. These results, confirmed through recently completed independent audits, reflect I/O Fund’s record as a performance leader in actively managed funds.

I/O Fund 1-Year Returns of 236%

I/O Fund credits much of the positive gains to being first to trends across blockchain, semiconductors, cloud and ad-tech, and being confident in holding high allocations of up to 21% in a single category. The fund’s performance across three reviews in its first 18 months is reflective of the company’s fluency with the ever-expanding tech landscape and ability to form a winning portfolio.

I/O Fund’s team of experts championed how to add Bitcoin to a stock portfolio in 2019 and properly allocated to this asset. The fund saw gains from these assets in February through early May, trimmed in the $52,000 to $58,000 region and then began to buy back into the asset when it was valued between $31,000 and $40,000. Entries and exits are shared with premium subscribers in real-time. I/O Fund’s analysts saw long-term value in cryptocurrency, sticking with the investments despite drawdowns of 40% to 50%.

The company also built a leading Nvidia position starting in 2019 with a 9% allocation to-date by using in-depth technical stock analysis to predict Nvidia would become an AI leader in the data center. This analysis was highly contested as Nvidia had declining data center revenue in 2019 when the I/O Fund built this key position.

“At I/O Fund, we believe tech requires a lead analyst with direct yet broad experience in the industry,” said Beth Kindig, founder and CEO of I/O Fund, who also serves as the company’s lead tech analyst. “This makes our investment strategy more advanced and can lead to higher returns.”

I/O Fund’s performance over its first year blew away the competition. Its portfolio return of 236% bested the closest institutional competitor by more than 100% and other funds by even larger margins over the May 9, 2020, to May 7, 2021, time frame.

The 2021 YTD report proves that I/O Fund kept its momentum as a leader in researching and forecasting tech growth stocks. Its 28% return, amid a difficult year for tech stocks, either tied or surpassed every other competitor.

“Conviction is key to sticking with a company over the long-haul, regardless of drawdowns; however, the market will always tell you what sectors and stocks are being favored today, which is where we shift focus,” said Knox Ridley, Portfolio Manager of I/O Fund. “We use relative strength screens to add to winners, as well as technical analysis to help us reduce risk when sentiment appears to be shifting.”

Kindig and her team credit I/O Fund’s retail influence to its growing, passionate base of stock newsletter and premium subscribers. The team is dedicated every day to continue outperforming the large corporations I/O Fund competes with.

Sign up for I/O Fund's free newsletter with gains of up to 403% – Click hereSign up for I/O Fund's free newsletter with gains of up to 403% – Click hereClick here

“We are all trained to believe that ‘smart money’ knows more than retail,” Kindig noted. “However, we wanted to test that notion by forming a small team of experts who care very much about their chosen specialty. The market knows how to keep you humble and so we will continually strive to improve. We are not only a site that celebrates the wins, but we also show you how we manage losses – all in real-time.”

"The market knows how to keep you humble and so we will continually strive to improve. We are not only a site that celebrates the wins, but we also show you how we manage losses – all in real-time.” – Beth Kindig

I/O Fund hired an independent accounting firm to conduct all three audits. It reviewed statements dating back to May 2020 from the fund’s brokerage and blockchain accounts and found no discrepancies.

For more information about I/O Fund, please visit https://io-fund.com/premium-services-sign-up.

This press release article was originally published via businesswire.com on November 15, 2021, 09:00 AM ET and featured in MarketWatch.

*Corrections: We had a 236% 1-year return from inception through May 7, 2021, not May 7, 2020.

You can learn more about the IO Fund’s 2021 performance here. In it, we discuss which trends worked for our investment strategy, and how we pick winners in the different tech industries. We also discuss our crypto strategy: YO/LO, which stands for “You Only Live Once” to help encourage our readers enter the cryptocurrency market.

About I/O Fund

I/O Fund is an actively managed portfolio that offers in-depth research within and real-time trades. We specialize in tech microtrends and have outperformed popular tech-focused innovation funds since our inception in 2020 with audited performance results. I/O Fund empowers retail investors by offering a transparent portfolio alongside institution-level research and real-time notification of entries and exits. We also offer a free public newsletter with past stock coverage that included Roku at $33, Zoom at $137 and Nvidia at $31.50. Premium members are notified of lower entries, including Zoom at $62 and Bitcoin at $7,700.

Get Started with Premium

Investor Relations

Media Contact
Media@io-fund.com

Share this Article

Posted in About, Press ReleasesLeave a Comment on I/O Fund Blows Away Competition on One-Year and 2021 YTD Returns

Don’t Miss Your Free Stock Analysis

Posted on July 14, 2021June 30, 2026 by io-fund
Don’t Miss Your Free Stock Analysis

Whitelisting I/O Fund Instructions

Some of our subscribers have shared their concerns about not receiving I/O Fund’s Free Newsletters anymore. We understand how important this issue is and want to show you a process called “whitelisting.”  Going through this one-time process will help prevent future I/O Fund stock analysis from getting lost in your spam folder.

How to Whitelist I/O Fund Newsletters by Popular Email Services:

Below, we cover how to whitelist our emails in Gmail, Outlook, Yahoo, Mobile, and other email clients.

Gmail Whitelisting Options

  1. ADD A NEW CONTACT
    From your Gmail: Select Hamburger Menu → Contacts → Create Contact
    From your browser, go to: contacts.google.com → Create Contact
  2. CHECK YOUR SPAM
    Go to your Spam folder → Mark I/O Fund content as Not Spam
  3. REVIEW EMAIL PROMOTIONS
    Drag-and-drop the email from your promotions tab into your primary tab.
    A notification prompt will ask you if you want to do this for all future messages from Newsletter@io-fund.com, select yes.
  4. CREATE CUSTOM FILTER
    Select your Gmail settings (cogwheel icon)
    Find your Filters and Blocked Addresses menu
    Click "Create a new filter" → in the From field, type: Newsletter@io-fund.com → Click Create Filter again → Check the box "Never send it to Spam" → Press the final Create filter button to save.

Outlook Whitelisting

Update your email settings to establish who you want to block or allow.

Yahoo Whitelisting

Check sender details i.e.  the “To: and From:” sections, press + to “Add to Contacts.”
For more Yahoo help, you can manage your Yahoo spam and mailing list here.

Mobile Whitelisting for Android and iOS Devices

On mobile devices, tap the sender’s display picture or icon and it should populate options to “Add Contact” by creating a new contact or saving it as an existing one.

Watch Whitelisting Video Tutorial

3 Easy Ways to Whitelist Across Email Clients

If you use an email client, i.e. an application to manage your emails from multiple providers, you can use any of the three options to whitelist I/O Fund from your email application.

  1. ADD US AS A CONTACT
    Add Newsletter@io-fund.com to your contact list.
  2. REPLY TO ONE OF OUR EMAILS!
    Search your inbox for Newsletter@io-fund.com. After you find one of our emails, reply to the email with feedback or questions! When you reply to an email, it indicates the sender is someone you trust.
  3. REPORT AS NOT SPAM
    Scan your spam folder for an email from Newsletter@io-fund.com. Report the email as “Not Spam” or “Move to Inbox”

A note for users whitelisting through email clients: if you still notice I/O Fund emails skipping your inbox, you may need to follow whitelisting instructions at the email provider level that was covered at the beginning of the article.

What to do after you whitelist Newsletter@io-fund.com

Monitor your inbox in the weeks to come to see whether you’re getting your latest premium content. If for some reason you are still not receiving premium content notifications, please email us at newsletter@io-fund.com and someone from our team will verify if you’re still subscribed to our updates.

Do I need to whitelist Newsletter@beth.technology?

We are no longer publishing under Beth.Technology ; however, it doesn’t hurt to follow the steps above to whitelist the email addresses at the same time!

Posted in About, Company, TutorialsLeave a Comment on Don’t Miss Your Free Stock Analysis

New Forum Instructions

Posted on June 23, 2021June 30, 2026 by io-fund

Thanks for everyone’s patience.

We have decided to launch a very basic version of the forum and then add features every 1-2 days to avoid any crashes or bugs.

You can check out the new forum here: https://wire.io-fund.com

We’d like one more day to import the data from the old forum. We plan to start posting on Thursday, June 24th so please use Tribe for one more day.

As you’ll see, we are calling this a Wire rather than a Forum as we have begun to rely on the transmission of information on the community site. I find myself not wanting to miss out on the information posted on the forum and we think the word Wire best represents the critical and professional nature of the community.

Some bullet points:

  • Downvote and Upvote is enabled. Similar to Reddit or HackerNews, the forum will be organized by which posts are the most popular.
  • We are launching with “Trending” but plan to add “Most Recent” and “Most Popular” for sorting the posts. You will be able to quickly click through these three ways to sort the posts.
  • Bookmarks are enabled right now so if you like a post and want to save it for later, you can hit the upper right tab and it will save to your bookmarks.
  • You’ll be gaining points as you post. We will call this “equity” rather than “karma.” The benefit of this is that those who are down voted will see the effects of posting against our Forum Guidelines. On that note, the Forum Guidelines were written with the group in mind and after getting quality feedback from our members.
  • Formal moderation is coming soon. If the flag button is hit enough times by enough members, then the post will be removed until it can be moderated by our team.
  • I/O Fund Activity and Stock Setups in the menu will allow you to reference I/O Fund posts quickly. Knox’s trade setups will be going in the right hand where it says RECENT TRADE NOTIFICATIONS. These will automatically post when you get the SMS/email notification and will remain on the right side as you scroll through other posts.
  • You’ll see a placeholder for Crypto. The plan is to allow subscribers to either opt-in or opt-out of crypto posts so you have a choice as to whether you see those or not. This will go live in the next 1-2 weeks.
  • Slack and Mailchimp APIs are coming in the next 1-2 weeks to help you set alerts. For instance, you can get a weekly email of the top-ranking posts.
  • The New Members tab will be a separate space for New Members to voice questions. This will hopefully alleviate the influx of posts we get on the main feed.
  • You will have the ability to DM each other in the next couple of weeks.

Thanks again for your unwavering patience on this!

Posted in About, Company, Stock Updates (Blogs)Leave a Comment on New Forum Instructions

Beth.Technology Announces Major Rebrand to I/O Fund

Posted on April 14, 2021June 30, 2026 by io-fund
Beth.Technology Announces Major Rebrand to I/O Fund

Beth.Technology Fund has unveiled a new name, I/O Fund, new website, and audited 2020 returns as part of an extensive rebranding initiative.Beth.Technology Fund has unveiled a new name, I/O Fund, new website, and audited 2020 returns as part of an extensive rebranding initiative.new website, and audited 2020 returns as part of an extensive rebranding initiative.

April 14, 2021 07:30 PM Eastern Daylight Time (originally published on Business Wireoriginally published on Business Wire)

SAN FRANCISCO–(BUSINESS WIRE)–Beth.Technology, an actively managed tech fund that offers in-depth research and real-time trades, has completed an extensive rebranding initiative to reflect the company’s comprehensive services, team-oriented approach, and vision for the future. The rebrand includes a new logo, updated website, and a new name: I/O Fund.

“We evolved from a tech insider with a blog to a full-service fund with an expert team. Our brand is built on credibility, transparency, and industry knowledge. I’m proud to offer these benefits and raise the bar on tech analysis for retail investors.”

I/O Fund empowers retail investors by offering an actively managed and transparent portfolio alongside institution-level research and real-time notification of entries and exits. The I/O Fund specializes in tech microtrends and has outperformed other popular tech focused innovation funds on the market. I/O Fund competes at the highest level and offers full transparency for individual retail investors.

The I/O Fund also features a free public newsletter with past stock coverage that included Roku at $33, Zoom at $137, and Bitcoin around $9,500. Premium subscribers are notified of even lower entries, such as Zoom at $62, and Bitcoin at $7,700.

With audited returns of 115.5% from May 9, 2020 to Dec. 31, 2020, I/O Fund outperformed popular tech focused innovation funds within the same time frame. The actively managed fund was founded on May 9th, 2020 following the launch of the premium service on July 15, 2019.

“This rebrand reflects a significant step forward in our evolution, redefining who we are as a team and as a company,” said I/O Fund Founder and CEO Beth Kindig. “We evolved from a tech insider with a blog to a full-service fund with an expert team. Our brand is built on credibility, transparency, and industry knowledge. I’m proud to offer these benefits and raise the bar on tech analysis for retail investors.”

Lead Analyst and CEO, Beth Kindig, uses fundamental analysis at I/O Fund to identify the leaders of the most important tech microtrends. Then Portfolio Manager, Knox Ridley, uses technical analysis to guide entries, exits, risk management, and provide market commentary on the decisions the I/O Fund makes in the actively managed portfolio.

“At I/O Fund our goal is to get outsized returns—without excessive risk-taking —by predicting future tech leaders before the run, and spotting periods of market weakness before they happen,” Knox Ridley said. “We share that knowledge with our readers, alongside real-time entries and exits in I/O Fund, so they see how decisions are made when running a competitive growth portfolio that exceeded the best funds on Wall Street last year. To communicate this expanded vision, the fund needed a new identity. I’m extremely proud of our team, and our market-beating results.”

This press release article was originally published via businesswire.com on April 14, 2021 07:30 PM ET.

For more information about I/O Fund's premium services, visit: https://io-fund.com/pricing

About I/O Fund

I/O Fund is an actively managed fund that offers in-depth research and real-time trades. We specialize in tech microtrends and have outperformed popular tech focused innovation funds since our inception with audited performance results. I/O Fund empowers retail investors by offering a transparent portfolio alongside institution-level research and real-time notification of entries and exits. We also offer a free public newsletter with past stock coverage that included Roku at $33, Zoom at $137, and Bitcoin at $9,500. Premium members are notified of lower entries, including Zoom at $62, and Bitcoin at $7,700.

Contacts

media@io-fund.com

Audited Results from I/O Fund

Read Beth.technology's full rebranding story and audited fund performance.

Please note: The I/O Fund conducts research and draws conclusions for the Fund’s positions. We then share that information with our readers. This is not a guarantee of a stock’s performance. Please consult your personal financial advisor before buying any stock in the companies mentioned in this analysis.

Download Press Release

00295c01-6b37-46f5-b8d4-a75c79027d54_Beth.Technology+Announces+Major+Rebrand+to+I_O+Fund+_+Business+Wire_+Press+Release+_IO-Fund.com.pdf

Posted in About, Company, Portfolio, Press ReleasesLeave a Comment on Beth.Technology Announces Major Rebrand to I/O Fund

Basic Concepts in Technical Analysis

Posted on June 15, 2020June 30, 2026 by io-fund

Stop (or stop loss) –Stop (or stop loss) –a means to manage risk. If I buy a stock at $10, and place a stop at $9 (closing price). Then, if at any point my position closes the day below $9, the next day, I sell at the market with no questions asked.

We believe it is better to stop out of a position early and miss a few percentage points on the rally when it resumes (if we were to miss the new momentum by a couple of days). This is a better alternative to being stuck in a stock wishing we could get out.

It is more difficult to make up for losses than to make up gains. For example, if a position is down 50%, then you must go up 100% to make back the loss. If a position is down 80%, you must go up 400% to break even from that loss.

We use this technique on opening positions because we want to manage our potential losses. Substantial losses are difficult to overcome, so we attempt to mitigate this with using stops (as well as other techniques).

  • Once a stock is up significantly and our product-first fundamental thesis has proven to be accurate, we will remove the stop.
  • We then shift and hedge these “buy-and-hold” positions collectively.

After witnessing first hand many advisors and their clients’ getting wiped out in 2008, it became clear to me that everyone has an entry plan, but most of the PMs I met with neglected an exit plan. Losses most people experienced in 2008 take years to make up, and in some cases cannot be recovered. This is why all great money managers stress the importance of managing risk first and foremost.  

No system is perfect. We have found that managing risk by sacrificing some gains is a winning strategy, especially in the tech space.

Uptrend Uptrend – when price makes a series of higher highs and higher lows. Also, the various moving averages will be stacked on top of each other and trending with the shortest time frame on top and the longest time frame on the bottom.

DowntrendDowntrend – When price makes a series of lower highs and lower lows. Also, moving averages reverse to where the longest time frame is on the top and the shortest time frame is on the bottom.

Consolidation Consolidation – This is when an uptrend or downtrend pauses and moves in a sideways pattern. Price tends to be choppy. Also, note how the various moving averages swirl around one another in a disheveled order.

Support Support – A horizontal price level where buyers/demand steps in and halts a decline. Sellers become exhausted and buyers overwhelm the decline in price. Once a support region is broken, it becomes resistance.

Resistance Resistance – A horizontal price level where excess supply stops price from moving up. Buyers get exhausted and sellers step in. Once a region that is resistance is broken, it acts as support.

GapGap – This is literally a gap in price between trading days. For example, if a company reports stellar earnings and the price opens up, say, 20% above the close of the prior day, you’ll literally see a gap on the chart. There is a saying that price does not like gaps. These emotional points in a stock’s price movement can act like magnets, attracting price to “close the gap,” before continuing on a trend. Gaps are important points of support and resistance, as well.

Moving AveragesMoving Averages – a moving average represents the average price over a given time period. For example, a 5-day moving average is simply the closing price of an asset over a 5-day period, divided by 5. The next day, you add a new number to the average on the front end and get rid of the last number on the back end. So, it’s a fluid price, changes each day and provides valuable information about the short, intermediate and long-term trend as well as key support and resistance zones. The most important aspect of these averages is the direction they are pointing and the slope. The sharper the slope, the more powerful the trend.

Simple moving average (SMA) is created by taking the average price over a given period. 50-day, 100-day, and 200-day moving averages are widely followed averages to determine support and resistance points as well as key trends. Each day’s price is given equal weighting in determining the average price of a simple moving average. I use these to determine longer time frames.

Exponential moving averages (EMA) is like the simple moving average, but gives more weight to the most recent days. Past data is not as important as what is happening now. These are more geared towards determining the current trend on shorter time frames.

For the sake of this site, I use the 8-day EMA (green), 20-day EMA (blue), 55-day EMA (red), and the 200-day SMA (black). I will sometimes use the 150-day SMA, as well.

Anchored Volume Weighted Moving Average (AVWAP)Anchored Volume Weighted Moving Average (AVWAP) – A volume weighted moving average is a simple way to determine who is in control of price between the bulls and bears. This method factors in volume as well as price. For example, if one day you have 3 shares trade at $10 and the next day you have 1 share trade for $5, then the average volume weighted price is $8.75 (10+10+10+5 divided by 4).

The “anchored” element of this technique allows you to literally place the beginning of the calculation from any point in time – e.g., a top, bottom or maybe a gap in price.

It’s uncanny how accurate this method is for determining key support/resistance levels.

Trend lineTrend line – a dynamic, sloping line that price uses as support or resistance while trending. A stock’s movement will track this line throughout the trend.

VolumeVolume – The number of shares that have traded for a particular stock. Volume tells an important story in technical analysis. It shows the force of a price move or if a recent move is weak. For example, if price breaks through resistance on heavy volume, that tells us that several new buyers have stepped in at higher prices. We can also use volume to gauge institutional participation with huge volume spikes. Furthermore, if price is increasing while volume is decreasing, it is telling us that not many buyers are stepping in to support the elevated prices.

Cup & Handle PatternCup & Handle Pattern – a bullish pattern where price hits resistance, sellers step in with force, hit a support region, then buyers push price back to the resistance zone. Another sell off then follows, except with less volume. We then see price break through resistance on heavy volume. This is usually a bullish pattern.

Head and Shoulder PatternHead and Shoulder Pattern – A bearish pattern (an inverted head and shoulder pattern is bullish). The visual is 3 peaks, the middle peak being the highest. Volume is key with these patterns. You want to see volume create a cup pattern – decreasing as prices peak and increasing into the selling. When price breaks the neckline (primary support), volume should be high.

Source: Eagle FX

Flag Pattern (continuation pattern)Flag Pattern (continuation pattern) – A pattern that is a period of congestion after a sharp move higher (or lower). Flag patterns are sideways with the upper and lower boundary lines being parallel. “Pennant” or “Wedge” Patterns are also Flag patterns with the upper and lower boundary lines converging rather than being parallel. All of these are known as “continuation patterns” as they result in the prior price trend continuing in the same direction after the pattern completes.

Symmetry Symmetry – Symmetry is an important concept in technical analysis, especially with corrections. Correction tend to unfold in 3 legs (or waves in Elliott Wave Theory) and each leg relates to the others symmetrically. Prices also tend to form symmetries in time between bull/bear markets.

Basing Basing – is a pattern we look for to gauge a potential breakout. It is when a stock pulls back, holds support around a specific price zone multiple times and holds each time. Also, volume should be fading the more attempts price corrects into the support zone. Ideally, you want to see lower volume and smaller pullbacks the closer you get to the upper resistance that makes up the breakout price.

Coiling/Building EnergyCoiling/Building Energy – This is a term used to indicate a momentum pattern that we see prior to a break out. I typically use the MACD to gauge this pattern, but also use the CCI as times (look below for definition of these indicators). In short, this is when the MACD has a sharp 45 degree rise with price, then falls, usually above the 0 line, and holds in a horizontal level. This allows the technicals to reset for another move higher.

Indicators

If price were a person, then indicators read the vital signs. Indicators look under the hood of a trend to see if it is healthy or weak. They also provide crucial information about trend reversals as well as trend continuations.

There are three general classifications of indicators: momentum, which looks at the strength and direction of a trend; oscillators, which lead price and attempt to predict trend changes; volume based, which analyzes participation in a trend (these indicators are typically leading indicators and attempt to predict trend changes). There are hundreds of indicators; however, for the sake of this site, I will reference the ones below going forward.

Before I get into the indicators, there are two very important concepts that should be understood:

Negative DivergenceNegative Divergence – An important concept in technical analysis. When a momentum indicators/oscillator decreases, making lower highs, while price is increasing, making higher highs. This suggests weakness and usually leads to a correction at minimum.

Positive DivergencePositive Divergence – Refers to momentum indicators/oscillators trending up while price is trending down. This signifies that selling pressure is fading while price is hitting lower levels. It usually precedes a bottom.

Negative ReversalNegative Reversal – Not to be confused with divergence. A negative reversal occurs during a downtrend. Prices make lower highs relative to the indicator making higher-highs. This is a very powerful signal.

Positive ReversalPositive Reversal – A Positive Reversal happens in an uptrend. When the indicator (RSI in this example) makes a lower low and price makes a higher low, it usually signals that the uptrend will continue.

Relative Strength Index (RSI)Relative Strength Index (RSI) – is an oscillator that moves between 100-0. It’s used as a leading indicator of a potential trend change. It is designed to measure the internal momentum of a price series by simply measuring the speed and rate of change in a stock’s price.

The RSI measures how likely a stock is to keep heading the direction of its current trend. If it is overbought (above 70), it’s less likely to head lower. And if it’s oversold, (below 30) it’s due for a bounce back. Within uptrends, a reading of 40 tends to hold during corrections, while in downtrends, a reading of 60 tends to hold during corrections.

MACDMACD – A trend following indicator that measures the distance between two moving averages. The MACD is calculated by subtracting the 26-Day EMA from the 12-day EMA (this is the MACD line in blue).  Then a 9-day EMA is placed over the MACD line to provide buy and sell signals (in red). When the crossover occurs, these are potential buy or sell signals. 

The MACD HistogramThe MACD Histogram – is also an indicator I use, which is part of the MACD indicator. It is the green and red curves that oscillate above or below the 0 line. It was designed to help anticipate a crossover between the MACD line and the signal line. It’s calculated by measuring the distance between MACD (in blue) and its signal line (the 9-day EMA in red).

Like MACD, the MACD-Histogram is also an oscillator that fluctuates above and below the zero line. This indicator is an early warning sign for momentum fading or shifting. It works well with spotting weakness and divergences with a price increase or price decrease.

Accumulation/Distribution Index (A/D)Accumulation/Distribution Index (A/D) – this indicator gauges supply and demand by looking at where the price closed within the period’s range, and then multiplying that by volume. It was designed to be a leading indicator. The unique feature of this indicator is that it tracks the relationship between opening and closing prices intraday. If price closes higher than the open, then the A/D ticks up, and vice versa.

Opening prices tend to track pressure that has built up during the market being closed. Amateurs trading on reports/news will tend to use the opening hours to trade. Professionals trade throughout the day as well; however, the final hours, are mostly dominated by the pros/smart money. So, this gauge is a means of tracking what smart money thinks of a stock.

Chaiken Money Flow (CMF)Chaiken Money Flow (CMF) – Like the A/D indicator above, this is a volume-based indicator that looks to track the flow of money into and out of a security. However, instead of a cumulative total, seen in the A/D, the CMF sums the money flow volume for a specific look-back period, typically 20 or 21 days. The resulting indicator fluctuates above/below the zero line just like an oscillator. 

This oscillator is a great leading indicator that helps identify when a range bound stock is likely making a breakout move.

Money Flow Index (MFI)Money Flow Index (MFI) – Like the RSI, this indicator uses price to identify overbought and oversold conditions. However, unlike the RSI, this indicator also factors volume into its equation.

This indicator attempts to be a more meaningful leading indicator based on the idea that volume leads price. Because the MFI factors in volume, there is a sentiment component to it, so it factors in the accumulation at specific price points. In essence, it helps measure enthusiasm for a stock. When it is showing overbought/oversold or negative/positive divergences, it is more meaningful than the RSI, and usually holds more weight than a divergence on the RSI.

Commodity Channel Index (CCI)Commodity Channel Index (CCI) –Is a momentum oscillator that can be used to also show overbought and oversold conditions, as well as divergences. The CCI measures the difference between the current price and the historical average price. When the CCI is above zero it indicates the price is above the historic average. When CCI is below zero, the price is below the historic average. This indicator is also great for spotting new trends developing.

Candlestick Patterns

Candlestick PatternsCandlestick Patterns – Candlesticks are a visual representation of buying and selling within a given time period. On a daily bullish candlestick, the body of the candle opens at the base and closes at the peak of the body. The wicks that extend above and below the body represent the high and low of the day.

Source: Wikipedia

These patterns offer valuable information about the battle between buyers and sellers, which can be used to predict trend changes. There are numerous patterns; some of the ones I use are below.

Kangaroo Tail

Source: Trade Street

Engulfing PatternsEngulfing Patterns – the bigger the engulfing candle the more notable of a signal. Also, the more volume the signal is based on the number of days the candle engulfs.

Source: Trade Street

Hammer and Shooting Star PatternsHammer and Shooting Star Patterns – These indicate a strong rejection of a price advance. A hammer pattern signals that buyers have stepped in with force, and it can signal a bottom in a downtrend. A shooting star is the reversal of this pattern in an uptrend. Sellers step in with force, signaling a strong resistance level. These patterns can precede a trend change.

Source: Medium

Island Top ReversalIsland Top Reversal – This pattern occurs when price gaps up, then trades in a consolidation pattern/sideways. Then price gaps back down on heavy volume. This price usually precedes a reversal in a trend.

Source: All Charts

If you have any questions, you can reach out to us in our Chat Room on the forum, or email us directly at knox@beth.technology and beth@beth.technology. We only work with tech stocks on this site. We are not financial advisors, so we cannot offer personalized advice. We limit our analysis to what we believe and are actively doing with our own funds. We are happy to help with anything tech related.

Posted in About, Glossary, InvestingLeave a Comment on Basic Concepts in Technical Analysis

Thank you to all of our subscribers in 2019. What to Expect in 2020.

Posted on January 9, 2020June 30, 2026 by io-fund

We want to extend a warm appreciation to our subscribers this past year. Since launching in July, the site has completely exceeded our expectations. We are keenly aware of the contributions all of you have made in helping this site become possible.

When we first set out, our goal was to take a stock picker who has analyzed technology and products for nearly a decade and combine this skillset with a calculated, technical trader. We think we’ve done a decent job of delivering bullish ideas this year with a wide range of analysis.

Here’s a snapshot of our coverage this past year:

  • Snap
  • Roku/TTD
  • Alibaba
  • Chainlink
  • Nvidia
  • Microsoft
  • Uber
  • Nvidia
  • Shopify
  • Slack
  • Zoom Video
  • Telaria

You can check out Knox’s 2019 track record trading off my analysis here.

What to Expect in 2020

We are both dedicated to improving the site in 2020. For starters, we have been working on algorithmic safety nets to keep us in long positions longer and to help exit losing positions faster. We’ve been working on this system for months and it will become a premium benefit for subscribers that Knox will help to spearhead. Once we have this in place, we will begin to launch portfolios on various categories.

Please keep in mind that we write for both styles: buy and hold, as well as some active trading. When we recommend stops, we are simply making sure to provide the exit plans we use ourselves if there is an unforeseen market event. This ensures we lose no more than 10-30% while letting our winners run.

Stock Lists

Recently, we published a 2020 cloud software list followed by a few PDFs. We think cloud software has more room in 2020 than the market currently has priced in, and this is one reason we’ve been focused on this category.

We plan to publish similar lists for future technologies, such as 5G, artificial intelligence, and blockchain. We will also publish more lists for common categories, such as semiconductors, finance tech (fintech), and a high conviction list (a conviction ranking has been requested a few times by our readers). We will start with the lists we think are most time sensitive.

These lists achieve a few things:

  • Creates a master index of stocks in a category
  • Organizes companies the market is most likely to reward based on financial strength
  • Organizes which companies are most likely to surprise the market based on product strength
  • Helps to track which companies are breaking out
  • Short-lists the best companies if a trend breaks out
  • Help to keep companies on our radar even if we haven’t been able to cover them with a full-length analysis just yet

We Appreciate Your Referrals

Paraphrasing on forums or social media about any wins you’ve had from our service is encouraged and much appreciated. We greatly appreciate all of the referrals you’ve sent us. We couldn’t do this without you.

Analysis can be a competitive field. We only provide original analysis, which requires domain technology experience and is incredibly time consuming. For this reason, please do not share the links to the lists or PDFs (i.e. the verbatim analysis).

We honor the premium site far and above our free analysis. In fact, I’d say my free analysis has suffered a bit since launching the premium site as I am giving my best ideas to the premium members. You will see me publishing more on Forbes this year, as well as MarketWatch, but my best work goes to the premium site.

Thanks Again …

Our mission is to help you make as much money as possible in the tech sector – and to provide value that goes above and beyond your subscription.

Our plan is to far exceed what we did in 2019 with in-depth tech analysis on companies you won’t find elsewhere and to combine this with smarter and sharper entries.

Thank you again for your vote of confidence and subscribership.

Beth Kindig

Posted in About, Company, Stock Updates (Blogs)Leave a Comment on Thank you to all of our subscribers in 2019. What to Expect in 2020.

August 2nd – Technical Analysis Update

Posted on August 2, 2019June 30, 2026 by io-fund

To improve accuracy and lock-in more gains, Research Services combines fundamental analysis and technical analysis on tech stocks.

The market broke through the 21-day and 50-day exponential moving averages, which is a psychological shift for the rally we’ve been experiencing. 2940 is an important number. If we close below 2940, which is may happen based on today’s actions, we should see 2900 rather quickly.

We are still in the probability of extremes. According to the methodologies I use, the market could go to as low as 2100-2300, which would be a reversion to the mean, or it can take us to the 3700-4200 region, and possibly higher, for one final bull push. I believe the bull market that began in 2009 has one final push left, and will do one of the three:

  • Most likely scenario is we retreat to 2600 before the last push towards 3700-4200
  • Lower probability: see SPX visit 2100-2300 and then resume the rally to 3700-4200
  • Lower probability: we go directly to 3700-4200 from here with normal corrections along the way.

Technicals Summary:

More comments on these stocks are located in the forum. It’s important that you follow the forum if you are interested in a specific stock.forum. It’s important that you follow the forum if you are interested in a specific stock.

Snap:  If we break $16.20 we will likely retest $14.  Snap has been strong at the $17 support.  I closed out my calls after earnings and am staying long in my other position for now. If we break the $16.20, I’ll sell half my long position and maintain a 35% trailing stop on the remainder. I usually do not like to time my entire position twice (selling and buying again) if my plan is to buy again.  However, with the market behaving the way it is this week, coupled with other metrics I follow, I want to lock in gains.  A wide trailing stop is a good idea and buying Snap on a market pullback is also a good idea.

Google: We still can see Google as low as $900 or as high as $1300 – follow me on the forum for updates. We think the privacy and anti-trust creates a lot of risk in this stock. 

Apple:  Apple is behaving weaker than the earnings beat calls for and this is likely due to the smartphone saturated outlined in the fundamental blog we sent prior to earnings. Apple is testing the $200 support as we speak. 

MongoDB:  MDB is tightly trading at the $141 region we highlighted.  It is currently trading just below this support as we had predicted in the MongoDB PDF analysis, and if we close below, I expect further weakness before initiating a position.

Bitcoin:  We see an entry opportunity in the $4200-$7800 range. Fundamentals to follow in the coming weeks.


My Background:

I’ve been trading on Beth’s fundamental analysis for about two years. I’ve made over 300% on Roku from the IPO by keeping some of my position in the stock during the pullback based on her analysis, plus another 200% by initiating a new Roku position and buying the dip in Q4 2018. I did not sell my position even when it lost 50% of its value bc of Beth’s high conviction.

I also made decent money on Microsoft during the Q4 pullback based on her conviction, Alibaba, Nvidia and Zoom’s IPO. I shorted Uber and Lyft based on her analysis and made roughly 20% and 15% (options weren’t available) and the only time I’ve successfully shorted Tesla was based on her analysis (I tried a few times prior) for a return of over 100% on options when price fell from $260 to $190. Overall, I’m averaging 120% returns in the last two years on my tech allocation based off Beth’s fundamentals.  

We believe Beth’s fundamental analysis combined with my technical analysis will increase gains quite a bit as we can help you find a good entry. We will offer you a shopping list if we see a pullback and we will also have a good idea of what stocks will keep winning if we see the bull market resume. 

Ideally, what I look for is to initiate entries into tech companies that are positioned to capitalize on emerging tech trends not known to the broader markets because true life changing gains can take place in the tech sector over time.  I personally will trade options, short weak stocks and hedge my longs when we are at valuation extremes, but my primary goal is to buy and hold solid tech companies at great prices. Buy and hold remains the winning strategy with one caveat – you have to be ahead of a major tech trend and choose the right company.

Posted in About, Analysts, Bitcoin, Stock Updates (Blogs)Leave a Comment on August 2nd – Technical Analysis Update

Recent Posts

  • The IPO Glut of 2020: Why Valuations Have Gone Too Far
  • Zoom Discusses Two Important Catalysts In Q1 Earnings
  • Three Risk Management Tools the I/O Fund Offers
  • Micron Is Up 900%. Here’s Why the AI Memory Trade May Still Have Room to Run
  • Credo: Reliability Leader Aggressively Moves into Optics

Recent Comments

No comments to show.

Archives

  • June 2026
  • May 2026
  • April 2026
  • March 2026
  • February 2026
  • January 2026
  • December 2025
  • November 2025
  • October 2025
  • September 2025
  • August 2025
  • July 2025
  • June 2025
  • May 2025
  • April 2025
  • March 2025
  • February 2025
  • January 2025
  • December 2024
  • November 2024
  • October 2024
  • September 2024
  • August 2024
  • July 2024
  • June 2024
  • May 2024
  • April 2024
  • March 2024
  • February 2024
  • January 2024
  • December 2023
  • November 2023
  • October 2023
  • September 2023
  • August 2023
  • July 2023
  • June 2023
  • May 2023
  • April 2023
  • March 2023
  • February 2023
  • January 2023
  • December 2022
  • November 2022
  • October 2022
  • September 2022
  • August 2022
  • July 2022
  • June 2022
  • May 2022
  • April 2022
  • March 2022
  • February 2022
  • January 2022
  • December 2021
  • November 2021
  • October 2021
  • September 2021
  • August 2021
  • July 2021
  • June 2021
  • May 2021
  • April 2021
  • March 2021
  • February 2021
  • January 2021
  • December 2020
  • November 2020
  • October 2020
  • September 2020
  • August 2020
  • July 2020
  • June 2020
  • May 2020
  • April 2020
  • March 2020
  • February 2020
  • January 2020
  • December 2019
  • November 2019
  • October 2019
  • September 2019
  • August 2019
  • July 2019
  • June 2019
  • May 2019
  • April 2019
  • March 2019
  • February 2019
  • January 2019
  • December 2018
  • November 2018
  • October 2018
  • September 2018
  • August 2018
  • July 2018
  • June 2018
  • May 2018
  • April 2018
  • February 2018
  • January 2018

Categories

  • 5G
  • About
  • Accounting Tips
  • AdTech
  • Ai Platforms
  • Ai Platforms
  • Ai Platforms
  • Ai Platforms
  • Ai Platforms
  • Ai Platforms
  • Ai Platforms
  • Ai Platforms
  • Ai Platforms
  • Ai Platforms
  • Ai Platforms
  • Ai Platforms
  • Ai Platforms
  • Ai Platforms
  • Ai Platforms
  • Ai Platforms
  • AI Stocks
  • AI Stocks
  • Analysts
  • Application Monitoring
  • Application Monitoring
  • Applications
  • Applications
  • Applications
  • Applications
  • Applications
  • Applications
  • Applications
  • AR
  • Audit Reports
  • Autonomous Vehicles
  • Autonomous Vehicles
  • Autonomous Vehicles
  • Autonomous Vehicles
  • Autonomous Vehicles
  • Autonomous Vehicles
  • Autonomous Vehicles
  • Avod
  • Avod
  • Battery Charging
  • Bear Market
  • Bitcoin
  • Bitcoin
  • Bitcoin
  • Bitcoin
  • Bitcoin
  • Bitcoin
  • Bitcoin
  • Blockchain
  • Blockchain
  • Blockchain
  • Blockchain
  • Blockchain
  • Blockchain
  • Blockchain
  • Broad Market Today
  • Bull Market
  • Bull Market
  • Chainlink
  • Chainlink
  • Chainlink
  • Chainlink
  • China Stocks
  • Cloud
  • Cloud Infrastructure
  • Cloud Infrastructure
  • Cloud Infrastructure
  • Cloud Infrastructure
  • Cloud Infrastructure
  • Cloud Infrastructure
  • Cloud Infrastructure
  • Cloud Platforms
  • Cloud Platforms
  • Cloud Software
  • Cloud Software
  • Cloud Software
  • Cloud Software
  • Cloud Software
  • Cloud Software
  • Cloud Technology
  • Company
  • Company
  • Console Gaming
  • Console Gaming
  • Console Gaming
  • Consumer
  • Consumer
  • Consumer
  • Consumer
  • Consumer
  • Consumer
  • Consumer
  • Consumer
  • Consumer
  • Consumer
  • Consumer
  • Consumer
  • Consumer
  • Consumer
  • Consumer Tech
  • Corrections
  • Crypto Investment
  • Ctv
  • Ctv
  • Ctv
  • Ctv
  • Ctv
  • Ctv
  • Ctv
  • Ctv
  • Ctv
  • Ctv
  • Cybersecurity
  • Cybersecurity
  • Cybersecurity
  • Cybersecurity
  • Cybersecurity
  • Cybersecurity
  • Cybersecurity
  • Cybersecurity
  • Cybersecurity
  • Cybersecurity
  • Cybersecurity
  • Cybersecurity
  • Data
  • Data Analytics
  • Data Analytics
  • Data Analytics
  • Data Center
  • Data Center
  • Data Center
  • Data Center
  • Data Center
  • Data Center
  • Data Center
  • Data Center
  • Data Center
  • Data Center
  • Data Center
  • Data Center
  • Data Center
  • Data Center
  • Data Center
  • Data Center and Processing
  • Data Warehousing
  • Data Warehousing
  • Data Warehousing
  • Data Warehousing
  • Databases
  • Databases
  • Databases
  • Databases
  • Dating
  • Defi
  • Digital Ads
  • Digital Ads
  • Digital Ads
  • Digital Ads
  • Digital Ads
  • Digital Ads
  • Digital Ads
  • Digital Ads
  • Digital Ads
  • Digital Ads
  • Digital Ads
  • Digital Ads
  • Digital Ads
  • Digital Ads
  • E-Commerce
  • Earning Updates
  • Earning Updates
  • Earning Updates
  • Earning Updates
  • Earning Updates
  • Earnings Report
  • Earnings Report
  • Earnings Report
  • Earnings Report
  • Earnings Report
  • Earnings Report
  • Earnings Report
  • Earnings Report
  • ECommerce
  • Electric Vehicles
  • Electric Vehicles
  • Electric Vehicles
  • Electric Vehicles
  • Electric Vehicles
  • Electric Vehicles
  • Electric Vehicles
  • Energy Stocks
  • Enterprise
  • Enterprise
  • Enterprise
  • Enterprise
  • Enterprise
  • Enterprise
  • Enterprise
  • Enterprise
  • Enterprise
  • Ethereum
  • Events1
  • Events1
  • Exchange
  • Faq
  • Finance
  • Financial Analysis
  • Financial Analysis
  • Financial Analysis
  • Financial Analysis
  • Financial Analysis
  • Financial Analysis
  • Financial Analysis
  • Financial Analysis
  • Financial Analysis
  • Financial Analysis
  • Financial Analysis
  • Financial Analysis
  • Financial Markets
  • FinTech
  • Fundamental Analysis
  • Gambling
  • Gaming
  • Genomics
  • Glossary
  • Green Energy
  • Growth Stocks
  • Growth Stocks
  • Growth Stocks
  • Headsets
  • Headsets
  • Health Tech
  • Hydrogen
  • Identity
  • Identity
  • Identity
  • Inflation
  • Inflation
  • Inflation
  • Internet of Things
  • Interviews
  • Interviews
  • Interviews
  • Interviews
  • Investing
  • Investing
  • Ltbh
  • Ltbh
  • Ltbh
  • Ltbh
  • Ltbh
  • Macro Trends
  • Macro Trends
  • Market Trends
  • Market Trends
  • Market Trends
  • Market Trends
  • Market Trends
  • Market Trends
  • Market Trends
  • Market Updates
  • Market Updates
  • Market Updates
  • Market Updates
  • Market Updates
  • Market Updates
  • Market Updates
  • Market Updates
  • Market Updates
  • Market Updates
  • Media
  • Membership
  • Mining
  • Mobile
  • Mobile
  • Mobile
  • Mobile
  • Mobile Gaming
  • Mobile Gaming
  • Mobile Gaming
  • Multimedia
  • Music Streaming
  • NVDA | NVIDIA Corporation
  • Performance Updates
  • Pin Content
  • Podcasts
  • Podcasts
  • Podcasts
  • Portfolio
  • Premium Research
  • Press Releases
  • Press Releases
  • Productivity
  • Productivity
  • Productivity
  • Productivity
  • Productivity
  • Productivity
  • Productivity
  • Reports and Whitepapers
  • Research Services Preview
  • Resources
  • Resources
  • Semiconductor Stocks
  • Semiconductors
  • Semiconductors
  • Semiconductors
  • Semiconductors
  • Semiconductors
  • Semiconductors
  • Semiconductors
  • Semiconductors
  • Semiconductors
  • Semiconductors
  • Semiconductors
  • Semiconductors
  • Semiconductors
  • Social Media
  • Social Media
  • Social Media
  • Social Media
  • Social Media
  • Social Media
  • Social Media
  • Software
  • Software
  • Software
  • Software
  • Software
  • Software
  • Software
  • Software
  • Software
  • Software
  • Software
  • Software
  • Software
  • Software
  • Software
  • Solar
  • Solar
  • Stock Analysis PDFs
  • Stock Updates
  • Stock Updates (Blogs)
  • Supplychain
  • Supplychain
  • Supplychain
  • Supplychain
  • Supplychain
  • Supplychain
  • Svod
  • Svod
  • Svod
  • Svod
  • Svod
  • Svod
  • Tech Podcast
  • Tech Stock News
  • Tech Stock News
  • Tech Stock News
  • Tech Stock News
  • Tech Stock News
  • Tech Stocks
  • Tech Stocks
  • Tech Stocks
  • Tech Stocks
  • Tech Stocks
  • Tech Stocks
  • Tech Stocks
  • Tech Stocks
  • Tech Stocks
  • Tech Stocks
  • Tech Stocks
  • Tech Stocks
  • Tech Stocks
  • Tech Stocks
  • Technical Analysis
  • Telehealth
  • Telehealth
  • Telehealth
  • Telehealth
  • Testing Equipment
  • Testing Equipment
  • Top Tech Stock News
  • Travel
  • Trends Report
  • Tutorials
  • Uncategorized
  • Updates
  • Updates
  • Updates
  • Video
  • Video
  • Video
  • Video
  • Video Footage
  • VR
  • Webinar Alerts
  • Webinar Alerts
  • Webinars
Proudly powered by WordPress | Theme: iofund by iofund.co.uk.