In the short video below, I go over Lyft’s record Q3 results. The company appears poised to exit covid much stronger, as revenue per ride and contribution margin reach all time highs during the quarter. Adjusted EBITDA has also been positive for two quarters in a row, a trend that will likely continue going forward.
Key trends should improve in 2022, which should benefit Lyft’s top and bottom -line. For example, business travel is still subdued, and a continued recovery in business travel is expected as vaccination rates increase. This should support an increase in rides, allowing Lyft to continue to scale its operations. I also discuss broader macro trends that contribute to Lyft's business model. Watch the find out more!
Sign up for I/O Fund's free newsletter with gains of up to 1100% -Click hereSign up for I/O Fund's free newsletter with gains of up to 1100% -Click hereClick here
This article was originally published on Forbes on Mar 25, 2020,09:10am EDTForbes on Mar 25, 2020,09:10am EDT
Uber burns over $4 billion annually yet the company is stating it will be profitable by the end of 2020.
Further analysis is required to look deeper into whether Uber is able to accomplish what it has promised or if the company is buying time and appealing for a more promising valuation before it has to raise more cash. The latter is something Uber is incredibly skilled at as the company now trades well below its last private valuation of $76 billion with a current market cap of $35 billion.
Despite the coronavirus causing the company to cut back operations nation-wide with declines of up to 80% in ride-sharing volume, Uber is receiving analyst upgrades based on the company’s variable cost structure. These analyst upgrades come despite slowing growth and $7 billion in debt on the balance sheet while being deeply unprofitable with record-setting adjusted net losses of $4 billion in 2019.
The overall financial performance defies the CEO’s statements, which are based on a single non-GAAP reporting measure “Rides Adjusted EBITDA.” This non-GAAP reporting measure is new to Uber as of Q3 2019 and replaces the less favorable contribution margin.
Overview of Uber:
Uber’s revenue in the fourth quarter of 2019 grew 37% to $4.07 billion. However, it reported a net loss of -$1.1 billion compared to a net loss of -$887 million in the same period last year. EPS was negative -$0.49 compared to -$0.52 expected.
Full-year 2019 revenue grew 26% to $14.1 billion and net loss was -$8.5 billion compared to a net profit of $997 million for 2018. Stock-based compensation was $4.6 billion in 2019 for a net loss of $4.1 billion and adjusted EBITDA of negative -$2.73 billion.
Notably, Uber sold some operations in Russia and Asia, which provided one-time income, and caused the company to post the $1 billion in net income in 2018. In 2017, Uber posted similar losses at $4 billion.
Monthly Active Users (MAU) increased 22% to 111 million in the fourth quarter of 2019 helping to boost the company’s revenues. The Uber Eats promotional expenses continue to drag the company’s profits despite being the segment with the most growth.
Earlier this year, the company sold its food-ordering business in India to a local company Zomato in exchange for a stake in the company.
Uber investors are encouraged by the non-GAAP Rides Adjusted EBITDA metric, which breaks out the profitability of Uber’s ridesharing business separate from Uber Eats and other bets, such as autonomous vehicles. Uber reported a 281% increase in Rides Adjusted EBITDA from $195 million to $742 million in Q4 and a 34% increase from $1.54 billion to $2.07 billion in full year 2019. The company’s overall EBITDA margin is -57.58% compared to the sector median of 12.99%.
The company stated on a recent call to investors that they have $10 billion in unrestricted cash. Uber carries long-term debt of $5.7 billion and a capital lease obligation of $1.5 billion, or about $7 billion total in obligations. Despite the combination of steep losses and ample debt, the CEO stated the balance sheet is “incredibly strong” due to the absence of short-term debt.
There is clearly a sharp contrast between the financials and the CEO’s statements, which means Uber has a lot to accomplish this year in the face of coronavirus shutdowns.
Analysis of Adjusted Rides EBITDA:
Uber has been opportunistic in breaking out adjusted EBITDA for rides as a means for reaching profitability. In the 10Q details, Uber does not break out the number of ridesharing trips and monthly active users separately from Uber Eats and Freight although there is a statement in the summary that Gross Bookings grew 20% and Eats grew 73% year-over-year.
Gross Bookings is defined as “the total dollar value” including taxes, tolls, fees and without an adjustment for consumer discounts and refunds. Essentially, Gross Bookings is similar to Ride Revenue, the metric that Lyft reports. Uber’s Gross Bookings growth is actually quite low at 20% compared to Lyft’s Ride Revenue at 52%.
Some of Uber’s weaknesses and risks are known to the market. This is one reason the price-to-sales ratio is very low at 2.3 with a forward price to sales of 1.7. Compare this to other companies that went public last year, such as Zoom Video with price to sales of 53 and a forward price to sales of 39, or Slack with a price to sales of 17 and a forward price to sales of 14.
Uber may look attractive to some investors at this current valuation given the risks. However, this is a company that is far from true profitability across all revenue segments.
Subsidies Inflate Demand
I’ve been critical of the ride-sharing business model since pre-IPO when the media speculated Uber would reach $100 per share.
The problem with the ridesharing business model is that the more money the business makes, the more the business loses. This is reflected in the past three years of financials between 2017-2019. Essentially, Uber and Lyft used private funding to subsidize rideshare demand in the year leading up to their public filings.
In 2017, Reuters published that Uber passengers pay only 41% of the actual cost of their trips, citing research from transportation consultant Hubert Horan. At the time, Reuters warned that this creates an “artificial signal about the size of the market” after Uber had released limited financial data as a private company that showed losses of $708 million per quarter.
The cost of the ride is not high enough to cover the cost of the ride, therefore, we see unusual losses. However, if the companies raise prices, demand will decrease. These companies must chose between subpar growth in order to become profitable or subpar earnings in order to drive demand.
The markets did not reward Uber for driving demand at the expense of its bottom line. Instead, Uber became the biggest IPO loss in history. Uber is attempting a new path, which is to pare back on losses while accepting lower demand and revenue at 20%. This is most evident in the
The problem with this scenario is that the market may not like slowing growth either. In fact, we see “Trips” growing 32% year-over-year, which is much lower than the 100% growth reported in the S-1 Filing when trips had doubled from 5 billion trips in September of 2017 to 10 billion trips in September of 2018. (Revenue should be aligned with number of trips, and also doubled, unless subsidies were very steep.)
It’s also important to note that Uber removed the original non-GAAP measurement “Contribution Profit (Loss)” and replaced it with Adjusted Rides EBITDA. This is because the Contribution Margin was too revealing of Uber’s losses with a declining rate from 14.7% in Q2 2018 to 8.2% in Q2 2019.
In an effort to appear profitable in the ridesharing segment, Uber has stopped reporting on contribution margin. – UBER
Lyft: Pureplay Model
Lyft provides a model for a pureplay ridesharing company with a reported 52% year-on-year increase in its fourth-quarter 2019 revenue to $1.01 billion up from $669 million. This is much higher growth than the 20% Uber reported for its ridesharing segment.
For the full-year 2019, revenues increased 68% year-over-year to $3.6 billion
Net loss increased to $356 million from a net loss of $248.9 million in the same period last year, yet on an adjusted basis, the net loss margin was slightly higher in the current year at 35% compared to 37.2%.
Adjusted EBITDA loss margin improved from 37.5 percent in Q4 2018 to 12.9 percent in Q4 2019. More importantly, Lyft has remained consistent with its non-GAAP metrics and reports a contribution margin of 54% up from 45.5%.
In my opinion, Lyft’s financials are more straight forward in how the ridesharing model can achieve profitability while maintaining enough growth to satisfy tech investors.
Beware of a Changing Story
The last thing to note, which is quite important, is the story for Uber is changing frequently. Uber Eats is driving the growth and is the more stable part of the business in the current coronavirus economy, yet a portion was sold off in India to lower expenses and achieve profitability.
Autonomous vehicles were a major part of Uber’s story due to concerns around drivers who bring never-ending legal battles on the misclassification of employment. In as recent as January, autonomous driving was the most likely path to profitability for Uber. This story has changed entirely in two months’ time, yet it will be quite challenging for Uber to separate autonomous vehicle R&D from its financials.
CEO Dara Khosrowshahi highlights the “variable cost structure” of the business, which translates to not having to pay drivers employment benefits. Notably, the misclassification of employment is receiving renewed criticism with the ride-sharing business shut down from the Coronavirus.
The workforce of 5 million drivers have no unemployment, sick leave or health care. Although company is offering sick pay for drivers who test positive for the coronavirus, this does little for the majority of the drivers who are ordered to stay home to avoid the spread of the virus. Now, the company is now asking the government to offer the drivers benefits while Uber highlights its variable cost structure to investors.
Conclusion
The statement that Uber will be profitable is confusing at best as the company cannot simply separate the ride-sharing segment in order to make this claim. Even if this was possible, the ride-sharing growth is the lowest across all segments at 20% and ignores the catalysts of Uber Eats and the autonomous driving division.
In a recent call, Khosrowshahi stated the company has $10 billion in unrestricted cash, yet the CEO also stated the company could lose up to $6 billion from the Coronavirus quarantines. I believe Uber will need to raise more money in the near future and will do (and say) whatever necessary to raise its market cap before doing so.
We want to make sure you’re aware that Uber’s lockup period expires on Wednesday. According to CNBC and MarketWatch, this will cause 763 million shares to become available on 1.7 billion total shares, or roughly $22 billion in shares … that’s a lot of liquidity required for a company that has troubled fundamentals.
I’ve covered Uber extensively since its IPO. I won’t repeat all of the points here but you can find links to the past analysis below.
We’ve seen solid companies like Zoom experience drops after the lockup period. We’ve also seen IPO hype companies like Beyond Meat drop 22%.
We believe Uber will be hit from all sides. Employees are not happy with Uber. There’s been layoffs since the IPO and a change in management, including controversy around the former CEO. Early investors are likely worried about their returns, especially with the heat on WeWork, another one of Softbank’s big bets. The company is at a thresh-hold where early investors can still make a decent gain.
I’m not too concerned with an “earnings beat” as we don’t believe the company will withstand the liquidity on Wednesday. Lyft had an earnings beat and the stock declined the next day (on that note, I’m sure Lyft will be affected by the lockup expiration too).
FactSet analyst estimates are at a loss of 70 cents per share on revenue of $3.63 billion.
Uber’s price action is not much different from our market update last week. In short, Uber appears to be in a larger degree, 3 move correction – outlined by the purple (A), (B), (C) in the chart. The (A) wave down unfolded in a 5-wave pattern, bottomed in October, and is now correcting upwards in a 3-wave fashion, which is the (B) wave. The micro structure of Uber in its (B) wave does not offer confidence that this is the beginning of a new uptrend, but instead just a short pause.
The red lines indicate the retrace levels of the (A) wave. Uber just barely broke the 23.6% retrace level before turning back towards support. We typically see 3 wave corrective moves operate with symmetry on the larger degree and smaller degree. This will be heavy support, and is also the likely target for the corrective (B) wave just before the final leg down begins. If Uber cannot touch this level, and instead turns down from current levels, I will move my final target down lower.
The red bar across the screen indicates a strong support region for Uber around $31.40-$30.50 This region was defined by 4 daily major volume spikes, indicating institutional money is likely allocating a position, which implies that these levels will be strong zones of support/resistance. The current level is major for Uber, and if it breaks through, expect new lows for Uber and for the final (C) wave down to be in progress.
Our stop for the short position will be at $40.25. The reason for this stop is twofold: (1) it’s just above the 61.8% retrace level indicating strong momentum; (2) it’s just above the $40 price cluster.
This price level marks two of the largest volume spikes in Uber’s daily trading. In other words, it’s likely that “smart” money as well as many other investors got trapped at these levels. If Uber can break through the level of selling that should occur at these levels, it’s a sign of more upside to come.
We have been shorting Uber since its IPO, and are pursuing this set-up.
If you want to wait for confirmation, wait for Uber to break support at $30.50, and place a stop at $31.50. This is a more conservative short. Long-dated puts with a strike price of $30 can also act as conservative insurance for a possible market downturn.
I want to drop a quick note about my analysis published in MarketWatch this week on Apple. The company has released all iPhone 11 models simultaneously this year, so there’s a chance they do well short-term. Longer term, releasing all models is very likely to negatively impact Apple in future quarters.
I struggle to see why Apple is trading higher than its peak in 2018. Even with an earnings beat, we will see a decline in overall revenue YoY. We are seeing double digit declines in Apple’s top revenue segment, the iPhone. The effects of smartphone saturation will be even more evident when consumer confidence dips. This is why Samsung is seeing 50% lower operating margins – consumer confidence in China is at a 2-year low and pricing wars are driving prices down (a major warning sign of saturation). Apple has followed by lowering prices.
Regardless, with or without an earnings beat, Apple’s annual revenue will be lower this year than last year. Any other tech company would experience a major sell-off if reporting lower YoY revenue.
Apple has a lot of cash, but to expect a synchronistic handoff between services (or any other pivot) and the iPhone is overly optimistic.
Regarding Lyft, this company is able to report cleaner numbers than Uber. I am very bearish heading into Uber’s lock-up expiration and will personally be betting against both companies again. I have half my position in now, and will lock-in the remaining half of my short position after Lyft reports in the event we see an increase in price from Lyft’s earnings. This will be round four for me on these shorts.
Core Platform Contribution Margin is described as “profit (loss) as a percentage of core platform adjusted net revenue.” This describes the profit margins from every ride-hailing trip or food delivery, (the latter applying only to Uber). This margin falls between gross margin and operating margin.
CPC Margin is calculated by starting with core platform net revenue, minus costs like marketing research-and-development costs, and the result is the “core platform contribution (profit) loss. Divide this by core platform net revenue.
The operating profit margin is lower than the Core Platform Contribution Margin as the latter doesn’t include R&D from autonomous vehicles. Conveniently, they’ve come up with a metric to remove these investments.
I’ve written about Uber and Lyft extensively and want to expand on a few key metrics that are causing further concern. There are thousands of key metrics across the technology industry not recognized by the financial industry. Venture capitalists rely solely on these key metrics to make informed decisions around which companies they should invest in.
Popular key metrics in mobile are monthly active users, daily active users, average revenue per user, churn and retention. For cloud SaaS, net retention rate, monthly retention rate, gross revenue retention, customer lifetime value and customer acquisition cost are a few key metrics that are important.
Here’s a snapshot of key metrics tracked by a VC on a SaaS investment:
Uber and Lyft’s Key Metric:
Core Platform Contribution Margin is described as “profit (loss) as a percentage of core platform adjusted net revenue.” This describes the profit margins from every ride-hailing trip or food delivery, (the latter applying only to Uber). This margin falls between gross margin and operating margin.
CPC Margin is calculated by starting with core platform net revenue, minus costs like marketing research-anddevelopment costs, and the result is the “core platform contribution (profit) loss. Divide this by core platform net revenue.
The operating profit margin is lower than the Core Platform Contribution Margin as the latter doesn’t include R&D from autonomous vehicles. Conveniently, they’ve come up with a metric to remove these investments.
Here’s a snapshot of Uber’s contribution profit (loss) worsening quarter-over-quarter (40)% and also the decline in contribution from the core platform over the past six months (87)% with an increase in other bets.
As a percentage of revenue, the Uber’s most recent contribution margin is 8.2%. Here is what the contribution margin looks like historically:
Compared to Lyft’s contribution margin, which is nearly 5x better and has been very consistent, as well:
Negative (or very low) contribution margins indicate that Uber is becoming less profitable as it gains more customers. This could be due to Uber competing in global markets and needing to lower prices to remain competitive.
The problem for Lyft, is that due to its association as a ride-share company, it will continue to be overshadowed by Uber’s performance. From a key metrics standpoint, Uber is weaker than Lyft. Regardless, both companies are weak fundamentally and provide an excellent opportunity to hedge long positions.
Additional Reading on Uber and Lyft’s Fundamentals:
Path to Profitability is a Dead End
Uber: Q1 Earnings
Uber’s IPO Lyft’s IPO
SECTION 2: Lyft Technical Analysis
By Knox Ridley
We don’t have a full year of price action for Lyft, but we do have some information to work with. First off, if we look at the Anchored Volume Weighted Average Price (AVWAP), which is anchored to the opening high, you’ll notice that Lyft’s price has predominantly stayed below that line, which is highlighted in aqua blue. Furthermore, the recent leg down is showing significant weakness, which can be seen in the separation between the AVWAP and the current price.
This same weakness is further highlighted between the separation in the long-term trend line, highlighted in black and the current trend price. As the RSI approaches the 60 line, the price is making a much lower low, which is not even approaching this trend line or the AVWAP. The continued separation between the AVWAP, long term trendline and the price is an indication of increasing weakness in Lyft.
Institutional Buyers/Sellers:
Those massive spikes in volume indicate institutions buying and selling at specific prices. Because of this, these price points will mark significant support/resistance zones. This is noticeable in how the price bounced around the institutional price clusters, highlighted by the black lines, before finally giving way to the downside last Tuesday, September 25th. This most recent selloff not only broke with force through this support region, but also the 61.8% extension, making all time new lows.
This is notable for a few reasons. One, there is institutional money that sees Lyft as a buy at these levels, so a large amount of money is pegged at these prices. Also, these levels indicate strong support for this very reason, which now will act as resistance.
Negative RSI Reversal:
The negative RSI reversal pattern is currently playing out in Lyft. This happens when the price is making lower lows, while the RSI makes higher highs. This is an indication of fading momentum, and a great indication of further downside ahead. This pattern is highlighted with the blue circles in the chart.
Furthermore, the internal strength of Lyft is quite weak. It has been stuck in bear internals, unable to barely break the 50 line before turning back down to oversold levels. In a bear market, the RSI will not cross the 60 line. When I see a stock unable to cross the 50 line before turning back, it’s a sign of a strong downtrend in play.
Elliot Wave:
There’s a clear first leg down (A Wave), corrective move back up (B Wave), and we are now in the process of a new leg down (C Wave). I’m targeting the 100% extension of the A Wave, which puts us in the $27-$27.50 range.
Typically, we’ll see the down legs in a corrective move that are of equal length (A=C). We will see bounces along the way, but as long as Lyft stays below its AVWAP and the long-term trend line, I will be targeting this zone as a profit taking zone for my short.
SECTION 3: UBER TECHNICAL ANALYSIS
By Knox Ridley
There’s slightly less price action with Uber. For a brief period, it engaged in a slight uptrend, spending half of its time trading above the Anchored Volume Weighted Average (AVWAP), anchored to the high of its open, which is highlighted in aqua blue. However, once it broke the AVWAP, it started a downtrend that appears intact and pointing to more downside.
Negative RSI Reversal:
The RSI is showing the same negative reversal pattern we see in Lyft. This pattern is very reliable in indicating that a new leg is developing in the downtrend. I think it’s very likely that we will make new lows.
Further evidence that the price is rolling over can be found in the KST indicator. The KST is one of my favorite change in direction indicators. It’s a combination of short-term and long-term Rate of Change indicators combined into one. As you can see, the KST has moved back up to the high, while the price of Uber is making lower highs. The KST is currently rolling over hard, which I use in conjunction with the other indicators to help me determine a short.
Elliot Wave:
All corrective retraces move in a 3 wave pattern (A,B,C). The 3rd leg (C), is typically the length of the first leg (A). Now the internal structure of these corrective moves can move in a 3-3-5, pattern or a 5-3-5 pattern, but the larger pattern is usually a 3-step move. Furthermore, when a stock has very little price action, the Fibonacci ratios tend to be great sign posts for a change in trend, or an indication of a further decline.
I currently see the A-wave as complete, and then the market began an brief uptrend – the corrective B-wave. I was expecting the B-wave to be longer, which I highlighted the likely regions in blue. However, once the price action hit the long-term trend line in black, which coincided with the 23.6% retrace line of Wave A, the downtrend commenced, which is an indication that the B-wave is over.
The market likes symmetry, and 3-leg corrections will typically exhibit this symmetry. So, the length of the A-wave (1st leg) will determine the length of the C-wave (3rd leg). This final push will typically be of equal length or an extended ratio of the A-wave (first leg). So, if the C-wave will be a similar length as the A-wave, that will put us around $25.75. This is my final target for my short position before we should see a corrective rally, which will either be the start of a new uptrend, or a corrective rally in a much larger 3-wave correction.
The ride-sharing companies are subsidizing rides and overspending on technology, and soon their very business model may be upended in California.
Ride-share company earnings prove that if you lower the bar to the ground, it’s easy to leap over.
Uber UBER, -1.28% and Lyft LYFT, +1.42% each reported staggering losses recently, yet the reports were delivered with positive spins.
Lyft released “record second-quarter results” while losing roughly the same amount of money as in previous years. Lyft’s improving loss guidance was meant to look attractive at $850 million to $875 million per year, compared with the $1.15 billion-$1.175 billion previously forecast. But that amount is higher than in both 2016 and 2017.
Uber had an epic $5 billion quarterly loss, which is about $1.3 billion when adjusted for certain items. In what universe does a company with a $58 billion market cap report any losses at all, let alone what’s projected to be $4 billion for a full year.
Below, I look beyond the earnings reports to review a few of the systemic issues that affect Uber and Lyft. It’s important to look for the cause of the losses.
1. Ride subsidies destroy potential profits
The S-1 filings disclosed a risk that overshadows the path to profitability for both companies. An excerpt from Lyft’s S-1 filing says:
“We grow our business by attracting new riders to our platform and increasing their usage of our platform over time. … We also offer incentives for first-time riders to try Lyft, as well as incentives for existing drivers and riders to refer new riders. … We often also provide incentives to existing riders to encourage them to expand their use of our platform. If we fail to continue to attract riders to our platform and grow our rider base, expand riders’ usage of our platform over time or increase our share of riders’ transportation spend, our results of operations would be harmed.”
In 2017, Reuters published that Uber passengers pay only 41% of the actual cost of their trips, citing research from transportation consultant Hubert Horan. At the time, Reuters warned that this creates an “artificial signal about the size of the market” after Uber had released limited financial data as a private company that showed losses of $708 million per quarter. Four years later, with a $1.3 billion quarterly loss, there’s no evidence anything has changed.
The problem with subsidizing rides is that investors aren’t able to determine what would be required for profitability, how much the cost of a ride would have to increase to cover expenses, and if increasing prices would negatively affect demand. Therefore, the real-world revenue is unknown, and the losses reflect the effects of subsidies.
2. Business model under threat in California
Lyft and Uber have scaled their companies, but it comes with the variable cost of human labor. Ideally, you want fixed costs for R&D on platforms, software, hardware and other products to create the margins that technology is known for.
Lyft and Uber are mobile applications, but the business model is more of a large-cap human-resources department with many variables around wages, and now, regulations due to independent contractor classifications.
The systemic issue is that the mobile app holds very little intellectual property, with the primary value of the product resting in the mobilization of a massive workforce of nearly 1.9 million people, per Lyft’s S-1 filing, and 3.9 million drivers with Uber. We know there isn’t intellectual property in ride sharing, as there are many such companies globally: China’s Didi, Singapore’s Grab, India’s Ola, Europe’s Bolt (previously Taxify) and MyTaxiApp, and Dubai’s Careem (which is being bought by Uber).
Therefore, the value of the companies is in the workforce, not the technology. This also happens to be the biggest risk.
Uber and Lyft face legislation in California that may require them to reclassify independent contractors as employees. The ride-share companies maintain they are exempt from the law, which is set to go into effect in January. That could lead to a statewide ballot initiative in 2020.
It’s a stretch to think California taxpayers would side with Uber and Lyft. California is especially burdened by workers who make less than minimum wage in a state with high living costs. The lack of health care, and Social Security and tax withholdings from a workforce the size of Uber’s and Lyft’s means costs must be absorbed by taxpayers. Meanwhile, hundreds of Uber and Lyft drivers have organized protests in the state, which doesn’t help for voter sentiment.
Most importantly, these companies have no profits to absorb a change in the business model, such as being required to pay minimum wage or health care. Uber is offering $21 per hour as a compromise, instead of facing the overhead of becoming an employer, but it’s unclear how much Uber pays per hour now to calculate the impact. This would also set a precedent for workers in other states, who might pursue a similar arrangement.
On the one hand, the companies are subsidizing rides up to 60% to lure customers, and on the other, workers are protesting. That is not a good formula.
3. Autonomous vehicles are farther away than they appear
This leads us to the only hope for ride sharing to become profitable: To remove the human driver through autonomous vehicles (AV). Over a year ago, I wrote that regulation hurdles between levels 2 and 3, and delayed deployments, will put immense pressure on stocks that are overvalued based on AV speculation.
For background, we are at Level 2 for commercial purposes. Audi was set to be the first company to release a Level 3 system, which was denied by regulators in early 2019. To remove the driver, we will need to be at Level 4 or Level 5. (See this article for AV levels.)
ABI Research, an advisory firm that reports on market-foresight trends, predicts 8 million consumer vehicles with Level 3 to Level 5 autonomy will ship in 2025. Compare this to the 94.5 million vehicles sold in 2017, which equates to 8.5% of sales.
This is a small and fairly insignificant percentage of market share to be chasing six years ahead of deployment. Yet, headlines are a continual churn of autonomous vehicle “moments” — every partnership, every mile driven, every make and model that adds another feature. The headlines don’t make it clear we are not able to commercially release Level 3 AV right now — and that includes Tesla TSLA, +1.28% and Google’s GOOG, +0.51%GOOGL, +0.49% Waymo.
It’s surprising Uber and Lyft would attempt to fund autonomous vehicles. After all, they’re not high-tech companies with robotics and artificial-intelligence experience. They certainly don’t have the reserves to fund R&D, as Google/Waymo do, or the talent to compete with AV specialists that have been working on this problem for over a decade, such as Torc Robotics, which works with industrial systems for companies including Caterpillar CAT, -0.72% and Daimler Trucks.
Keep in mind, Tim Cook of Apple AAPL, -0.81% has called autonomous systems one of the most difficult AI projects to work on. Ideally, there is a successful, core business funding autonomous R&D — as Google has operated at a loss on its AV projects for a long time. Instead, Uber is losing $1.3 billion from the core business, yet has the resources to pursue flying taxis.
From an investment perspective, the better bet is a successful core business that can absorb the R&D on other projects.
4. Uber lockup expiration is looming
In July, Lyft’s stock was trading at $67. After the Aug. 19 lockup expiration, in which early investors could sell their shares, it’s now at $48.
Early investors have lost a lot of money on Lyft, whose shares traded at $79 the day the company went public. On March 14, I warned my readers two weeks in advance of the IPO that these weak fundamentals and product-market-fit issues were insurmountable, even when Wall Street analysts predicted the stock would reach $100.
My next warning is the Uber IPO lockup, which expires the first week of November. While I don’t expect an immediate dump on day one of the lockup expiring, there should be a noticeable unwinding in the months that follow. This is a possibility for all IPOs, even ones with solid financials. So one can only imagine what might happen to a large-cap stock that’s losing $4 billion per year while potentially facing deeper losses from California legislation.
This article appeared on MarketWatch September 20th, 2019.MarketWatch September 20th, 2019.
Ride-share earnings this week proved that if you lower the bar to the ground, any earnings performance can leap over it. Both companies reported staggering losses that were delivered with positive PR spins.
Lyft reported “record second quarter results” while losing roughly the same amount of money as previous years. Uber had an epic $5 billion loss that is closer to $1.3 billion adjusted. The second number only looks acceptable in the parallel universe where a $65 billion market cap company can report any losses at all, let alone $4 billion per year.
Likewise, Lyft looks digestible compared to its counterpart at $850M in losses, until you realize these numbers haven’t improved since 2016 when the company reported negative net losses of $692M and net losses of $708M in 2017. There is an improvement from 2018, but again, this depends on how you spin it. To me, it’s cut and dry – Investable companies should have fewer losses as they grow revenue. There may be quarters where a company moves backwards, maybe due to capex or another legitimate reason, but the revenue growth in ridesharing creates losses due to subsidizing, and this is a holistic problem that is not going away.
The market found it encouraging that Lyft was expected to lose $1.1B but has revised this to $850M for 2019. Profit margins are negative 23%versus negative 37.7%. The price was adjusted for the $200M improvement, which during after-hours resulted in a 11% spike. The spike soon settled when Lyft announced they are moving up the lock-up period from late September to August 19th.
We see evidence of the holistic problem where Lyft’s losses will marginally improve this year compared to last year. There is no evidence, however, that this is sustainable. If Lyft needs to support R&D on autonomous driving, for instance, then the margins will be deep in the red once again. An important metric to watch is the EBIT margin of -77% compared to -61% a year ago.
Uber’s Q2 resultsare more straight forward to analyze. Adjusted EBITDA was negative 292M in the year-ago period compared to negative 656M in the current period for an increase of 125%. Keep in mind, Uber Eats and Uber Freight help offset the losses.
As I stated in MarketWatch, I’m not a fan of the price war narrative. Increases in revenue per users is irrelevant if the losses are also accelerating or stagnant. This means the subsidization of rides continues to drive demand, and if both companies raise prices, they will also have more losses. The end of a price war sounds like a PR spin to me and we see no evidence in the financials that this will do anything for profitability.
There are also many other unknowns in how demand will react to higher priced supply. Gross bookings may decrease as people decide to drive to a destination, park at the airport for $8 per day, or hire a regular taxi who is already waiting outside many venues. Also, Uber may pull ahead of Lyft if prices go up as the service has more drivers readily available and is a larger brand.
I’ve written extensively about these companies and expressed why my readers should steer clear ahead of the IPOs during the exuberant market of April 2019. I highly recommend anyone who wants to invest in the ride-sharing story to consider the liquidity the lock-up expirations will create with more shares flooding the market.
I won’t repeat everything here, but below are a few bullet points from my previous analysis published March 14th, 2019 – one month before Lyft went public. I’ve also included links to my previous analysis on Uber – both before and after the company went public.
Lyft and Uber pay incentives to acquire and retain users. In gaming, a company might spend $8 to acquire a user with a lifetime value of $15 per user for a profit of $7. The problem with ride-sharing apps is that the incentives offered do not cover the costs of the ride, and that is one reason we see strong sales growth mired by substantial net losses.
Reuters has some historic information on this dated back to 2015, when Uber passengers paid only 41 percent of the actual cost of their trips. At the time, Reuters reported that this creates an “artificial signal about the size of the market” with Uber releasing limited financial data that showed losses of $708 million per quarter.
Lyft and Uber are mobile applications, but the business model is more of a large-cap human resources department with many variables around wages, and potentially regulations due to independent contractor classifications. (There was a recent $20 million settlement due to the misclassification of drivers in California).
A paramount risk to both Uber and Lyft is total addressable market. Room for geographic expansion is limited beyond the United States, other than a few outlier countries like Saudi Arabia. Of course, the underlying issue with TAM is a lack of intellectual property with an easy-to-duplicate mobile application that leverages common app features such as GPS location and SMS/voice. For a list of competitors, reference “Lyft: Risky Valuation and No Intellectual Property”
My premium subscribers received a 12-page report on Roku And TTD prior to earnings, Snap prior to earnings and tech trade war plays to hedge their portfolios. Premium researchPremium research members receive updated recommendations and entry/exit scenarios on tech stocks. Learn more hereLearn more here.
SimilarWeb provided a glimpse into Lyft’s driver daily active users in Q2 2019. The report revealed a decline of 18% in Q2 ahead of earnings today. The data does not account for riders; however, it does require caution as fewer daily drivers is likely to trickle down to less revenue.
Lyft is a native application only and does not operate a website. Native app data from companies like SimilarWeb tends to be accurate in this case. I’ve seen some data not translate if the company also has website traffic, such as Pinterest or Facebook.
Install penetration YoY has also slowed, according to SimilarWeb.
SimilarWeb has access to more data than they publicly disclosed to Yahoo – likely for liability purposes. The company has visibility into app rank and rider daily active users, as well. Therefore, a leak to Yahoo Finance from an unbiased third-party that directly precedes earnings is something I tend to take seriously. SimilarWeb’s business model is to sell data to investors. There is no guarantee Lyft will miss earnings today, however, SimilarWeb will see a material impact either positively or negatively if the data they release is seen as accurate.
Quick Notes on Uber:
Arianna Huffington and Matt Cohler stepped down from board positions – not common this soon following an IPO
Uber laid off 400 employees in marketing, or about 1/3 of the team, which was announced at the end of July
According to MarketWatch, Uber is expected to report losses of $3 billion this quarter due to stock-based compensation from its IPO. Lyft is expected to report losses of half a billion dollars. Fundamentally, this is unprecedented for a company at the $65 billion market cap level. If either company pulls off earnings this quarter, I don't think the rebound will last long.
My original analysis on these two companies was during the euphoria of April 2019 when the market was confident Lyft and Uber would perform well. I wrote an analysis that went against the bullish sentiment before Lyft dropped 20% following the IPO and before Uber became the worst IPO performance in history. The issues that I pointed out still remain:
Subsidizing of Rides: Venture capital is typically used for product development and for human capital to help the company scale. In a rare twist of startup mechanics, venture capital for these two companies was used to drive market demand by using the capital to lower the price of the ride-share. The result is artificial supply and demand, and it’s uncertain what demand will be when the ride is no longer subsidized with venture money. This should have been solved prior to going public and prior to the companies reaching balloon-sized valuations.
The lockup expires in November and I agree with the theory that Uber and Lyft are liquidity events. Look for the true valuation of these companies in the two years following the lock-up period. While I do not expect an immediate dump, there will be a noticeable unwinding as more shares become available, and the stock price undergoes dilution. If you want to bet on these companies long term for autonomous vehicles or another thesis, then you will have much better opportunities for entry after the six-month lock-up period. (I am personally betting against these companies into Q1 and Q2 2020).
You can access my previous analysis on the public blog:
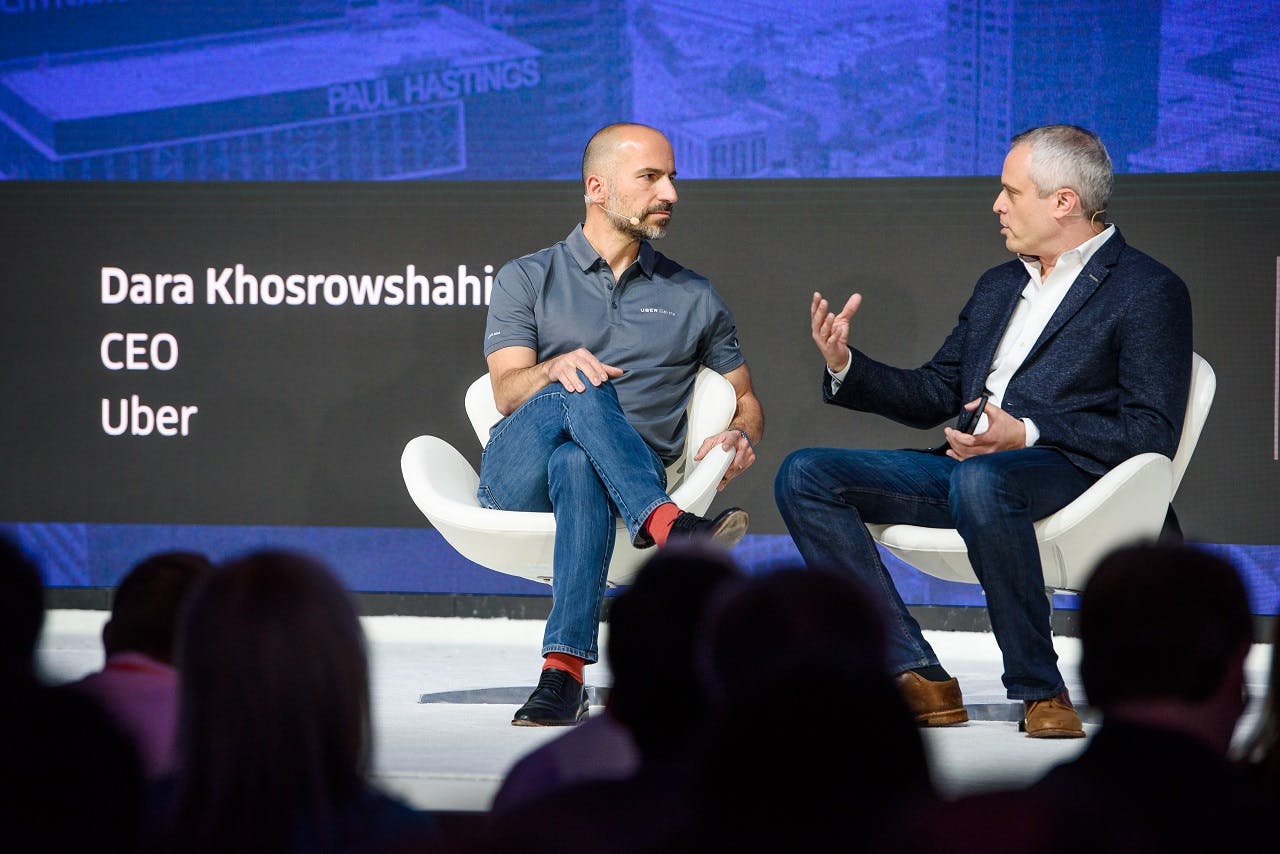
Uber’s CEO, Dara Khosrowshahi, is blaming timing and the trade war for the stock’s poor performance in its public market debut rather than focusing on the company’s unprofitability. When Uber filed to go public, the S-1 filing showed a massive operating loss of $3 billion per year. The most recent earnings report on May 30th showed the losses are getting worse at $1 billion per quarter for the “deeply unprofitable” company. Revenue is slowing down with growth of 20 percent to $3.1 billion in the most recent quarter compared to 25 percent revenue in the year-prior quarter. This was Uber’s slowest growth since it began disclosing results in 2017.
Meanwhile, Uber stock has received a unanimous buy rating from financial analysts and many positive press headlines. This analysis will look closer as to why the current stock price does not reflect the clear evidence of diminished value as of the Q1 earnings report.
Uber Stock: Prospectus and S-1 Filing
If you’ve read my previous analysis on Uber’s IPO and Lyft’s IPO, then you can skip this section on the prospectus and S-1 filing. Notably, I provided accurate predictions on both of these public offerings before the market knew how the companies would perform – and I was very clear on the risks around these two stocks prior to Lyft dropping 20% from its IPO price and Uber stock becoming the worst IPO performance in history.
My newsletter subscribers get this information first. Sign up My newsletter subscribers get this information first. Sign up here.
In years prior, Uber’s prospectus points towards “an accumulated deficit of $7.8 billion” in the years ending December 31, 2017 and 2018. In 2017, Uber posted $4 billion in operating loss and negative $2.6 billion in adjusted EBITDA with losses of about $3 billion in 2018. This upcoming year of 2019, Uber is on track to reverse backwards on operating losses to the $4 billion mark with no improvement in profitability despite demanding a large cap valuation.
Notably, for anyone glancing over the prospectus, Uber sold some operations in Russia and Asia, which provided one-time income, and caused the company to post $1 billion in net income. This is why net income should be ignored when looking at the financials as it does not reflect the operating income or adjusted EBITDA.
Uber’s Core Platform Contribution Margin also worsened, dropping from negative 3% in Q4 2018 to negative 4.5% in Q1 2019 (most recent quarter not shown on the graph below).
Uber states that the reason the Core Platform Contribution Margin goes through periods of decline is due to competition in ridesharing. As my previous analysis pointed out, Uber has to subsidize rides in order to drive demand. This causes artificial supply and is the primary risk for investors.
Uber Eats is mentioned often in earnings reports and in the press. To be clear, Uber Eats only contributed $165 million in adjusted net revenue in Q4 2018 compared to ride sharing at $2.3 billion in adjusted net revenue; which again, the ridesharing is what places the profitability in question.
Evidence That Uber Stock Price is Too High
The primary risk of the ride-sharing business cannot be offset by new ventures, although the company has attempted to offset these losses by lumping users from Uber Eats and Uber Freight into a “platform.” These native apps are not a platform; this is a loophole to hide the numbers on ride-sharing as Uber Eats likely has a healthy user base, totaling $7 billion in sales annually.
Uber and Lyft subsidize rides which is why revenue grows and losses accelerate. The more business these companies do, the more money they lose. We do not know the true cost of ride-sharing as customers are not paying fair market value, and instead venture capital dollars are providing a cheaper ride than what supply and demand dictates. This is essential to understanding the metrics pictured below.
Mobile applications typically break down a few key metrics for investors to analyze. Uber does not offer monthly active users or daily active users. The company focuses on gross bookings, which is at a staggering $50 billion gross bookings annually, although this does not address why there are also staggering losses.
Data can easily be presented in favorable terms, and therefore, more than one source is recommended when drawing conclusions. In February, Adam Blacker of Apptopia, a provider of app intelligence, wrote a blog on various modes of transportation and estimated “decreases in active usage for Uber and Lyft, while seeing increases in public transportation.” The article goes on to state “From January 2018 to January 2019, Uber and Lyft lost a combined 1.2 million average DAUs in the United States.”
The majority of the DAU loss would have come from Uber due to the relative size of the company compared to Lyft, therefore, we can generously assume Uber lost 600,000 DAU, or about half the amount Apptopia reported. According to other sources, Uber completes about 14 million trips per day, so losing 600,000 DAUs is substantial as it represents a minimum loss of about 5% (this percentage of DAU likely higher as not all 14 million trips come from DAUs).
Former Uber growth marketer, Andrew Chen, has pointed out that DAU and MAU for Uber is not a meaningful number as infrequent airport rides are a strong driver of revenue growth, for instance, and these users are not reflected in DAU or MAU. However, when looking at past DAU compared to current DAU, this is a very meaningful number as it shows us relative churn and retention.
Uber Stock Lock-up Expires in November – Mark Your Calendar
If the S-1 numbers show massive losses of $3 billion and the Q1 earnings reports even worse losses of $1 billion per quarter, then why is Uber stock trading higher? My theory is that just like bitcoin, Uber has whales keeping the price steady until the lockup period expires. Before either ride-sharing company went public, I emphasized both IPOs would be liquidity events and to be especially cautious of the press, as PR is a cheap expense to protect the $60 billion that has been sunk into this startup.
When Uber’s lock-up expires in November, the true valuation of Uber will surface in the months that follow. It can take up to two years for a public offering to settle after the lock-up period. While I do not expect an immediate dump on day one of the lock-up expiring in November, I believe there will be a noticeable unwinding in the months that follow. As more shares become available, the stock price will undergo dilution. If you think I’m wrong about the overall fundamentals, and you want to invest in Uber and Lyft, I would urge you to wait beyond the lock-up.
By now, investors know that Lyft’s ride-sharing IPO didn’t reach $100 per share like many of the media talking heads stated it would, and this will likely weigh on Uber’s IPO. Two weeks prior to Lyft’s IPO, I had warned that the risk listed in the prospectus, which warned Lyft may not become profitable, was more than fine print. Ride-sharing companies use investment money to lower the cost of the ride to create demand, which means the ride you take in a Lyft or Uber is not profitable, and will likely never be profitable.
Not one analyst rated Lyft as a sell going into earnings despite earnings estimates that called for accelerating net losses from negative $3.16 EPS to negative $3.97 EPS. Going into earnings this week, twelve analysts had rated Lyft as a buy compared to eight who rated it as a hold (What is wrong with these analysts?!).
With the most recent earnings, we have confirmation that my analysis, which detailed why Lyft can increase revenue yet cannot stop the losses, was accurate with expectations of an estimated $1.1 billion in losses this year.
Reuters published in 2015 that Uber passengers pay only 41 percent of the actual cost of their trips. At the time, Reuters warned that this creates an “artificial signal about the size of the market” when Uber released limited financial data that showed losses of $708 million per quarter. Four years later, little has changed.
How Uber’s IPO Compares to other IPOs:
Uber is an IPO that has been covered extensively. You may have heard comparisons of Uber’s IPO to Facebook or Alibaba. Uber is raising $9 billion in this week’s IPO, Facebook raised $16 billion in 2012 and Alibaba raised $25 billion in 2014. Facebook and Alibaba are both doing great, seems to be the logic OR many tech companies are not profitable at the time of IPO is another costly mistake when comparing Uber to other IPOs.
Of course, these “big tech” comparisons don’t tell the whole story. Facebook had $1.75 billion in operating income, and $1 billion in net income in the year prior to the 2012 IPO. Alibaba had $1.7 billion in operating income, $1.3 billion in net income, and $2.6 billion in adjusted EBITDA in 2013, the year prior to its IPO. To compare, Uber has a $3 billion operating loss, and negative $1.8 billion adjusted EBITDA.
Notably, for anyone glancing over the prospectus, Uber sold some operations in Russia and Asia, which provided one-time income, and caused the company to post $1 billion in net income. This is why net income should be ignored as it does not reflect the operating income or adjusted EBITDA. To summarize, Uber’s prospectus points towards “an accumulated deficit of $7.8 billion” in the years ending December 31, 2017 and 2018. The year prior (2017), Uber posted $4 billion in operating loss and negative $2.6 billion in adjusted EBITDA.
Chicken and the Egg – Both Broken:
Most investors know there have been numerous lawsuits against Uber with many examples listed on page 28 of the prospectus. Here is a sample of what it says:
“We are involved in numerous legal proceedings globally, including putative class and collective class action lawsuits, demands for arbitration, charges and claims before administrative agencies, and investigations or audits by labor, social security, and tax authorities that claim that Drivers should be treated as our employees (or as workers or quasi-employees where those statuses exist), rather than as independent contractors.”
This paragraph is followed by a list of class action lawsuits and state-level Supreme Court rulings that Uber has been involved with and the various legislation or judicial decisions that could have an adverse effect on the business and financial condition of the company.
Although being sued often comes with the territory for disruptive startups, this is unique as the work force is going on strike during the IPO (this is not a competitor suing over intellectual property, etc). The drivers and customers are a chicken-and-egg scenario and Uber struggles to pacify both to successfully operate. On one hand, Uber is subsidizing rides at up to 60% to lure the customers, and on the other hand, the workers are retaliating. This is not a good formula. Most importantly, Uber has no profit to absorb a change in business model, such as being required to pay minimum wages or health care.
Here are some charts:
If you need some charts, to prove what I’m saying, there is an overabundance of charts that show the issues Uber has with subsidizing rides “to create artificial signals about the market” (Reuters words, not mine).
Core platform is the margin Uber generates after direct expenses. As the prospectus states, “Core Platform Contribution Margin is a useful indicator of the economics of our Core Platform, as it does not include unallocated research and development and general and administrative expenses.” Here is what the margins look like:
The reasons Uber states the Core Platform Contribution Margin goes through periods of decline is due to competition in ridesharing (translation: Uber has to subsidize rides to remain competitive) and they also state it’s due to planned investments in Uber Eats. The problem is that Uber Eats only contributed $165 million in adjusted net revenue last quarter compared to ride sharing at $2.3 billion in adjusted net revenue, and therefore, the majority of the decline is likely due to the issues I stated above (rides are priced too low for profits but price of rides must remain low for demand).
Here’s another chart that shows you what it looks like when a company subsidizes purchases with the capital it has raised.
And here’s another one – perhaps the most critical as it shows the relationship between sales and profits:
As sales go up, gross bookings per trip goes down. This is a good indication that the business model requires the price of the ride to remain below fair value in order to drive demand. Although some reporters and analysts like to talk about Uber Eats, the issue is that Uber is valued at $90 billion+ and Uber Eats is a very small percentage of revenue. You can’t conclude that Uber Eats is a good investment opportunity as it makes up about 5% of Uber’s revenue and this won’t absorb the ride-sharing losses.
Notably, the chart which shows the unprofitable relationship between ridesharing trips and ridesharing gross bookings per trip is on page 106 of the Prospectus. On page one, we are presented with a sky-rocketing hockey stick chart based off the number of rides Uber has booked from 1 billion in March 2016 to 10 billion rides today. This 10x chart doesn’t tell the whole story like the charts above.
AVs – Long Ways Off:
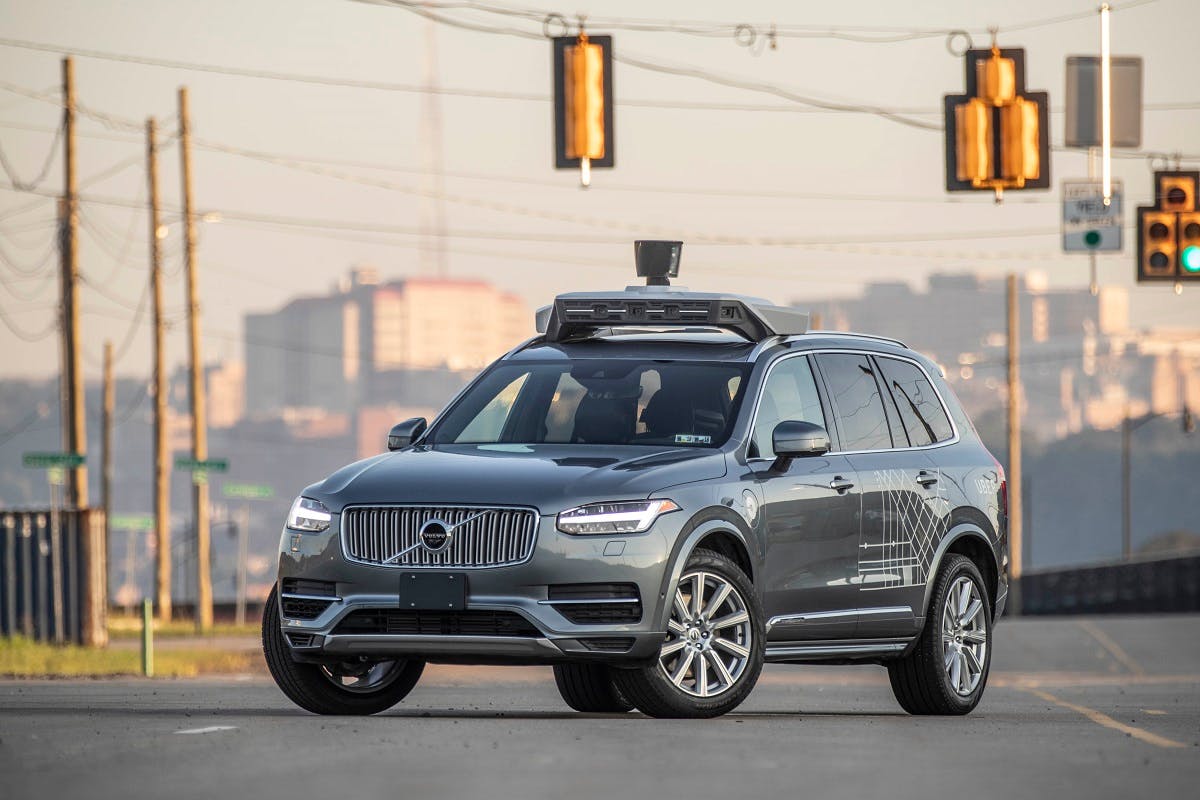
This is where the story gets even more risky as the solution to the upset drivers is that these drivers will not be needed soon due to autonomous driving. Any company who is publicizing autonomous driving right now as a near-term way of driving profits is a good company to run from – and quickly.
We saw Lyft use this tactic to distract from their disappointing earnings this week with PR timed to the earnings report that “Waymo and Lyft partner to scale self-driving robotaxi service in Phoenix.” On closer look, Waymo will only add 10 vehicles to the Lyft app in their Arizona testing sites in Phoenix.
That aside, let’s go into the time machine for a minute to revisit stock prices relative to important product releases. Apple was priced at $11 in 2009, two years after the iPhone came out, and was priced at $35 in 2010, when the economy was doing a little better. Facebook was priced in the $25 range for years after they pivoted to a native mobile app and launched Messenger, both of which greatly contributed to the data collection and ad targeting that drives ad revenue today. Amazon was priced under $100 for nearly three years after the company launched AWS.
Point being, not only are autonomous vehicles a long way off from being commercially deployed to the public and able to generate profits, (and there is a ton of competition), but to invest in tech before it hits the market is high-stakes speculation. There is not one example where it made sense to invest in the company years before a tech product was released. Meanwhile, there are many examples where the stock price and valuations were low even after profitable products had gained traction. I’m not saying you want to be late to the market for AVs, rather I’m saying it can be just as costly to be this early – especially with companies that have ten digit losses.
Note: If you’ve read any of my previous analysis, you’ll know that I’ve been writing about the realities for autonomous vehicles for awhile now and how this does not match investors’ expectations. I won’t repeat my AV bubble thesis here but you can read quite a bit of this under my profile.
Don’t Get Duped on Uber IPO:
Sometimes investors get it wrong. We see this on the public markets frequently when a legendary investor goes all-in at the wrong time or a darling stock has a sudden drop. Well, guess what? Private investors get it wrong too sometimes. And the venture capitalists who invested in Uber and Lyft really got it wrong with ride-sharing. Their eyes lit up with the promise of a serviceable available market (SAM) and total addressable market (TAM) that would replace personal car ownership around the world. User growth is phenomenal and the brand is ubiquitous. VCs kept fueling more and more capital into the leaky ride-sharing business model and something prevented these VCs from using discipline to require proof of the following:
Question: will charging below a fair market price and subsidizing rides at up to 60% create a profit margin? Answer: No
Question: if we charge a fair market price to stop the losses, will there be enough demand? Answer: No.
The ride-sharing business model as we know it today will never be profitable. Meanwhile, the venture capitalists who bought into the world’s most valuable startup want their money back. Do you want to donate to the “pay VCs their $90-$120 billion” charity cause? If so, shares will be available Friday.