Skip to content
Logo-main-white.860316a8

I/O Fund

  • Home
  • Free Stock Analysis
  • AI Stocks
  • BEST OF 2025
  • Analysts
  • Nvidia Hub
  • About
    • Case Studies
    • About Us
    • Premium Services
    • Pricing
    • Notable Wins
    • I/O Fund Reviews
    • Media
  • Contact Us

Month: January 2023

Ad Budgets Set To Slow Even More In 2023

Posted on January 31, 2023June 30, 2026 by io-fund
Ad Budgets Set To Slow Even More In 2023

This article was originally published on Forbes on Jan 27, 2023,12:17am ESTForbes on Jan 27, 2023,12:17am EST

Ad-tech stocks across the board had a tough year last year. Investors are hoping that 2023 will be a better year, yet according to the projected ad spend for 2023, this may not be the case.

It’s clear that lower ad budgets in 2022 affected nearly every ad-tech stock, including companies that own large audiences, such as Alphabet and Meta. It did not matter if an advertising company has audiences as large as 2 billion or more, runs large R&D departments that can leverage AI, or is centered in the leading media growth trend of connected TV (CTV) ads. Broadly speaking, because ad spend budgets were slashed on a year-over-year basis, this one, single headwind caused 50% to 80% selloffs across the advertising industry. Therefore, it’s prudent to look at whether ad-tech budgets will increase this year or if 2023 will look more like 2022 in terms of top line growth.

Here’s What Happened to Advertising Stocks in 2022

The stock market of 2022 was hectic, and the blowoff top in 2021 is primarily blamed for this. However, irrespective of the stock market’s performance in 2021, the global economy and the United States economy is in a slowing growth environment.

Here is a quote from Insider Intelligence published in November:

“Total digital ad spending worldwide will not grow as robustly over the next two years as we expected in our Q1 forecast. We now project 2022 digital ad spending worldwide to reach $567.49 billion, up 8.6% over 2021. In our previous forecast, we expected 15.6% growth to $602.25 billion. Our Q1 forecast predicted digital ad spending worldwide would reach $756.47 billion by 2024, but we now expect it to reach only $695.96 billion.

The key words here are “will not grow as robustly as we expected.” Stock investors get trapped when growth slows and forecasts come down mid-year. This is because not only must stock valuations contend with a growth rate cut in half (8.6% versus 15.6%) — but analysts must also try and figure out when a bottom will form on the slowing growth. Most will lean conservative, which pushes valuations down even further.

GroupM also lowered their forecast for 2022, from 8.4% to 6.5% (excluding US political advertising), and pure play digital advertising was cut from 11.5% to 9.3%.

Sign up for I/O Fund's free newsletter with gains of up to 221% – Click hereClick hereClick here

What to Expect for Ad Spend in 2023

According to the sources noted above, 2023 will not be the year of recovery for ad budgets. As of now, growth is expected to be lower than 2022.

Magna predicts that global advertising revenue will grow to $833 billion in 2023, or about 5% year over year, compared to 7% in 2022. GroupM is projecting 5.9% growth, or $856 billion in 2023 (excluding US political advertising), compared to 6.5% in 2022 (excluding US political advertising). Both of these 2023 estimates reflect downward revisions of 1.5% and 0.5%, respectively. Including US political advertising GroupM is projecting 7.8% for 2022 and 4.6% in 2023.

Global Advertising  YoY Growth Projections

Source: Company Websites

According to Insider Intelligence, China will weigh heavily on 2023 numbers as the second-biggest digital ad market is expected to “post its lowest digital ad growth on record” due to “tougher regulations and economic headwinds.”

According to IAB, the U.S. advertisement market is expected to grow by 5.9% in 2023, which is lower than the 9% growth seen in 2022. The slowdown in growth is the direct result of the challenging macro environment.

On a brighter note, the CTV market is expected to grow 14.4% in 2023 and will grow faster than the overall advertisement market. They forecast Linear TV spending to see a drop of (6.3%). Across the advertising channels, digital video, including CTV, is expected to have the highest share of 22.4%, up from 19.3% in 2022.

There are also positive comments from other ad-tech companies on CTV. Hunain Khan, Director, Programmatic CTV supply at Xandr said, “2023 marks a new age of CTV, due to the increased amount of available premium inventory through AVOD platforms.”

Similarly, Hitesh Bhat, Director, CTV/OTT, EMEA at PubMatic said, “2023 will be an interesting year for CTV in Europe, but I’m avoiding “the year of CTV’ hyperbole. The ad-funded opportunity will grow significantly with the entrance of huge players such as Netflix, Disney+, Paramount+ and the combined HBO/Discovery+ offering. I think Netflix and Disney will be careful in terms of ad loads, so as not to annoy viewers who are still also subscribers.

The Dentsu ad spending report forecasts that global advertising spending in 2023 to increase by 3.8% YoY to $740.9 billion. It is lower than the 8% expected growth for 2022 and the 19.6% growth reported in 2021. The forecasts have been slashed from the July report, which projected a growth of 5.4% for 2023. Some of the reasons mentioned in the report for the slowdown include rising inflation, interest rates, recessions, and political uncertainty. The report suggests that if we exclude the media price inflation, ad spending is forecasted to drop (0.6%) in 2023.

The Americas region is expected to grow 3.7% YoY to $339.1 billion, the EMEA region to grow 3.8% YoY to $156.7 billion, and Asia Pacific is forecasted to grow 4% to $245.1 billion.

Digital ad spending is expected to grow 7.2% YoY to $422.8 billion. It is down from 13.7% expected growth in 2022. Digital ad spending accounted for 57.1% of all advertising spending in 2023. The share is expected to increase to 59.5% in 2025.

According to Insider Intelligence, digital ad spending is expected to grow 10.5% in 2023 from the expected 8.6% in 2022, both of these estimates reflect downward revisions of 2.6% and 7%, respectively.

The CMO survey done in September 2022 showed that the marketing spending increased by 10.4% in the previous one year for marketers. However, they predict that the growth will slow down in the next one year to 8.8% and will start trending toward the pre-Covid level of 5.8%.

A majority of the companies say that the inflationary pressures are decreasing marketing spending levels. Marketing leaders in large companies report marketing spending reduction due to inflation and on the other hand, marketers in the smallest companies report an increase in marketing spending. The survey also suggests that the marketing expenses as a percentage of total revenue have reverted to the pre-Covid levels, as seen in the below chart. It reached a high of 13.2% in February 2021 to 8.7% as per the September 2022 survey.

Marketing Expenses % of Company Revenues

Source: CMO SEPTEMBER 2022 SURVEY

The I/O Fund has launched a new $99/year Premium Newsletter called "Essentials" — this newsletter delivers premium samples for our readers who want more actionable analysis for their tech portfolios. This month, we released a stock pick that we believe will be a leader in 2023 plus a video with the buy plan.$99/year Premium Newsletter called "Essentials" — this newsletter delivers premium samples for our readers who want more actionable analysis for their tech portfolios. This month, we released a stock pick that we believe will be a leader in 2023 plus a video with the buy plan.

Google May Be the Stronger Ad-Tech Company in 2023

According to analyst consensus, Google is expected to generate $168.44 billion in net digital ad revenues worldwide this year, down from Q1 expectation of $174.81 billion. By 2024, Google’s ad business will reach $201.05 billion—or 2.8% below the Q1 expectation.

“Google has an edge over its other ad-reliant competitors in an economic downturn, as advertisers facing budget cuts typically prioritize lower-funnel channels with higher ROI like search,” said Evelyn Mitchell, analyst at Insider Intelligence. “Search has also retained full functionality in the wake of Apple’s privacy changes. Search ads are served in response to a user query and don’t usually leverage data about that user, so they’re less affected when iOS users opt out of being tracked. Meanwhile, social media advertising relies more heavily on consumer data.”

Social Network Users in the U.S. by the Platform 2022 Millions

Source: EMARKETER/INSIDER INTELLIGENCE, NOVEMBER 2021
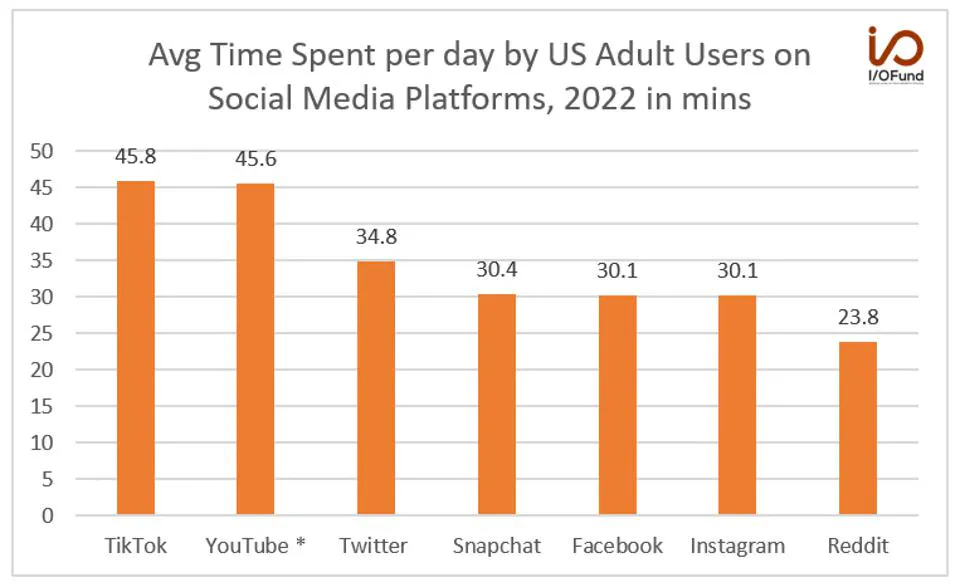
Average Time Spent by U.S. Adults on Social Media in Minutes, 2022

Source: EMARKETER/INSIDER INTELLIGENCE, APRIL 2022

The above two studies from Insider Intelligence show that Facebook and Instagram have the highest number of social media network users in the US. However, these platforms have lost the top spots in terms of engagement as TikTok and YouTube has the highest daily time spent by the users. Due to higher engagement, these platforms are likely to do better for social media advertising makes more sense.

On that note, Insider Intelligence expects Meta to generate $112.68 billion in digital ad revenue for the year 2022, representing a YoY drop of 2%, which is down significantly from the Q1 forecast of $129.16 billion. The firm has lowered the forecast for Meta through 2024 by nearly 20% citing Instagram’s ad revenue to grow by 2.6% YoY to $43.28 billion compared to a 50.2% growth in 2021. The estimate is significantly lower than the Q1 forecast of $54.16 billion. They expect Instagram revenue to reach $59.61 billion by 2024, which is more than 27% lower than the Q1 projection.

Below, Lead Tech Analyst Beth Kindig covers why Meta’s lack of access to third-party data spells trouble for its future growth. This webinar was recorded in April of 2022 yet is still relevant today.

Snapchat ad revenues are also negatively impacted by the economic slowdown. Insider Intelligence has slashed the 2022 ad revenue estimates by 18.3% from their Q1 forecast. They have also reduced the 2024 ad revenue by 33.6% from their Q1 estimates.

The TikTok Threat is Real

Insider Intelligence expects TikTok’s global ad revenue in 2022 to grow 155% YoY to $9.89 billion, below its Q1 estimates of $11.64 billion. They expect TikTok ad revenue to grow 36.7% in the next two years to reach $18.49 billion. However, the 2024 forecast has been by lowered by 21.6% from their Q1 estimates. Jasmine Enberg, the principal analyst at Insider Intelligence, said, “TikTok has transformed from an experimental play to a must-buy for many advertisers,” She further said, “But TikTok isn’t immune to the macroeconomic challenges causing advertisers to trim their overall digital ad budgets. Meanwhile, growing anti-TikTok sentiment among media executives and renewed calls by government officials to ban the platform are causing some advertisers to be more cautious about their spending there.”

According to the Sensor Tower report, social channels accounted for 61% of US digital ad spending in Q3 2022. The US digital ad spending is strong as it grew 5% quarter-over-quarter to $23 billion. Facebook leads the top advertisers in the United States. However, TikTok had the highest growth as it grew 29% QoQ and is a threat to other social media channels.

Disney+ increased its advertising spend in TikTok from $3 million in Q1 2022 to $17.9 million in Q3 2022. TikTok has been successful in being popular among the younger generation audience which has attracted marketers to its platform. As per Omdia research TikTok’s ad revenue is expected to exceed Meta and YouTube’s total video ad revenues by 2027.

Other ad-tech trends to watch for 2023

First-party data ownership is gaining popularity. The data is more reliable even though it might be smaller than the third-party data. The quality of the first-party data is superior and helps better understand the customer’s needs. Contextual targeting is another trend to watch. Contextual targeting means that users will see ads relevant to the topic you are watching or reading. Previously, you used to get ads based on browsing history. Contextual targeting might increase the chances of increasing the return on investment as the ads are relevant to the content. There could also be increased use of AI/ML tools in contextual targeting.

Conclusion

The overall advertising market is expected to slow down in 2023. Some of the crucial reasons are rising interest rates, inflation, and slowing global growth. Even though the estimates have been reduced, the digital ad market is expected to fare better than the broader advertising market.

We believe there will be a handful of winners despite more headwinds in 2023 and we cover these winners for our premium research site. However, until ad budgets resume growth, the industry at large is likely to be volatile in stock price.

Royston Roche, Equity Analyst at the I/O Fund, contributed to this article.

Please note: The I/O Fund conducts research and draws conclusions for the Fund’s positions. We then share that information with our readers. This is not a guarantee of a stock’s performance. Please consult your personal financial advisor before buying any stock in the companies mentioned in this analysis.

Posted in Ctv, Digital Ads, Tech StocksLeave a Comment on Ad Budgets Set To Slow Even More In 2023

Tesla Q4 Earnings: Solid ER and Valuation is Low 

Posted on January 27, 2023June 30, 2026 by io-fund

Given there will be very few perfect earnings reports in the coming weeks, the new macro will force investors to subjectively determine what is a good report and what is not a good report. Before we go into the pros and cons of the report, I want to say that Tesla’s low valuation is a primary reason we entered the stock coupled with a strong earnings report. We covered this yesterday in our notification blog:

“Tesla is trading quite low and has not traded this low since “the new macro.” The forward P/S is at 4.7 and the forward P/E is at 36.15. If you take the tumultuous market of 2022 as a comp, Tesla may have 20% and up to 100% room. For the best case scenario to happen, we need broad market participation.” 

It was not a perfect earnings report – but the point is the stock is not priced for perfection. I think there’s a disconnect basically between the company’s fundamentals and the current stock price (barring any unforeseen black swan macro event). 

The pros are the roughly 30% forward growth rate, no debt, $20 billion in cash on the balance sheet and an expanding operating margin (YoY) and expanding net margin (YoY). The catalyst is the lower prices that allow Tesla’s Model 3 to be included in the $7,500 EV credit. What was a $50K vehicle has now become a $40K vehicle with Tesla only eating $3K of the price as they’ve priced the vehicle at $47K to clear the $50K limitation on the EV credit. We covered this a few months back here.

Here is what the CFO said: “So based upon these metrics here, we believe that we'll be above both of the metrics that are stated in the question, so 20% automotive gross margin, excluding leases and rent credits and then $47,000 ASP across all models.”

The price cuts are between 7% to 20%. For example, a Model Y was originally $65,990 and will now be $52,990. Then, you add the $7500 EV credit and you get about $20K off the price of the smaller SUV.

An additional catalyst for Tesla stock is the manufacturing credits for battery cell packs, that were stated to be $3,700 per Model 3 and Model Y. Tesla’s manufacturing is partly overseas and the credit is only for domestic manufacturing. The CFO stated to expect this: “But we think on the order of $150 million to $250 million per quarter this year and growing over the course of the year as our volumes grow.”

Note: We discussed the credits Enphase was expecting on their microinverters here.microinverters here.

The cons are the free cash flow was down 50% this quarter to $1.4B and the gross margin is a bit softer. Notably, free cash flow increased 50% for FY2022 but it’s certainly something to watch as it’s partly due to higher inventories. However, given the zero debt and $20B in cash (Tesla makes substantial interest on this cash), the company has time on their side to recover the FCF margin.  In other words, to beat Tesla up over this while it’s far and above the better auto OEM on the bottom line, is perhaps lacking perspective. With that said, it’s earmarked as the number one thing to watch moving forward.

Financials:

Given the recent headlines, expectations going into Tesla’s 4th quarter earnings were fairly low. On an adjusted basis, Tesla reported an EPS of $1.19 eps vs consensus of $1.11. With that important hurdle cleared, Tesla’s 2023 outlook was in focus. In a market where companies have been providing dour outlooks based on the macro, there were enough positives to cause us to look closely at valuation.

  • 2023 Production of around 1.8m vehicles, in line with Tesla’s 50% long-term CAGR goal
  • $20b in cash will allow it to execute its expansion plans during uncertain macro environment
  • Although operating margins were down q/q and may stay at these levels in the short term, management stated that the longer-term trajectory was higher as the benefits of greater operating leverage take effect. Even at current levels, Tesla’s current operating margins are 2-3x more than traditional OEMs. 

Revenue came in at 37% growth for $24.03 billion total. Automotive growth was 33% for $21.3 billion in revenue. There were regulatory credits of $467 million. 

The FY2022 revenue came in at 51% for revenue of $81.5 billion. Automotive also came in at 51% for revenue of $71.462 billion. There were $177 million in regulatory credits.

The company reported EPS of $1.19 in Q4 compared to EPS of $1.05 in the third quarter. The FY2022 adjusted EPS was $4.07. The EPS for next quarter is expected to be $0.87 which is lower than the EPS of $1.07 in the year ago quarter.

It’s true that Tesla’s gross margin was soft at 23.80% with an automotive gross margin of 25.9%. This is 150 bps lower and 200 bps lower, respectively, than the September quarter.

It’s also true operating margin of 16% was weaker by 119 bps from the September quarter of 17.19%. However, it was higher than the June quarter at 15% and higher than the year ago quarter at 14.75%. I would consider this strong with anything below 14% to 15% would be contracting. But, this is where an earnings report becomes subjective – and why a lower valuation is helpful especially if a company is not priced for perfection, and rather, is priced for low expectations.

The adjusted EBITDA margin of 22.2% is on the low side for Tesla in FY2022 as the previous quarter was 23.2% and the year ago quarter was 23.1%. My opinion is that it’s not an egregious contraction (especially having a large cash position) and is noted as something to watch.

The net margin was higher than the September quarter at 16.8% compared to 15.30%. This was also higher than the year ago quarter at 13.10%. 

The operating cash flow and free cash flow is where the concern is with this particular earnings report. Operating cash flow of $3.27B was down from $4.58B in the year ago quarter. The Free Cash flow of $1.4B was down 49% YoY compared to $2.775B in the year ago quarter. Both were down sequentially as well with the September quarter reporting Op Cash Flow of $5.1B and FCF of $3.29B.

Looking closer, there were two line items weighing on cash flow:

· Change in operating assets and liabilities at ($2.191) billion

· Purchases of Investments ($4.368) 

The change in operating assets and liabilities points toward an increase in inventories and account receivables. Where the bears may have a good point to consider is the inventory supply has been steadily increasing since Q32022. This is reflected in the $2.191B.

Tesla Inventories

Where the bulls may win, is that the typical response to increased inventory is to lower prices. Not only is Tesla going to do this (with the idea it will increase selling volume) but is assisted in doing so with the $7500. 

As long as current stockholders understand that this is where the speculations remains – will the lower prices help to lower global inventory and days of supply, and meanwhile, can the management keep operating margin steady while doing so?and meanwhile, can the management keep operating margin steady while doing so?

For the purchase of investments of $4.36B, we may need the 10-Q as there weren’t questions on the call from the sell-side analysts to know exactly what this refers to.

Earnings Call:

Management has stated that operating margin is what to watch:

“The second comment I wanted to make here is that as a management team here, we're most focused on what our operating margin is. And so as other areas of the business become more important, particularly the energy business, which is growing faster than the vehicle business and as we're heavily focused on operating leverage here, improving efficiency of our overheads, we think the right metric for us to be focused on is operating margin.”

Short sellers will certainly ignore this comment, and it’s up to each investor if a consistent operating margin is enough to overlook the FCF this past quarter and the softer gross margin. 

The comment that has ruffled some feathers is this from Elon Musk:

“The most common question we've been getting from investors is about demand. Thus far — so I want to put that concern to rest. Thus far in January, we've seen the strongest orders year-to-date than ever in our history. We currently are seeing orders at almost twice the rate of production. So it’s hard to say that will continue twice the rate of production, but the orders are high. And we've actually raised the Model Y price a little bit in response to that.”

The first question on the call questioned if this statement was true or not:

Martin Viecha (moderator)

Thank you very much, Zach. Let's now go to investor questions. The first question is, some analysts are claiming that Tesla orders, net of cancellations, came in at a rate less than half of production in the fourth quarter. This has raised demand concerns. Can you elaborate on order trends so far this year and how they compare to current production rates? I think…

Elon Musk 

We already answered that question.

Martin Viecha

Yes, exactly.

Elon Musk 

Demand far exceeds production, and we actually are making some small price increases as a result.”


My take: I think they’re talking about two different things here. The question is asking about Q4 and Elon Musk is talking about January. With Q4 behind us, the January comment is more important but there's no evidence to back it yet. 

Notably, orders won’t move stock price, rather it will be if Tesla can meet the guide of 1.8M on production, for the 28.8% growth. It was mentioned on the call that Tesla can produce 2M this year barring any unforeseen “force majeure” such as an earthquake or a tsunami.

Secondly, and perhaps most importantly, deliveries are what will also move the price. However, if we assume the January comment is accurate, then production will be equally important this year to meet the demand.

Regarding the operating margin, the company is taking cost reduction efforts. However, the company did state there would be an impact to operating margin in the near term that will level out over the year.

“Second, on cost reduction, we're holding steady on our plans to rapidly increase volume, while improving overhead efficiency, which is the most effective method to retain strength in our operating margins.

In particular, we're accelerating improvements in our new factories in Austin, Berlin and in-house cells, where efficiencies are the highest. But we are attacking every other area of cost and unwinding cost increases created for multiple years of COVID-related instability. This includes logistics, expedites, accumulation of material buffers, part premiums, productivity and overheads as an example […] In that, we've priced our products with a view towards a longer-term cost structure. Thus, there will be an impact on operating margin in the near term. However, we believe our margins will remain healthy and industry-leading over the course of the year.” 

It's also important to note that deflationary pressures on Tesla’s supply chain will help the operating margin. The issue that is riling up the bearish thesis is that by cutting prices to $47,000 while the cost of goods (COGS) is at $42,000 will very little margin. Tesla’s answer to this is that COGS should go down as $42K is the peak, and $36K is the bottom, so somewhere in the middle is where it will land this year.

The company is working to optimize the supply chain and to also optimize the vehicle design, such as the powertrain. 

Here is what was said on the call:

“And we're gathering a lot of data out of that fleet to understand how we can sort of bring some margin that we didn't know we had out of the product. So, over the course of 2023 on the powertrain side, we're actually going to go after sort of some materials where we're paying for more performance than we need, or we have more content than we need, without impacting reliability at all.”

Valuation:

If I were to choose one thing to talk about with Tesla stock (in a 1-minute elevator ride), it would be the valuation. I do think there’s some weight to the $7500 tax credit and the fact a Tesla will be priced competitively with mid-range sedans, like Toyota or Acura. There are some people who could not afford a Tesla before that now can.

In the face of what I would call a “no bad news is good news” earnings report, it was really the valuation that caused us to enter the stock. If the stock was trading at a more median valuation using 2022 comps, it would have been a harder decision (perhaps we would wait for the Q1 report).

But, with Elon Musk buying Twitter and selling a lot of Tesla stock, the valuation is very low. Even with the current run-up we’ve seen, it remains very low.

In the tough macro of 2022, Tesla’s forward P/S was between 8 and 11.5. It’s currently at 5.5.

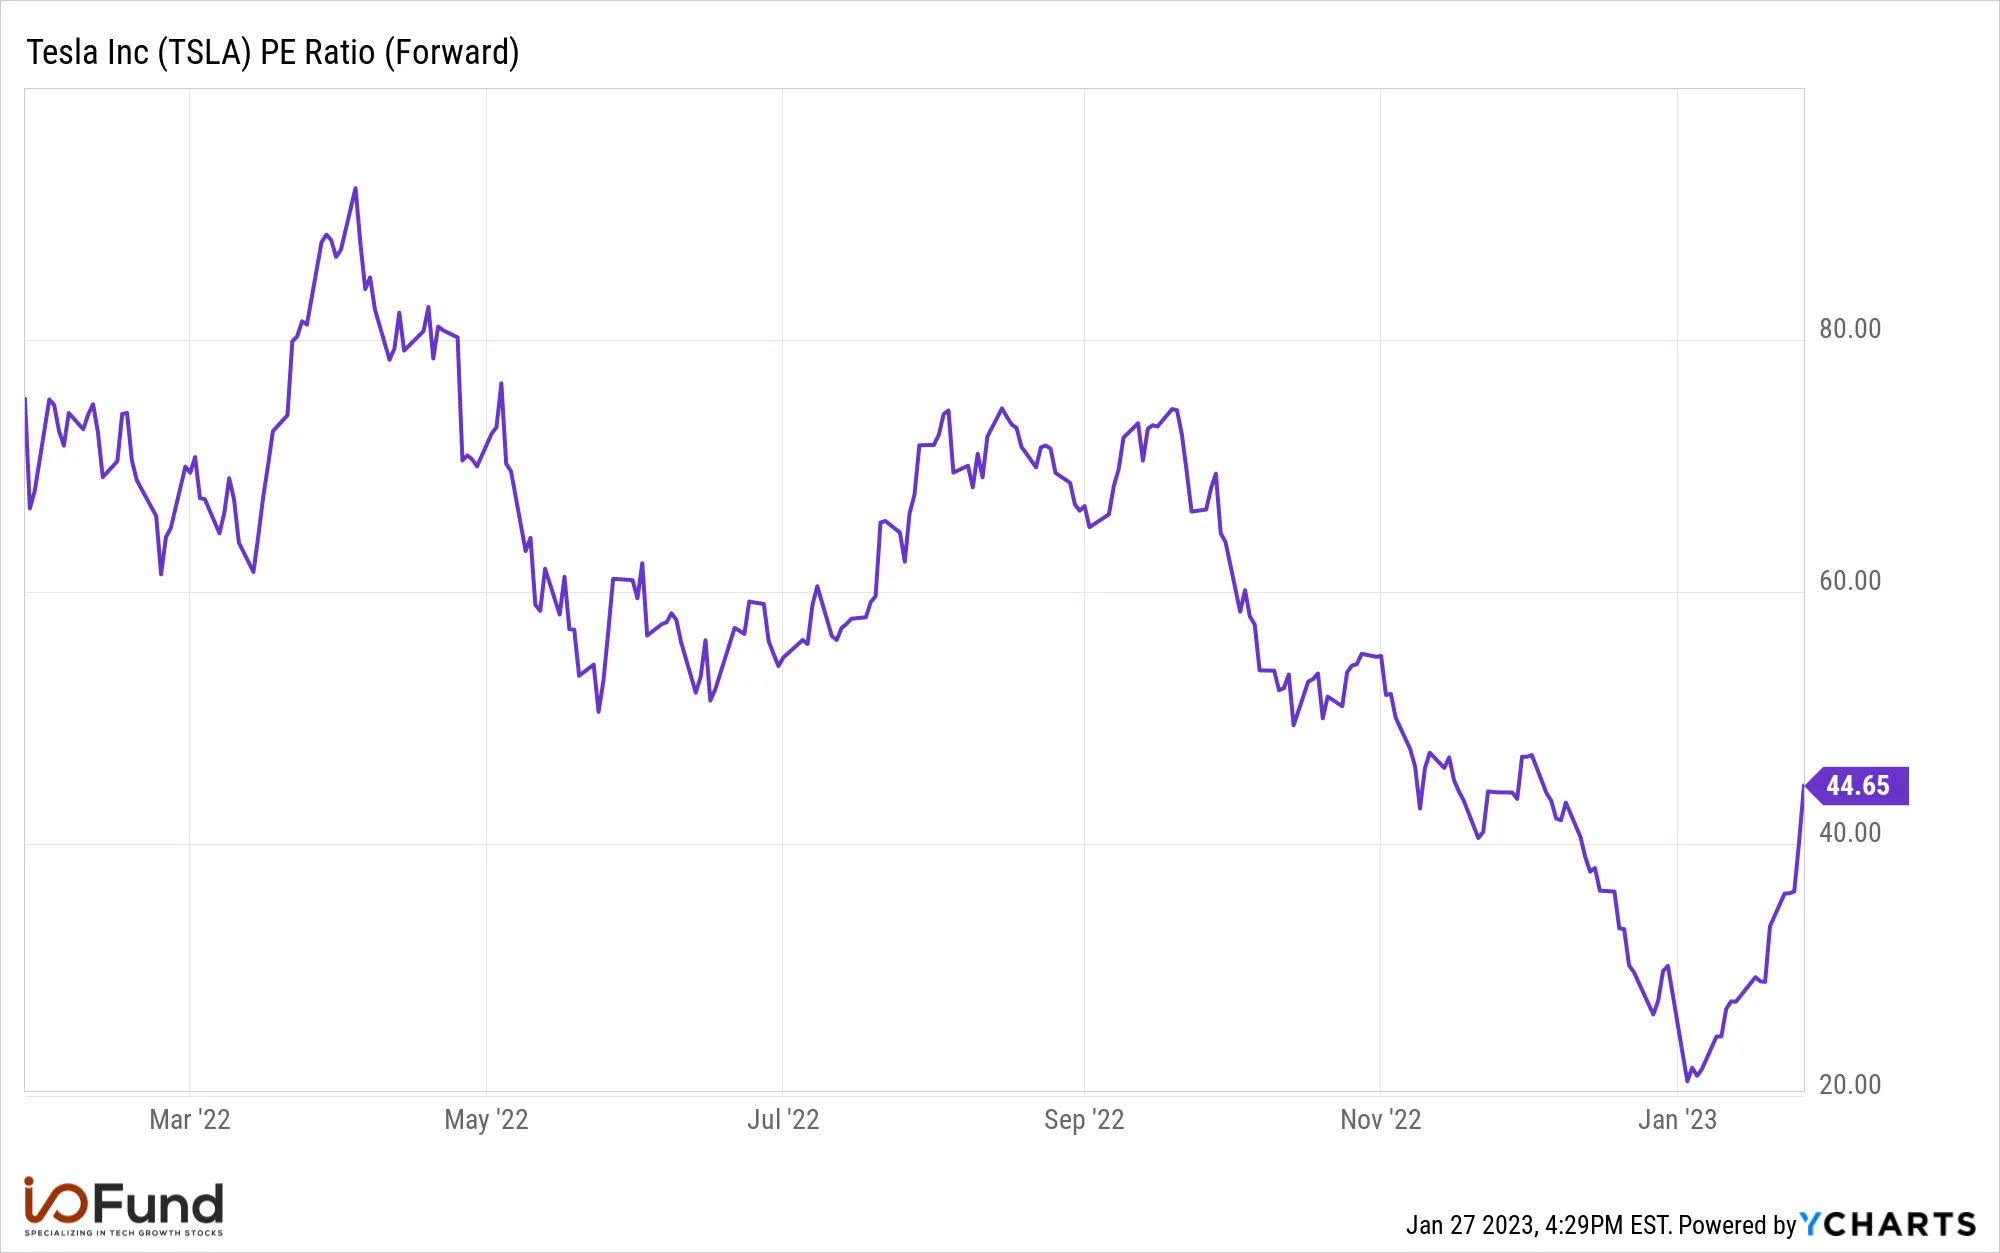
The forward PE Ratio is trading at a 45 forward and traded between 55 forward and 75 forward last year in the tough macro:

Finally, if we look at FCF, it’s trading at a steeper discount as it was at 125 prior to October and is now at a 55 EV/Revenue:

Conclusion:

Over the past few years, Tesla has demonstrated excellent operating leverage. The company has halved its average sales price (ASP) between 2017 and 2022, yet improved the GAAP operating margin from (14%) to 17%. This helps illustrate why a lower ASP may not necessarily weigh on the operating margin. The bull case for Tesla is that the higher volume of sales, optimized supply chains/vehicle design, and deflationary pressure on COGS will improve (and/or sustain) the margins over time. 

The bear case is that Elon Musk is misrepresenting January orders, that they’re lowering prices due to competition, and the softer gross margin and low FCF this quarter is forewarning of more margin contraction up ahead. 

Investors should be aware it was mentioned in the call that “there will be an impact on operating margin in the near term” from the lower prices. What could offset this is a beat on production and deliveries, which as you know, comes out monthly.

Posted in Autonomous Vehicles, Consumer Tech, Earnings Report, Energy StocksLeave a Comment on Tesla Q4 Earnings: Solid ER and Valuation is Low 

Tesla – Q4 Results Strong, Looking for Entry 

Posted on January 26, 2023June 30, 2026 by io-fund

We will provide a deeper dive on Tesla soon, however, we are strongly considering an entry for the following reasons:

·       Operating leverage: the company is delivering on margins and this is an important box to tick. There was concern that the lower prices would lead to a deteriorating bottom line, but this was not the case. 

·       Pricing leverage: Tesla’s pricing is becoming more affordable to the middle class and there’s some early evidence this could be met with enough demand to keep the company afloat on revenue growth.  

·       The valuation is very low, and with an ear towards technicals, we’d like to take advantage of the market’s deep discount on this particular stock.

Tesla reported revenue growth of 37% for revenue of $24.3B. Although this is a deceleration, the bottom line impressed with an operating margin of 16% compared to 14.75% in the year ago quarter. Again, there was built-up anticipation on the operating margin due to Tesla lowering prices, and this hurdle was cleared. 

Net income grew 60% in Q4 for a margin of 16.8% compared to 13.10% in the year ago quarter. For FY2022, net income more than doubled. 

Perhaps most importantly, Tesla is trading quite low and has not traded this low since “the new macro.” The forward P/S is at 4.7 and the forward P/E is at 36.15. If you take the tumultuous market of 2022 as a comp, Tesla may have 20% and up to 100% room. For the best case scenario to happen, we need broad market participation. 

Please follow the forum for entry updates and look for detailed earnings coverage next week.

Posted in Autonomous Vehicles, Consumer TechLeave a Comment on Tesla – Q4 Results Strong, Looking for Entry 

Netflix Q4 Earnings: Comments on Accelerating Revenue in Q2/Q3

Posted on January 26, 2023June 30, 2026 by io-fund

Netflix reported in line on revenue and handily beat on net additions. The miss on EPS is being forgiven (it seems) as the EPS miss is due to FX remeasurement on Euro denominated debt. The market has been overlooking FX adjustments on other companies, as well.

The management team was able to provide a strong guide on free cash flow of $3 billion for FY2023, which is what we wanted to see. They reiterated a consistent operating margin, and most importantly, on the earnings call they said the words “accelerating revenue” starting in Q2. Because that discussion is important, I’ve included excerpts of the transcript below.

On our Q1 Kickoff webinar, we described the types of earnings reports we would want to buy this earnings season, and Netflix ticked those boxes. That is, a stronger bottom line in terms of cash flow, and an acceleration in revenue. The operating margin is expected to be flat but will be higher on absolute profit. We have it penciled in to watch for further improvement on OM in FY2024.

You can access our pre-earnings write-up on the forum here.

Q4 Financials:

Netflix reported revenue of $7.85 billion, in line with the $7.84 billion estimated per analyst consensus. This represents growth of 1.9% or 10% on a constant currency basis. EPS was expected to be $0.50, per analyst consensus. Netflix missed this estimate and reported $0.12 EPS.

The company stated the following:

“EPS in Q4’22 was $0.12 vs. $1.33 in Q4‘21. This was below our $0.36 forecast due to a $462M non-cash unrealized loss from the F/X remeasurement on our Euro denominated debt as a result of the depreciation of the US dollar vs. the Euro during Q4’22."

If you factor in the $462M, it would have been $1.15 EPS.

The guidance for next quarter was in line at $8.17B on revenue compared to analyst estimates of $8.13B. The EPS for Q1 guide was a bit weak, but this is likely due to FX. Analyst expectations for Q1 were $2.98 with management guiding for $2.82 EPS for fiscal Q1.

Paid net additions (or new subscribers) came in at 7.6M compared to 4.5M expected. Analyst consensus ranged between 4M and 5M going into earnings. EMEA had the highest growth followed by APAC. Notably, United States and Canada contributed 1M whereas in the past UCAN was flat or showed nominal churn. As stated on the forum, Netflix will no longer be guiding or reporting on this key metric, and will instead, guide on revenue.

“As discussed in previous letters, we are increasingly focused on revenue as our primary top line metric. This will become particularly important heading into 2023 as we develop new revenue streams like advertising and paid sharing, where membership is just one component of our revenue growth. So, starting with our Q4’22 letter in January of 2023, we’ll continue to provide guidance for revenue, operating income, operating margin, net income, EPS and fully diluted shares outstanding for the following quarter, but not paid membership. Similar to our regional membership disclosure, we’ll continue to report our global and regional membership each quarter as part of our earnings release.”

Margins:

The margins came in as expected, no surprises in either direction. The reason the margins look weak is because management has stated “The fourth quarter is typically our lowest operating margin quarter of the year as it’s usually our largest quarter in terms of content and marketing spend. In addition, the aforementioned F/X impact has a high flow through to operating income (~75%-80% of the revenue impact) as most of our costs are in US dollars.”

  • Gross margin was 31.1% compared to 32% in the year ago quarter.
  • Operating margin was 7% compared to 8% in Q4 last year. FY2022 operating margin was 18% although excluding restructuring charges would have been 20%. For FY2023, the guide was 19-20%. The guide for Q1 is 20% which is lower than last year due to content costs.
  • Net profits were slim at $55 million compared to $163 million expected. This is where the $462M non-cash F/X remeasurement is reflected.
  • Adjusted EBITDA came in at 10.1% for the quarter and 20.4% for FY2022.

Cash Flow

Cash flow for FY2022 came in at $1.6B and management guided for $3 billion in FY2023. The $1.6B in FY2022 compares to ($158) million for FY2021. Overall, this is a very different Netflix today as the company lost over ($3) billion in free cash flow in 2019.

The company’s gross debt is $14.3 billion and the company’s net debt is $8.37 billion or 1.3X LTM EBITDA with $6.05 billion in cash. Note: these numbers have been updated per the Q4 ER. You’ll notice the LTM slightly ticked up from 1.2X LTM last quarter. To reiterate, this is because Q4 tends to be weaker than other quarters. With the $3B in FCF expected in FY2023, Netflix will be able to get the LTM below 1X.

The gross debt will still outweigh cash for some time. The company has stated investors can continue to expect $10 to $15 billion in gross debt. According to the last 10-Q, the company’s next payment of $400 million is due in October of 2024.

That debt level is exorbitant, yet interesting enough, Netflix believes their competitors are faring much worse, per their Investor Letter: “our best estimate is that all of these competitors are losing money on streaming, with aggregate annual direct operating losses this year alone that could be well in excess of $10 billion, compared with our +$5-$6 billion of annual operating profit.”

Earnings Call:

In terms of cutting off password sharing, this was one of the most important comments on the call, where management is implying an acceleration in revenue sometime in Q2-Q3.

Jessica Reif Erlich (Moderator)

Can you provide any details, including the time frame for converting borrowers to paying accounts?

Spence Neumann (CFO)

“[…] so those dynamics that Greg just walked through, because of that as we kind of start to roll this out later in Q1, based on the timing, what we talked about is that we will have modest growth we expect in paid net adds in Q1, but kind of atypical seasonality, where typically Q2 would be a softer pay-at-ad quarter. It will probably be a larger paid net add quarter. And most importantly, what we’re most focused on is obviously revenue. That is our primary metric. And what you see is in the guide, these revenue initiatives between paid sharing rolling out and then scaling ads, you don’t see much of that in Q1, which is why we are forecasting 8% growth FX neutral in Q1 revenue. But throughout the course of the year, we would expect to see accelerating revenue growth as we roll out page sharing broadly across our business and then obviously, scale adds throughout the year, which is a more gradual build. So I just want to kind of highlight that, and that’s kind of what you’re seeing in the guidance.”

Jessica Reif Erlich (Moderator)

And given the revenue drivers of paid sharing and advertising, how are you thinking about price increases in the current year? Is it just too complicated? How are you thinking about it?

Greg Peters (Co-CEO):

Well, I would say the two initiatives that you described represent the bulk of our pricing strategy in ‘23. We anticipate that they’ll both be revenue positive, revenue accretive significantly […] And then we will go back and opportunistically ask for them to pay a little bit more so that keep this virtuous cycle going and really invest that back into incredible content and stories.

Ted Sarandos (Co-CEO):

[…] And so it’s across film, across television. It’s the content that people must see and then it’s on Netflix gives us the ability to do that. And we are super proud of the team and their ability to keep delivering on that month-in and month-out, and quarter-in and quarter-out and continuing to grow in all these different market segments that our consumers really care about. So, that to me, is core to all these initiatives working, and we have got the wind at our back on that right now.

My note: I wanted to bold the last part about content because I believe this is very important as to why Netflix has the brand leverage to cut off passwords and offer an ad tier successfully. It’s partly due to offering so much content that people “must see.” Wednesday saw 341 million hours viewed in one week and holds the new record over Stranger Things 4.

Below is a Nielsen ranking of the Top 10 Shows streamed in a given week published on Deadline around Thanksgiving. All 10 spots are taken by Netflix. Although this fluctuates and is only a sample of one week’s rankings, it demonstrates the type of influence Netflix has on viewership and engagement, competitively speaking.

Here was another important comment about revenue acceleration and an expanding bottom line when the moderator asked about Free Cash Flow (notably, they did not correct her when she said FY2024 FCF)

Jessica Reif Erlich:

So, let’s move away from content then. So, free cash flow. First of all, like, what an inflection point, $1.6 billion in ‘22, roughly $3 billion in ‘23, $4 billion plus probably in ‘24. Can you just talk about – historically, you have been more build than buy. Is there any change in philosophy as cash starts accelerating? Can you talk about overall capital priorities? And what’s driving that operating margin increase?

Spence Neumann:

[..] We are now into New Year, so we take it forward to January ‘23 to current rates, and that’s a range of our operating margin guidance of 18% to 20%. So, now FX neutral for ‘23, we are going to manage within that band to deliver at least within 18% to 20% operating margin guide. So, that is growing margins, growing absolute profit. And really what’s reflected in there is that this – we have high confidence in our ability to accelerate revenue throughout the course of the year as we scale ads and we launch paid sharing. We have got high confidence in improving the service and the strength of our content slate with everything that Ted discussed here on the call. And we are also continuing to manage our cost structure with increasing discipline. You saw that in the back half of ‘22 with our slowing expense growth and we will carry that through similarly in ‘23. So, that all lends itself to our focus, which is kind of healthy growing double-digit revenue growth and accelerating that revenue growth throughout the year, expanding our – both our absolute profit and profit margin and then growing positive free cash flow.

We will obviously know a lot more over the next couple of quarters, a few quarters as we roll out paid sharing, and we will update guidance as appropriate. But that’s what plays through and then also plays through that cash flow generation that you see, where we believe with all those dynamics and managing at about the same level of cash content spend that we will have more than $3 billion, at least $3 billion of free cash flow in the year.

Conclusion:

Management sounded more confident than usual about the password sharing and the new ad tier, and I’m guessing the confidence comes from the testing they’ve been doing. For us investors, it sounds like they will be right on time with a Q2-Q3 revenue acceleration. I did not expect them to blatantly state there would be a revenue acceleration after Q1, but in this tough market, I’ll take it.

The company also did a good job of discussing a better bottom line, of sorts. The free cash flow is clearly improving yet I’ve also seen analyst notes that point toward a better operating margin being forecast for FY2024. Overall, the comments listed above hinted towards higher revenue while confirming a consistent to improving bottom line.

FX can be a lot to unpack but I believe the market is taking into account the $462 million FX remeasurement and seeing this as $1.15 EPS rather than $0.12 EPS. This is why we want to do proper due diligence (and steer clear of social media for investment research — that's an understatement) as there was some confusion over this that negatively spiraled on Twitter.

I would also say that Reid Hastings stepping down should not be a huge surprise as he’s been Co-CEO for over two years since Ted Sarandos became Co-CEO in July of 2020. I kinda got the feeling on the call that perhaps Hastings is stepping down right now because the company is about to have some strong quarters – that’s pure speculation about his chosen timing – but I figure if a company has become your magnum opus, it makes sense to exit when it’s on solid ground.

Posted in Ctv, MediaLeave a Comment on Netflix Q4 Earnings: Comments on Accelerating Revenue in Q2/Q3

Microsoft FYQ2: Guidance Weaker than Expected

Posted on January 24, 2023June 30, 2026 by io-fund

Microsoft was up 5% after hours yet this reversed due to comments on the earnings call.

Ultimately, the guidance on the earnings call was weaker than expected in a few key areas:

  • Revenue growth for the March quarter had a slight miss.
  • Intelligent Cloud for next quarter is marking a 6-point deceleration sequentially and a 10-point deceleration YoY.
  • Azure is contributing to the deceleration in Intelligent Cloud with a 4-5 point deceleration sequentially from the exit rate in December (see below transcript for clarification from CFO). This puts Azure at 30% to 31% growth for the March quarter down from 38% this quarter and down from 49% on CC basis in the year ago March quarter. You may recall, the 5 point deceleration announced in the October report caused concern in the market. This is technically a steeper decel – comments from CFO clarifying this are below.
  • Commercial Cloud growth guidance of 20% for Fiscal Year 2023 (provided on last two calls) was essentially pulled and CFO said would decelerate in H2. Overall FY2023 guidance was not provided, which is out of character for MSFT. CFO cited it was due to consumer.
  • The consumer is weaker than expected. Not only did More Personal Computing miss this quarter but this segment is causing enough uncertainty that the CFO did not provide a fiscal year guide.

FINANCIALS:

The current quarter was in line across the board — except the Personal Computing miss – which led to a slight miss on the top line. Azure posted slightly-better-than-expected growth of 38% compared to guidance of 37%. GAAP EPS missed while adjusted EPS beat. FCF was down quite a bit from the previous year FQ2 due to one-time expenses and consumer weakness. We break the one-time expenses down below.

Microsoft reported revenue of $52.7 billion, which missed estimates of $53.2B or by about $500 million. The market overlooked this initially because the miss was driven by the PC/consumer segment whereas Intelligent Cloud beat. Notably, the revenue this quarter was in line with guidance from management.

The guide on revenue came in at $51B at the midpoint and $51.5B at the high end of guidance, which missed expectations of $52.6B or by about $1.5 billion. This represents 3.3% growth compared to 6.7% growth expected.

As noted, the full year guide was essentially pulled as the CFO did not state a FY2023 guide despite giving us one in the past two quarters. The understanding is that the full year revenue would “grow double digits.”

Here is what was stated on the earnings call in the previous quarter:

"At the total company level, we continue to expect double-digit revenue and operating income growth on a constant currency basis. Revenue will be driven by around 20% constant currency growth in our commercial business, driven by strong demand for our Microsoft cloud offerings. That growth will be partially offset by the increased declines we now see in the PC market.”

This was shared in the earnings call this evening but is pretty vague: “First, in our Commercial business, revenue grew 20% on a constant currency basis in H1. However, we now expect to see a deceleration in H2, given how we exited December.”

Below, I include more information from the transcript. However, the Commercial business decelerating in H2 indicates it’s not only consumer weighing on the full year guide.

The company reported GAAP EPS of $2.20 which missed estimates of GAAP EPS $2.28 – I believe this is due to the layoffs which had a $0.12 EPS impact. The adjusted EPS was in line at $2.32.

For the current quarter, the operating margin and net margin was weaker than last year although the CFO did reiterate the FY2023 operating margin would be down (1%) YoY. Here is what was stated:

“As a result, when excluding the Q2 charge and favorable impact from the change in accounting estimate, we expect full year operating margins to be down roughly 1 point in constant currency and roughly 2 points in USD, even with the headwinds from materially lower OEM revenue and higher energy costs.” Note: this is a pretty strong OM given the weakness in consumer implying Microsoft is very good at pulling the necessary levers to maintain bottom line strength.

The Q2 one-time charge related to layoffs negatively impacted gross margin by $152 million, operating income by $1.2 billion, and earnings per share by $0.12. Per our Pre-ER write-up, analysts are modeling annualized net of $2 billion per year from the layoffs moving forward.

There is also a new tax law that changes how R&D expenses are taxed, which you can read about here referred to as “Tax Cuts and Jobs Act” or “TCJA.” This tax payment was $2.35 billion.

In addition to these one-time headwinds, the segment weighing on operating income is the More Personal Computing segment down roughly 50% in Op Income whereas both Intelligent Cloud and Productivity grew double digits or more on Op Income (on a CC basis).

  • Gross margin of 67% which was in line and flat YoY. On a CC basis, gross profit grew 8% YoY to $35.3 billion.
  • GAAP operating margin of 38.8% and adjusted operating margin of 41% compared to GAAP OM of 43% in the year ago quarter. On a CC basis, the operating profit was flat with 0% growth for $20.4 billion in Op Income.
  • Net margin of 31.1% compared to 36% net margin in the year ago quarter. On a CC basis, net profit was down (4%) year-over-year for $16.4B in net profit which resulted in GAAP EPS being down (3%) on a CC basis.

Cash Flow:

Cash flow was also affected by the TCJA R&D tax payment. Operating cash flow was $11.2B down (23%) year-over-year. Excluding the tax payment of $2.355 billion, Op Cash Flow was down (7%).

Free cash flow of $4.9 billion was down (43%) YoY. Excluding the tax payment of $2.355 billion, FCF was down (16%).

For next quarter, the company expects to make a TCJA R&D tax payment of $1.2 billion.

The company returned $9.7B to shareholders with $4.6B in share repurchases and $5.1B in dividends.

Earnings Call:

Below is one of the most important questions on the call as the analyst Karl K. got three important things out of the CFO: (1) the rate of deceleration in Azure as it was not clear from comment she made as to whether it’s based on the 38% FQ2 number or the 35% December exit rate number. (2) The question also got the CFO to admit they did not give FY2023 guidance and (3) it allowed the CFO to reiterate the operating margin would remain consistent even with consumer weakness.

Karl Keirstead

Thank you. This one for Amy. Amy, given the obviously tough environment, it sounds like reaching that full fiscal year 20% constant currency commercial revs guide would be tough. Is that also true for the soft guidance for 10%-plus total revenue growth for the year? And if I could just sneak in a clarification, Amy, just because it’s an important metric. When you talk about a 4-point to 5-point decel in Azure, that’s off of the 38% reported for December, right, not off the 35% exit rate? Thank you.

Amy Hood

It’s all – Karl, let me just – the first half of your question, give me a second. On the second half of your question, which is the guide of the exit rate – it’s off the exit rate on Azure of four points to five points, just to make sure that is clear. In terms of thinking about total year revenue, right, I did not comment on full year revenue as we continue, I think really just to watch the Windows PC market as it returns to pre-pandemic levels. Outside of that, as you can see, the trends are relatively consistent. So, in some points, it’s important because if you look at the operating income margin guidance that I talked about, the fact that we are guiding to really only one point of margin deceleration for the year on a constant currency basis with probably over $2 billion of headwind from the OEM business from what we had anticipated heading into the year, the focus on margins, the focus on prioritization, the focus on putting our investments into where we know they have high return, I actually feel quite good about the place that puts us in as we exit the year in terms of – and the right energy, right, or leaving the year in Q4 on leverage.

Side Note: I’ve corrected my forum comments to reflect the 35% December number instead of the 38% FQ2 number. Azure coming in 8 points lower instead of 5 points lower sequentially is important to note. It looks like the analyst originally thought the decel was off the 38% as did I.

Another important question was around the strong trend toward optimization, or basically current customers looking for where they can cut costs. As you’ll see, some of this is from the Covid bloat although I would argue that consolidation is partly responsible, which happens to every major tech trend, regardless of a pandemic. Consolidation happens because demand for a trend is extraordinary in the beginning as excitement and adoption soars, and then consumers/enterprises cut back to only what is necessary. In the past decade alone, consolidation happened to ad-tech circa 2014, mobile apps and gaming. You’ll hear me talk about this a lot moving forward because I want I/O Fund members to be prepared – depending on how deep the recession is, not all cloud companies will survive. This is the very nature of tech.

Consolidation wasn’t specifically called out but I believe the optimizations happening now will result in consolidation and more M&A activity (if the weaker companies are lucky).

What the CEO is saying is that outside of the massive headwind that inflation presents for growth … that higher prices cause lower spending = vicious cycle that drives down growth … that he believes tech will eventually overcome this and become a larger part of GDP. In the meantime, this will be the year for optimization, and Microsoft will come out stronger in the long-term due to their positioning in AI.

Here is what was said on the call:

Brent Thill

Thanks. Satya, can you give us your overall macro view? There were some comments you had made that concerned, I think many about the state of the U.S. spending environment. I am just curious if you could comment and follow-up on what you are seeing there just from a spend environment throughout the year. I think many came away with that you are seeming that you were saying it’s getting worse, not better. Can you just give us a little more color on that? Thank you.

Satya Nadella

Thank you, Brent. And first of all, I was making a comment which was sort of a global comment, not just a specific U.S. comment. I mean there is only – I always sort of subscribe to that there is only one law of gravity that I think all of us are subject to, which is inflation-adjusted economic growth in the world. And then how many times that do we grow, because as I have said in my comments that I fundamentally believe tech as a percentage of GDP is going to be much higher and on a secular basis. So, the question is how many times is it given the overall inflation-adjusted economic growth. So, that’s kind of how I look at it. Given that, I think the two things that we see, we commented on that even in the last quarter, and it’s even in the outlook, which is the thing that customers are doing is what they accelerated during the pandemic. They are making sure that they are getting most value out of it or optimizing it and then also being a bit more cautious on given the macroeconomic headwinds out there in the market. So, given those two things, the point is at some point, the optimizations will end. In fact, the money that they save in any optimization of any workload is what their cloud into workloads. And those workloads will start ramping up. And so one of the key things we are watching for, Brent, is to make sure that we are gaining share in this space through our value propositions, so and even build loyalty with our customers so that long-term, we are well positioned for share gains. So, that’s sort of fundamentally how we view it. And then the other aspect I would also say is simultaneously investing in this new AI trend, because I don’t think any application start that happens next is going to look like the application starts of 2019 or 2020. They are all going to have considerations around how is my AI inference performance, cost, model is going to look like, and that’s where we are well positioned again. So, that’s how I view it. The market, you all are better readers of, quite frankly, what’s happening out there. We can tell you what we see. What we see is optimization and some cautious approach to new workloads and that will cycle through, but we do fundamentally believe on a long-term basis, as a percentage of GDP, tech spend is going to go up.

OpenAI was discussed on the call, and the CEO said what I would expect him to say – which is that Microsoft is strong in many areas of AI. For example, Github CoPilot offers auto complete coding suggestions and has 1 million users.

Conclusion:

We continue to like Microsoft for its bottom line and its ability to sell into enterprises. I believe this is the key thing missing in many of the other mega cap companies with AI/ML and other related ambitions, which is Microsoft owns the perfect customer base to ramp AI applications – which is the large budgets of the Fortune 500. Startups drive this too but not at the scale of the Fortune 500 and Fortune 2K.

We want to build this position on any weakness although we want to be sensitive to timing as we’ve been discussing for some time now that cloud budgets may be the next shoe to drop. The lack of a FY2023 guide from the cloud bellwether, although citing consumer, didn’t provide much information in terms of what the CY2023 cloud budgets are looking like. I think reading between the lines, even without a fiscal year guide, Azure’s further deceleration next quarter isn’t painting the best picture of cloud budgets.

On a side note, I am not sure what the tax implications of TCJA will be for other companies in the tech industry given the industry’s large R&D spending. After reading about the Tax Cuts and Jobs Act, it certainly doesn’t seem like it will be isolated to Microsoft and rather it will affect R&D investments primarily made outside the United States (foreign versus domestic R&D). Perhaps other Big Tech earnings next week will help shed some light on what to expect.

Posted in Cloud, Tech StocksLeave a Comment on Microsoft FYQ2: Guidance Weaker than Expected

Microsoft FYQ2: Guidance Weaker than Expected

Posted on January 24, 2023June 30, 2026 by io-fund

Microsoft was up 5% after hours yet this reversed due to comments on the earnings call.

Ultimately, the guidance on the earnings call was weaker than expected in a few key areas:

  • Revenue growth for the March quarter had a slight miss.
  • Intelligent Cloud for next quarter is marking a 6-point deceleration sequentially and a 10-point deceleration YoY.
  • Azure is contributing to the deceleration in Intelligent Cloud with a 4-5 point deceleration sequentially from the exit rate in December (see below transcript for clarification from CFO). This puts Azure at 30% to 31% growth for the March quarter down from 38% this quarter and down from 49% on CC basis in the year ago March quarter. You may recall, the 5 point deceleration announced in the October report caused concern in the market. This is technically a steeper decel – comments from CFO clarifying this are below.
  • Commercial Cloud growth guidance of 20% for Fiscal Year 2023 (provided on last two calls) was essentially pulled and CFO said would decelerate in H2. Overall FY2023 guidance was not provided, which is out of character for MSFT. CFO cited it was due to consumer.
  • The consumer is weaker than expected. Not only did More Personal Computing miss this quarter but this segment is causing enough uncertainty that the CFO did not provide a fiscal year guide.

FINANCIALS:

The current quarter was in line across the board — except the Personal Computing miss – which led to a slight miss on the top line. Azure posted slightly-better-than-expected growth of 38% compared to guidance of 37%. GAAP EPS missed while adjusted EPS beat. FCF was down quite a bit from the previous year FQ2 due to one-time expenses and consumer weakness. We break the one-time expenses down below.

Microsoft reported revenue of $52.7 billion, which missed estimates of $53.2B or by about $500 million. The market overlooked this initially because the miss was driven by the PC/consumer segment whereas Intelligent Cloud beat. Notably, the revenue this quarter was in line with guidance from management.

The guide on revenue came in at $51B at the midpoint and $51.5B at the high end of guidance, which missed expectations of $52.6B or by about $1.5 billion. This represents 3.3% growth compared to 6.7% growth expected.

As noted, the full year guide was essentially pulled as the CFO did not state a FY2023 guide despite giving us one in the past two quarters. The understanding is that the full year revenue would “grow double digits.”

Here is what was stated on the earnings call in the previous quarter:

"At the total company level, we continue to expect double-digit revenue and operating income growth on a constant currency basis. Revenue will be driven by around 20% constant currency growth in our commercial business, driven by strong demand for our Microsoft cloud offerings. That growth will be partially offset by the increased declines we now see in the PC market.”

This was shared in the earnings call this evening but is pretty vague: “First, in our Commercial business, revenue grew 20% on a constant currency basis in H1. However, we now expect to see a deceleration in H2, given how we exited December.”

Below, I include more information from the transcript. However, the Commercial business decelerating in H2 indicates it’s not only consumer weighing on the full year guide.

The company reported GAAP EPS of $2.20 which missed estimates of GAAP EPS $2.28 – I believe this is due to the layoffs which had a $0.12 EPS impact. The adjusted EPS was in line at $2.32.

For the current quarter, the operating margin and net margin was weaker than last year although the CFO did reiterate the FY2023 operating margin would be down (1%) YoY. Here is what was stated:

“As a result, when excluding the Q2 charge and favorable impact from the change in accounting estimate, we expect full year operating margins to be down roughly 1 point in constant currency and roughly 2 points in USD, even with the headwinds from materially lower OEM revenue and higher energy costs.” Note: this is a pretty strong OM given the weakness in consumer implying Microsoft is very good at pulling the necessary levers to maintain bottom line strength.

The Q2 one-time charge related to layoffs negatively impacted gross margin by $152 million, operating income by $1.2 billion, and earnings per share by $0.12. Per our Pre-ER write-up, analysts are modeling annualized net of $2 billion per year from the layoffs moving forward.

There is also a new tax law that changes how R&D expenses are taxed, which you can read about here referred to as “Tax Cuts and Jobs Act” or “TCJA.” This tax payment was $2.35 billion.

In addition to these one-time headwinds, the segment weighing on operating income is the More Personal Computing segment down roughly 50% in Op Income whereas both Intelligent Cloud and Productivity grew double digits or more on Op Income (on a CC basis).

  • Gross margin of 67% which was in line and flat YoY. On a CC basis, gross profit grew 8% YoY to $35.3 billion.
  • GAAP operating margin of 38.8% and adjusted operating margin of 41% compared to GAAP OM of 43% in the year ago quarter. On a CC basis, the operating profit was flat with 0% growth for $20.4 billion in Op Income.
  • Net margin of 31.1% compared to 36% net margin in the year ago quarter. On a CC basis, net profit was down (4%) year-over-year for $16.4B in net profit which resulted in GAAP EPS being down (3%) on a CC basis.

Cash Flow:

Cash flow was also affected by the TCJA R&D tax payment. Operating cash flow was $11.2B down (23%) year-over-year. Excluding the tax payment of $2.355 billion, Op Cash Flow was down (7%).

Free cash flow of $4.9 billion was down (43%) YoY. Excluding the tax payment of $2.355 billion, FCF was down (16%).

For next quarter, the company expects to make a TCJA R&D tax payment of $1.2 billion.

The company returned $9.7B to shareholders with $4.6B in share repurchases and $5.1B in dividends.

Earnings Call:

Below is one of the most important questions on the call as the analyst Karl K. got three important things out of the CFO: (1) the rate of deceleration in Azure as it was not clear from comment she made as to whether it’s based on the 38% FQ2 number or the 35% December exit rate number. (2) The question also got the CFO to admit they did not give FY2023 guidance and (3) it allowed the CFO to reiterate the operating margin would remain consistent even with consumer weakness.

Karl Keirstead

Thank you. This one for Amy. Amy, given the obviously tough environment, it sounds like reaching that full fiscal year 20% constant currency commercial revs guide would be tough. Is that also true for the soft guidance for 10%-plus total revenue growth for the year? And if I could just sneak in a clarification, Amy, just because it’s an important metric. When you talk about a 4-point to 5-point decel in Azure, that’s off of the 38% reported for December, right, not off the 35% exit rate? Thank you.

Amy Hood

It’s all – Karl, let me just – the first half of your question, give me a second. On the second half of your question, which is the guide of the exit rate – it’s off the exit rate on Azure of four points to five points, just to make sure that is clear. In terms of thinking about total year revenue, right, I did not comment on full year revenue as we continue, I think really just to watch the Windows PC market as it returns to pre-pandemic levels. Outside of that, as you can see, the trends are relatively consistent. So, in some points, it’s important because if you look at the operating income margin guidance that I talked about, the fact that we are guiding to really only one point of margin deceleration for the year on a constant currency basis with probably over $2 billion of headwind from the OEM business from what we had anticipated heading into the year, the focus on margins, the focus on prioritization, the focus on putting our investments into where we know they have high return, I actually feel quite good about the place that puts us in as we exit the year in terms of – and the right energy, right, or leaving the year in Q4 on leverage.

Side Note: I’ve corrected my forum comments to reflect the 35% December number instead of the 38% FQ2 number. Azure coming in 8 points lower instead of 5 points lower sequentially is important to note. It looks like the analyst originally thought the decel was off the 38% as did I.

Another important question was around the strong trend toward optimization, or basically current customers looking for where they can cut costs. As you’ll see, some of this is from the Covid bloat although I would argue that consolidation is partly responsible, which happens to every major tech trend, regardless of a pandemic. Consolidation happens because demand for a trend is extraordinary in the beginning as excitement and adoption soars, and then consumers/enterprises cut back to only what is necessary. In the past decade alone, consolidation happened to ad-tech circa 2014, mobile apps and gaming. You’ll hear me talk about this a lot moving forward because I want I/O Fund members to be prepared – depending on how deep the recession is, not all cloud companies will survive. This is the very nature of tech.

Consolidation wasn’t specifically called out but I believe the optimizations happening now will result in consolidation and more M&A activity (if the weaker companies are lucky).

What the CEO is saying is that outside of the massive headwind that inflation presents for growth … that higher prices cause lower spending = vicious cycle that drives down growth … that he believes tech will eventually overcome this and become a larger part of GDP. In the meantime, this will be the year for optimization, and Microsoft will come out stronger in the long-term due to their positioning in AI.

Here is what was said on the call:

Brent Thill

Thanks. Satya, can you give us your overall macro view? There were some comments you had made that concerned, I think many about the state of the U.S. spending environment. I am just curious if you could comment and follow-up on what you are seeing there just from a spend environment throughout the year. I think many came away with that you are seeming that you were saying it’s getting worse, not better. Can you just give us a little more color on that? Thank you.

Satya Nadella

Thank you, Brent. And first of all, I was making a comment which was sort of a global comment, not just a specific U.S. comment. I mean there is only – I always sort of subscribe to that there is only one law of gravity that I think all of us are subject to, which is inflation-adjusted economic growth in the world. And then how many times that do we grow, because as I have said in my comments that I fundamentally believe tech as a percentage of GDP is going to be much higher and on a secular basis. So, the question is how many times is it given the overall inflation-adjusted economic growth. So, that’s kind of how I look at it. Given that, I think the two things that we see, we commented on that even in the last quarter, and it’s even in the outlook, which is the thing that customers are doing is what they accelerated during the pandemic. They are making sure that they are getting most value out of it or optimizing it and then also being a bit more cautious on given the macroeconomic headwinds out there in the market. So, given those two things, the point is at some point, the optimizations will end. In fact, the money that they save in any optimization of any workload is what their cloud into workloads. And those workloads will start ramping up. And so one of the key things we are watching for, Brent, is to make sure that we are gaining share in this space through our value propositions, so and even build loyalty with our customers so that long-term, we are well positioned for share gains. So, that’s sort of fundamentally how we view it. And then the other aspect I would also say is simultaneously investing in this new AI trend, because I don’t think any application start that happens next is going to look like the application starts of 2019 or 2020. They are all going to have considerations around how is my AI inference performance, cost, model is going to look like, and that’s where we are well positioned again. So, that’s how I view it. The market, you all are better readers of, quite frankly, what’s happening out there. We can tell you what we see. What we see is optimization and some cautious approach to new workloads and that will cycle through, but we do fundamentally believe on a long-term basis, as a percentage of GDP, tech spend is going to go up.

OpenAI was discussed on the call, and the CEO said what I would expect him to say – which is that Microsoft is strong in many areas of AI. For example, Github CoPilot offers auto complete coding suggestions and has 1 million users.

Conclusion:

We continue to like Microsoft for its bottom line and its ability to sell into enterprises. I believe this is the key thing missing in many of the other mega cap companies with AI/ML and other related ambitions, which is Microsoft owns the perfect customer base to ramp AI applications – which is the large budgets of the Fortune 500. Startups drive this too but not at the scale of the Fortune 500 and Fortune 2K.

We want to build this position on any weakness although we want to be sensitive to timing as we’ve been discussing for some time now that cloud budgets may be the next shoe to drop. The lack of a FY2023 guide from the cloud bellwether, although citing consumer, didn’t provide much information in terms of what the CY2023 cloud budgets are looking like. I think reading between the lines, even without a fiscal year guide, Azure’s further deceleration next quarter isn’t painting the best picture of cloud budgets.

On a side note, I am not sure what the tax implications of TCJA will be for other companies in the tech industry given the industry’s large R&D spending. After reading about the Tax Cuts and Jobs Act, it certainly doesn’t seem like it will be isolated to Microsoft and rather it will affect R&D investments primarily made outside the United States (foreign versus domestic R&D). Perhaps other Big Tech earnings next week will help shed some light on what to expect.

Posted in Cloud, Tech StocksLeave a Comment on Microsoft FYQ2: Guidance Weaker than Expected

Q1 Webinar Highlights

Posted on January 20, 2023June 30, 2026 by io-fund

Below is an excerpt from the I/O Fund team on what to expect for the upcoming earnings season. We discuss some trends we will watch during the earnings season. We do it every quarter, and it is not an earnings call or prediction, as anything can happen during an earnings season. It’s an opportunity for us to go over our fundamental research with our members.

  • Portfolio Manager Knox Ridley talks about the broad market. He compares ARKK, which includes innovators of the future companies, with the Dow Jones Industrial Average. ARKK has not even tested its bear market trendline and is only 5% off the October 13th low. On the other hand, the Dow has broken its bear market trendline and is 18% off the October 13th low. It suggests that the market is rewarding the value companies.
  • The semiconductor sector is outperforming all the sectors since the October 13th low. We are investing in this new trend. On the other hand, Crypto and other high-beta stocks are getting punished.
  • The two important themes for 2023 that we will closely watch is the weakening US Consumer and the Bank of Japan losing control of its bond market.
  • Lead Tech Analyst Beth Kindig says that in the current environment, we will give out fewer company names to our premium members this year as it is difficult to clear the high bar set to be considered quality companies. We would mainly look for companies in this quarter that are accelerating bottom line, and if we get potentially accelerating top line, that would be a nice combo.
  • On the trends, the ad-tech sector is not expected to do well in 2023. CTV ads will lead the market. We don’t want to front run ad-tech and want to wait for the evidence of a bottom.
  • The semiconductor companies are expecting a turnaround in the second half of 2023.
  • Equity Analyst Royston Roche says that most of the cloud companies have shown a notable sequential decline in growth from Q3 to Q4. So, we have been cautious until we get some concrete information, which is why we will remain on the sidelines and keep a watch on the earnings.
  • Solar stocks were the winners in 2022 as they will benefit from the Inflation Reduction Act of 2022 in the next few years. The expected revenue growth rate is over 30% for the major renewable companies for the full year 2023. Q1 revenue growth is also strong.
Posted in Broad Market Today, Crypto Investment, E-Commerce, Market Trends, Semiconductor Stocks, SemiconductorsLeave a Comment on Q1 Webinar Highlights

VIDEO: January Stock Market Correction Explained

Posted on January 20, 2023June 30, 2026 by io-fund
VIDEO: January Stock Market Correction Explained

In late November, we warned our readers that December could be a volatile month. The recent bounce in January also provided some warning signs, which we used to get defensive.

Now that the market has pulled back, some expect a quick bottom to resume the uptrend. However, based on what various markets are telling us, we think that this pullback has the potential to continue into February.

As we stated before, as long as the Dow holds its October 13th low, we view any additional weakness to be a tremendous buying opportunity as we setup for a push towards 4400 SPX later in the year.

For more updates, follow the I/O Fund on YouTube.

Posted in Broad Market Today, Macro Trends, Market TrendsLeave a Comment on VIDEO: January Stock Market Correction Explained

Netflix Q4 Earnings: Comments on Accelerating Revenue in Q2/Q3

Posted on January 20, 2023June 30, 2026 by io-fund

Netflix reported in line on revenue and handily beat on net additions. The miss on EPS is being forgiven (it seems) as the EPS miss is due to FX remeasurement on Euro denominated debt. The market has been overlooking FX adjustments on other companies, as well.

The management team was able to provide a strong guide on free cash flow of $3 billion for FY2023, which is what we wanted to see. They reiterated a consistent operating margin, and most importantly, on the earnings call they said the words “accelerating revenue” starting in Q2. Because that discussion is important, I’ve included excerpts of the transcript below.

On our Q1 Kickoff webinar, we described the types of earnings reports we would want to buy this earnings season, and Netflix ticked those boxes. That is, a stronger bottom line in terms of cash flow, and an acceleration in revenue. The operating margin is expected to be flat but will be higher on absolute profit. We have it penciled in to watch for further improvement on OM in FY2024.

You can access our pre-earnings write-up on the forum here.

Q4 Financials:

Netflix reported revenue of $7.85 billion, in line with the $7.84 billion estimated per analyst consensus. This represents growth of 1.9% or 10% on a constant currency basis. EPS was expected to be $0.50, per analyst consensus. Netflix missed this estimate and reported $0.12 EPS.

The company stated the following:

“EPS in Q4’22 was $0.12 vs. $1.33 in Q4‘21. This was below our $0.36 forecast due to a $462M non-cash unrealized loss from the F/X remeasurement on our Euro denominated debt as a result of the depreciation of the US dollar vs. the Euro during Q4’22."

If you factor in the $462M, it would have been $1.15 EPS.

The guidance for next quarter was in line at $8.17B on revenue compared to analyst estimates of $8.13B. The EPS for Q1 guide was a bit weak, but this is likely due to FX. Analyst expectations for Q1 were $2.98 with management guiding for $2.82 EPS for fiscal Q1.

Paid net additions (or new subscribers) came in at 7.6M compared to 4.5M expected. Analyst consensus ranged between 4M and 5M going into earnings. EMEA had the highest growth followed by APAC. Notably, United States and Canada contributed 1M whereas in the past UCAN was flat or showed nominal churn. As stated on the forum, Netflix will no longer be guiding or reporting on this key metric, and will instead, guide on revenue.

“As discussed in previous letters, we are increasingly focused on revenue as our primary top line metric. This will become particularly important heading into 2023 as we develop new revenue streams like advertising and paid sharing, where membership is just one component of our revenue growth. So, starting with our Q4’22 letter in January of 2023, we’ll continue to provide guidance for revenue, operating income, operating margin, net income, EPS and fully diluted shares outstanding for the following quarter, but not paid membership. Similar to our regional membership disclosure, we’ll continue to report our global and regional membership each quarter as part of our earnings release.”

Margins:

The margins came in as expected, no surprises in either direction. The reason the margins look weak is because management has stated “The fourth quarter is typically our lowest operating margin quarter of the year as it’s usually our largest quarter in terms of content and marketing spend. In addition, the aforementioned F/X impact has a high flow through to operating income (~75%-80% of the revenue impact) as most of our costs are in US dollars.”

  • Gross margin was 31.1% compared to 32% in the year ago quarter.
  • Operating margin was 7% compared to 8% in Q4 last year. FY2022 operating margin was 18% although excluding restructuring charges would have been 20%. For FY2023, the guide was 19-20%. The guide for Q1 is 20% which is lower than last year due to content costs.
  • Net profits were slim at $55 million compared to $163 million expected. This is where the $462M non-cash F/X remeasurement is reflected.
  • Adjusted EBITDA came in at 10.1% for the quarter and 20.4% for FY2022.

Cash Flow

Cash flow for FY2022 came in at $1.6B and management guided for $3 billion in FY2023. The $1.6B in FY2022 compares to ($158) million for FY2021. Overall, this is a very different Netflix today as the company lost over ($3) billion in free cash flow in 2019.

The company’s gross debt is $14.3 billion and the company’s net debt is $8.37 billion or 1.3X LTM EBITDA with $6.05 billion in cash. Note: these numbers have been updated per the Q4 ER. You’ll notice the LTM slightly ticked up from 1.2X LTM last quarter. To reiterate, this is because Q4 tends to be weaker than other quarters. With the $3B in FCF expected in FY2023, Netflix will be able to get the LTM below 1X.

The gross debt will still outweigh cash for some time. The company has stated investors can continue to expect $10 to $15 billion in gross debt. According to the last 10-Q, the company’s next payment of $400 million is due in October of 2024.

That debt level is exorbitant, yet interesting enough, Netflix believes their competitors are faring much worse, per their Investor Letter: “our best estimate is that all of these competitors are losing money on streaming, with aggregate annual direct operating losses this year alone that could be well in excess of $10 billion, compared with our +$5-$6 billion of annual operating profit.”

Earnings Call:

In terms of cutting off password sharing, this was one of the most important comments on the call, where management is implying an acceleration in revenue sometime in Q2-Q3.

Jessica Reif Erlich (Moderator)

Can you provide any details, including the time frame for converting borrowers to paying accounts?

Spence Neumann (CFO)

“[…] so those dynamics that Greg just walked through, because of that as we kind of start to roll this out later in Q1, based on the timing, what we talked about is that we will have modest growth we expect in paid net adds in Q1, but kind of atypical seasonality, where typically Q2 would be a softer pay-at-ad quarter. It will probably be a larger paid net add quarter. And most importantly, what we’re most focused on is obviously revenue. That is our primary metric. And what you see is in the guide, these revenue initiatives between paid sharing rolling out and then scaling ads, you don’t see much of that in Q1, which is why we are forecasting 8% growth FX neutral in Q1 revenue. But throughout the course of the year, we would expect to see accelerating revenue growth as we roll out page sharing broadly across our business and then obviously, scale adds throughout the year, which is a more gradual build. So I just want to kind of highlight that, and that’s kind of what you’re seeing in the guidance.”

Jessica Reif Erlich (Moderator)

And given the revenue drivers of paid sharing and advertising, how are you thinking about price increases in the current year? Is it just too complicated? How are you thinking about it?

Greg Peters (Co-CEO):

Well, I would say the two initiatives that you described represent the bulk of our pricing strategy in ‘23. We anticipate that they’ll both be revenue positive, revenue accretive significantly […] And then we will go back and opportunistically ask for them to pay a little bit more so that keep this virtuous cycle going and really invest that back into incredible content and stories.

Ted Sarandos (Co-CEO):

[…] And so it’s across film, across television. It’s the content that people must see and then it’s on Netflix gives us the ability to do that. And we are super proud of the team and their ability to keep delivering on that month-in and month-out, and quarter-in and quarter-out and continuing to grow in all these different market segments that our consumers really care about. So, that to me, is core to all these initiatives working, and we have got the wind at our back on that right now.

My note: I wanted to bold the last part about content because I believe this is very important as to why Netflix has the brand leverage to cut off passwords and offer an ad tier successfully. It’s partly due to offering so much content that people “must see.” Wednesday saw 341 million hours viewed in one week and holds the new record over Stranger Things 4.

Below is a Nielsen ranking of the Top 10 Shows streamed in a given week published on Deadline around Thanksgiving. All 10 spots are taken by Netflix. Although this fluctuates and is only a sample of one week’s rankings, it demonstrates the type of influence Netflix has on viewership and engagement, competitively speaking.

Here was another important comment about revenue acceleration and an expanding bottom line when the moderator asked about Free Cash Flow (notably, they did not correct her when she said FY2024 FCF)

Jessica Reif Erlich:

So, let’s move away from content then. So, free cash flow. First of all, like, what an inflection point, $1.6 billion in ‘22, roughly $3 billion in ‘23, $4 billion plus probably in ‘24. Can you just talk about – historically, you have been more build than buy. Is there any change in philosophy as cash starts accelerating? Can you talk about overall capital priorities? And what’s driving that operating margin increase?

Spence Neumann:

[..] We are now into New Year, so we take it forward to January ‘23 to current rates, and that’s a range of our operating margin guidance of 18% to 20%. So, now FX neutral for ‘23, we are going to manage within that band to deliver at least within 18% to 20% operating margin guide. So, that is growing margins, growing absolute profit. And really what’s reflected in there is that this – we have high confidence in our ability to accelerate revenue throughout the course of the year as we scale ads and we launch paid sharing. We have got high confidence in improving the service and the strength of our content slate with everything that Ted discussed here on the call. And we are also continuing to manage our cost structure with increasing discipline. You saw that in the back half of ‘22 with our slowing expense growth and we will carry that through similarly in ‘23. So, that all lends itself to our focus, which is kind of healthy growing double-digit revenue growth and accelerating that revenue growth throughout the year, expanding our – both our absolute profit and profit margin and then growing positive free cash flow.

We will obviously know a lot more over the next couple of quarters, a few quarters as we roll out paid sharing, and we will update guidance as appropriate. But that’s what plays through and then also plays through that cash flow generation that you see, where we believe with all those dynamics and managing at about the same level of cash content spend that we will have more than $3 billion, at least $3 billion of free cash flow in the year.

Conclusion:

Management sounded more confident than usual about the password sharing and the new ad tier, and I’m guessing the confidence comes from the testing they’ve been doing. For us investors, it sounds like they will be right on time with a Q2-Q3 revenue acceleration. I did not expect them to blatantly state there would be a revenue acceleration after Q1, but in this tough market, I’ll take it.

The company also did a good job of discussing a better bottom line, of sorts. The free cash flow is clearly improving yet I’ve also seen analyst notes that point toward a better operating margin being forecast for FY2024. Overall, the comments listed above hinted towards higher revenue while confirming a consistent to improving bottom line.

FX can be a lot to unpack but I believe the market is taking into account the $462 million FX remeasurement and seeing this as $1.15 EPS rather than $0.12 EPS. This is why we want to do proper due diligence (and steer clear of social media for investment research — that's an understatement) as there was some confusion over this that negatively spiraled on Twitter.

I would also say that Reid Hastings stepping down should not be a huge surprise as he’s been Co-CEO for over two years since Ted Sarandos became Co-CEO in July of 2020. I kinda got the feeling on the call that perhaps Hastings is stepping down right now because the company is about to have some strong quarters – that’s pure speculation about his chosen timing – but I figure if a company has become your magnum opus, it makes sense to exit when it’s on solid ground.

Posted in Ctv, MediaLeave a Comment on Netflix Q4 Earnings: Comments on Accelerating Revenue in Q2/Q3

Interview with Real Vision: Nvidia is the #1 AI Stock and Why Cloud Looks Weak

Posted on January 13, 2023June 30, 2026 by io-fund
Interview with Real Vision: Nvidia is the #1 AI Stock and Why Cloud Looks Weak

Last week, I joined Samuel Burke from Real Vision to discuss “3 Ideas.” We discussed why I see Nvidia as the #1 AI stock and also why cloud is weaker than it appears.

View the Clip on Twitter hereView the Clip on Twitter here

The full 30-minute video is available here with a Real Vision subscription or 7-day free trial.

 For more information on our Nvidia thesis, you can access previous research here:

  • Nvidia Stock: Evidence Gaming Bottomed and Why It’s Important
  • Nvidia Stock is Ready to Rumble with RTX 40 Series and H100 GPUs
  • Here’s Why Nvidia Will Surpass Apple’s Valuation in 5 Years

 For more information on why Cloud is Weak, you can access our previous research here:

  • Slowing Growth in Cloud Stocks: When Will We Hit a Bottom

 The I/O Fund offers a $99/year subscription tier that offers more weekly research. We offer a Pro and Advanced subscription tier that offers deep dives and real-time trade alerts. Learn More here.

Posted in AI Stocks, Data Center, Data Center and Processing, Semiconductor StocksLeave a Comment on Interview with Real Vision: Nvidia is the #1 AI Stock and Why Cloud Looks Weak

Posts navigation

Older posts

Recent Posts

  • The IPO Glut of 2020: Why Valuations Have Gone Too Far
  • Zoom Discusses Two Important Catalysts In Q1 Earnings
  • Three Risk Management Tools the I/O Fund Offers
  • Micron Is Up 900%. Here’s Why the AI Memory Trade May Still Have Room to Run
  • Credo: Reliability Leader Aggressively Moves into Optics

Recent Comments

No comments to show.

Archives

  • June 2026
  • May 2026
  • April 2026
  • March 2026
  • February 2026
  • January 2026
  • December 2025
  • November 2025
  • October 2025
  • September 2025
  • August 2025
  • July 2025
  • June 2025
  • May 2025
  • April 2025
  • March 2025
  • February 2025
  • January 2025
  • December 2024
  • November 2024
  • October 2024
  • September 2024
  • August 2024
  • July 2024
  • June 2024
  • May 2024
  • April 2024
  • March 2024
  • February 2024
  • January 2024
  • December 2023
  • November 2023
  • October 2023
  • September 2023
  • August 2023
  • July 2023
  • June 2023
  • May 2023
  • April 2023
  • March 2023
  • February 2023
  • January 2023
  • December 2022
  • November 2022
  • October 2022
  • September 2022
  • August 2022
  • July 2022
  • June 2022
  • May 2022
  • April 2022
  • March 2022
  • February 2022
  • January 2022
  • December 2021
  • November 2021
  • October 2021
  • September 2021
  • August 2021
  • July 2021
  • June 2021
  • May 2021
  • April 2021
  • March 2021
  • February 2021
  • January 2021
  • December 2020
  • November 2020
  • October 2020
  • September 2020
  • August 2020
  • July 2020
  • June 2020
  • May 2020
  • April 2020
  • March 2020
  • February 2020
  • January 2020
  • December 2019
  • November 2019
  • October 2019
  • September 2019
  • August 2019
  • July 2019
  • June 2019
  • May 2019
  • April 2019
  • March 2019
  • February 2019
  • January 2019
  • December 2018
  • November 2018
  • October 2018
  • September 2018
  • August 2018
  • July 2018
  • June 2018
  • May 2018
  • April 2018
  • February 2018
  • January 2018

Categories

  • 5G
  • About
  • Accounting Tips
  • AdTech
  • Ai Platforms
  • Ai Platforms
  • Ai Platforms
  • Ai Platforms
  • Ai Platforms
  • Ai Platforms
  • Ai Platforms
  • Ai Platforms
  • Ai Platforms
  • Ai Platforms
  • Ai Platforms
  • Ai Platforms
  • Ai Platforms
  • Ai Platforms
  • Ai Platforms
  • Ai Platforms
  • AI Stocks
  • AI Stocks
  • Analysts
  • Application Monitoring
  • Application Monitoring
  • Applications
  • Applications
  • Applications
  • Applications
  • Applications
  • Applications
  • Applications
  • AR
  • Audit Reports
  • Autonomous Vehicles
  • Autonomous Vehicles
  • Autonomous Vehicles
  • Autonomous Vehicles
  • Autonomous Vehicles
  • Autonomous Vehicles
  • Autonomous Vehicles
  • Avod
  • Avod
  • Battery Charging
  • Bear Market
  • Bitcoin
  • Bitcoin
  • Bitcoin
  • Bitcoin
  • Bitcoin
  • Bitcoin
  • Bitcoin
  • Blockchain
  • Blockchain
  • Blockchain
  • Blockchain
  • Blockchain
  • Blockchain
  • Blockchain
  • Broad Market Today
  • Bull Market
  • Bull Market
  • Chainlink
  • Chainlink
  • Chainlink
  • Chainlink
  • China Stocks
  • Cloud
  • Cloud Infrastructure
  • Cloud Infrastructure
  • Cloud Infrastructure
  • Cloud Infrastructure
  • Cloud Infrastructure
  • Cloud Infrastructure
  • Cloud Infrastructure
  • Cloud Platforms
  • Cloud Platforms
  • Cloud Software
  • Cloud Software
  • Cloud Software
  • Cloud Software
  • Cloud Software
  • Cloud Software
  • Cloud Technology
  • Company
  • Company
  • Console Gaming
  • Console Gaming
  • Console Gaming
  • Consumer
  • Consumer
  • Consumer
  • Consumer
  • Consumer
  • Consumer
  • Consumer
  • Consumer
  • Consumer
  • Consumer
  • Consumer
  • Consumer
  • Consumer
  • Consumer
  • Consumer Tech
  • Corrections
  • Crypto Investment
  • Ctv
  • Ctv
  • Ctv
  • Ctv
  • Ctv
  • Ctv
  • Ctv
  • Ctv
  • Ctv
  • Ctv
  • Cybersecurity
  • Cybersecurity
  • Cybersecurity
  • Cybersecurity
  • Cybersecurity
  • Cybersecurity
  • Cybersecurity
  • Cybersecurity
  • Cybersecurity
  • Cybersecurity
  • Cybersecurity
  • Cybersecurity
  • Data
  • Data Analytics
  • Data Analytics
  • Data Analytics
  • Data Center
  • Data Center
  • Data Center
  • Data Center
  • Data Center
  • Data Center
  • Data Center
  • Data Center
  • Data Center
  • Data Center
  • Data Center
  • Data Center
  • Data Center
  • Data Center
  • Data Center
  • Data Center and Processing
  • Data Warehousing
  • Data Warehousing
  • Data Warehousing
  • Data Warehousing
  • Databases
  • Databases
  • Databases
  • Databases
  • Dating
  • Defi
  • Digital Ads
  • Digital Ads
  • Digital Ads
  • Digital Ads
  • Digital Ads
  • Digital Ads
  • Digital Ads
  • Digital Ads
  • Digital Ads
  • Digital Ads
  • Digital Ads
  • Digital Ads
  • Digital Ads
  • Digital Ads
  • E-Commerce
  • Earning Updates
  • Earning Updates
  • Earning Updates
  • Earning Updates
  • Earning Updates
  • Earnings Report
  • Earnings Report
  • Earnings Report
  • Earnings Report
  • Earnings Report
  • Earnings Report
  • Earnings Report
  • Earnings Report
  • ECommerce
  • Electric Vehicles
  • Electric Vehicles
  • Electric Vehicles
  • Electric Vehicles
  • Electric Vehicles
  • Electric Vehicles
  • Electric Vehicles
  • Energy Stocks
  • Enterprise
  • Enterprise
  • Enterprise
  • Enterprise
  • Enterprise
  • Enterprise
  • Enterprise
  • Enterprise
  • Enterprise
  • Ethereum
  • Events1
  • Events1
  • Exchange
  • Faq
  • Finance
  • Financial Analysis
  • Financial Analysis
  • Financial Analysis
  • Financial Analysis
  • Financial Analysis
  • Financial Analysis
  • Financial Analysis
  • Financial Analysis
  • Financial Analysis
  • Financial Analysis
  • Financial Analysis
  • Financial Analysis
  • Financial Markets
  • FinTech
  • Fundamental Analysis
  • Gambling
  • Gaming
  • Genomics
  • Glossary
  • Green Energy
  • Growth Stocks
  • Growth Stocks
  • Growth Stocks
  • Headsets
  • Headsets
  • Health Tech
  • Hydrogen
  • Identity
  • Identity
  • Identity
  • Inflation
  • Inflation
  • Inflation
  • Internet of Things
  • Interviews
  • Interviews
  • Interviews
  • Interviews
  • Investing
  • Investing
  • Ltbh
  • Ltbh
  • Ltbh
  • Ltbh
  • Ltbh
  • Macro Trends
  • Macro Trends
  • Market Trends
  • Market Trends
  • Market Trends
  • Market Trends
  • Market Trends
  • Market Trends
  • Market Trends
  • Market Updates
  • Market Updates
  • Market Updates
  • Market Updates
  • Market Updates
  • Market Updates
  • Market Updates
  • Market Updates
  • Market Updates
  • Market Updates
  • Media
  • Membership
  • Mining
  • Mobile
  • Mobile
  • Mobile
  • Mobile
  • Mobile Gaming
  • Mobile Gaming
  • Mobile Gaming
  • Multimedia
  • Music Streaming
  • NVDA | NVIDIA Corporation
  • Performance Updates
  • Pin Content
  • Podcasts
  • Podcasts
  • Podcasts
  • Portfolio
  • Premium Research
  • Press Releases
  • Press Releases
  • Productivity
  • Productivity
  • Productivity
  • Productivity
  • Productivity
  • Productivity
  • Productivity
  • Reports and Whitepapers
  • Research Services Preview
  • Resources
  • Resources
  • Semiconductor Stocks
  • Semiconductors
  • Semiconductors
  • Semiconductors
  • Semiconductors
  • Semiconductors
  • Semiconductors
  • Semiconductors
  • Semiconductors
  • Semiconductors
  • Semiconductors
  • Semiconductors
  • Semiconductors
  • Semiconductors
  • Social Media
  • Social Media
  • Social Media
  • Social Media
  • Social Media
  • Social Media
  • Social Media
  • Software
  • Software
  • Software
  • Software
  • Software
  • Software
  • Software
  • Software
  • Software
  • Software
  • Software
  • Software
  • Software
  • Software
  • Software
  • Solar
  • Solar
  • Stock Analysis PDFs
  • Stock Updates
  • Stock Updates (Blogs)
  • Supplychain
  • Supplychain
  • Supplychain
  • Supplychain
  • Supplychain
  • Supplychain
  • Svod
  • Svod
  • Svod
  • Svod
  • Svod
  • Svod
  • Tech Podcast
  • Tech Stock News
  • Tech Stock News
  • Tech Stock News
  • Tech Stock News
  • Tech Stock News
  • Tech Stocks
  • Tech Stocks
  • Tech Stocks
  • Tech Stocks
  • Tech Stocks
  • Tech Stocks
  • Tech Stocks
  • Tech Stocks
  • Tech Stocks
  • Tech Stocks
  • Tech Stocks
  • Tech Stocks
  • Tech Stocks
  • Tech Stocks
  • Technical Analysis
  • Telehealth
  • Telehealth
  • Telehealth
  • Telehealth
  • Testing Equipment
  • Testing Equipment
  • Top Tech Stock News
  • Travel
  • Trends Report
  • Tutorials
  • Uncategorized
  • Updates
  • Updates
  • Updates
  • Video
  • Video
  • Video
  • Video
  • Video Footage
  • VR
  • Webinar Alerts
  • Webinar Alerts
  • Webinars
Proudly powered by WordPress | Theme: iofund by iofund.co.uk.