Skip to content
Logo-main-white.860316a8

I/O Fund

  • Home
  • Free Stock Analysis
  • AI Stocks
  • BEST OF 2025
  • Analysts
  • Nvidia Hub
  • About
    • Case Studies
    • About Us
    • Premium Services
    • Pricing
    • Notable Wins
    • I/O Fund Reviews
    • Media
  • Contact Us

Month: April 2022

Microsoft: Eyeing for LTBH position

Posted on April 27, 2022June 30, 2026 by io-fund

We are eyeing a LTBH position for Microsoft. As many of you remember, we’ve owned Microsoft in the past following a spree of analysis published in 2018-2019.

In our latest Q2 webinar, I discussed why reducing cloud costs is a key trend for 2022 and beyond. Most investors on our site agree that cloud is a critical trend to have in a portfolio as it increases productivity and reduces costs. This is especially true for software-as-a-service whereas cloud infrastructure as-a-service does not always result in lower costs compared to on-premise servers.

The overall cost savings and/or overhead can often rely on the size of company, where it’s a no-brainer for startups to rent servers as they don’t have the budget to own servers and manage an IT department. However, we’ve pointed out in an analysis and on our webinar that companies of Dropbox, Asana or Datadog’s size are seeing a hit to their margins. If you add up the cloud infrastructure, platforms and software costs across a company, it can often become costly to manage and deploy a full cloud stack.

To put it simply, Sayta Nadella said in yesterday’s call: “More value for less price means you win.” In the same breath, he also said: “Most businesses are not looking to their IT budgets or to digital transformation for budget cuts.” These two statements echo my first point in the webinar which is that both are true: increase in cloud spending and wanting to lower costs. This is differentiated from budget cuts, such as headcount. Most importantly, our slides showed that despite Gartner’s forecast for 2020-2021 shifting by $100 billion to what became actual spend (or essentially a pull forward). Pull forward might not be the right term, however, as cloud growth is not slowing down as a result, instead it’s predicted to be a tick higher from 2019 to 2022, if we remove the anomalous 2020-2021.

Therefore, we wanted to emphasize that the trend towards reducing costs should not be confused as being prohibitive to the trend for cloud adoption, rather, it can offer investors an edge if they identify what companies serve both needs.

As you can see from our portfolio, we are best-of-breed investors and I do not believe Microsoft is a best-of-breed company, rather they aggregate cloud services to help drive down costs. This is especially attractive for the Fortune 500 whereas startups, SMBs and mid-sized enterprises are likely to seek out and manage a larger portfolio of cloud services from various vendors. We can easily evidence this by Microsoft’s Fortune 500 penetration with 95% using Azure, which was achieved through hybrid computing where Microsoft was first-to-market on serving a mix of on-premise, private and public clouds for their large enterprise customers. Secondly, as this analysis is about, Microsoft is undercutting other services on price to win the aggregate, long-term contract.

Microsoft is using the term Tier 1 workloads to not exclude those outside of the Fortune 500, and the company stated the following in terms of deal size: “The number of $100 million-plus Azure deals more than doubled year-over-year. “

As stated on the I/O Fund Wire, Azure growth of 46% is performing quite well given the tough comps it has overcome, and Microsoft’s best financial metric during this tech selloff is that commercial bookings increased 28% this quarter following 32% increase last quarter. I would look for Azure to remain elevated against AWS and Google Cloud for those two reasons – hybrid cloud leader which attracts large enterprises and its ability to reduce costs with its tech stack.

Despite overall revenue softening from 20% to 18%, Azure remained flat at 46%. This is quite remarkable considering Azure has overcome incredible growth over the past two years. Operating income was up 19% and EPS up 9%. The lower overall revenue guide is driven by gaming and Office 365, both expected to be lower by single digits. Azure growth is also guided to be sequentially lower yet Intelligent Cloud is a stronger-than-expected guide at $21.1 billion and $21.3 billion. This is what is meant by the analyst on the call when they stated: “

Starting in September, we began to position for Big Data, Analytics and ML. Microsoft has grown their Cosmos database (DB) transactions and data volume by 100% year-over-year for the third quarter in a row. Synapse data volume has also doubled. Monthly machine learning inference requests increased 86% year-over-year. Takeaway: Let’s hope this translates well for our larger holdings MDB and SNOW, and our placeholder on CFLT. This was also covered in the Q2 2022 webinar.

According to our research, cybersecurity is the top tech vertical for increased spending from 2021 to 2022. Microsoft is increasingly becoming a cybersecurity company, as well, with $15 billion in revenue and growing at a rate of 45%. Microsoft was careful to build a multi-cloud product and is the only Big 3 cloud vendor to be multi-cloud on security right now.

On a side note, not only does Datadog, SentinelOne and Cloudflare participate in cybersecurity here but they also reduce costs through standardization and/or eliminating object storage fees.

Catalysts

There are a few reasons Microsoft can continue to do well, in addition to its proven strategy to onboard large enterprises and lock them in by optimizing workloads for Azure and its broader suite of cloud platforms and services. The first reason is that I believe Microsoft will own the edge. The company is closely partnered with many telecoms and has the most data centers in the world. Another reason is that when more enterprises adopt AI/ML, whether it’s automation, super computers and/or other use cases for training and inference, it will a natural decision to use Microsoft if they’re already optimized for Azure. In other words, Tier 1/Fortune 500 are likely to be the largest customers for AI/ML. Power Automate was up 72% year-over-year, surpassing $2 billion in revenue, although not vendor agnostic like UiPath. Third, the company ranks with Nvidia and Unity for inroads to the Metaverse as it owns many gaming publishers now and is the most widely used VR headset (HoloLens). The company also has Teams to introduce Metaverse-like qualities to business meetings. It will be industrial that drives forward 3D worlds (not consumer) and Microsoft is auspiciously positioned.

These catalysts matter a little less when macro is so tough but worth mentioning as to why investors should look beyond Azure growth when it comes to Microsoft.

Posted in Cloud, Tech Stocks, Tech StocksLeave a Comment on Microsoft: Eyeing for LTBH position

Beth Kindig of I/O Fund Appears on Fox Business News: TSLA, SNAP, ASAN, TWTR

Posted on April 25, 2022June 30, 2026 by io-fund
Beth Kindig of I/O Fund Appears on Fox Business News: TSLA, SNAP, ASAN, TWTR

Beth Kindig of I/O Fund joined Charles Payne of Fox Business News on April 22nd to discuss Tesla’s earnings and what it’ll take to get robotaxis on the road by 2024. She discusses a second company to keep an eye on that will likely safely facilitate more automation within vehicles.

Charles Payne also asked for Beth’s take on Musk’s takeover of Twitter, which Beth believes as a power user, Elon Musk is uniquely suited to clean up the bot issue and low-quality anonymous accounts that prevent advertisers from spending more on the platform. In fact, Twitter can see up to 66% of its traffic driven by bots. 

The interview shifts to discuss what Beth Kindig is looking for from Snap, which she stated “all eyes are on DAUs” or daily active users. Later that afternoon, Snap missed on revenue and earnings, yet beat on DAUs and this helped prop the stock price up during a steep selloff across tech stocks. As Beth had stated, Snap’s stock price following earnings did, indeed, rely heavily on DAU growth and Kindig discusses why this was important to watch going into earnings. Notably, the I/O Fund bought Snap last quarter the day-of earnings for a 58% gain in one day. 

Charles Payne also asks Beth what she thinks of Work from Home (WFH) stocks which Beth states given the cloud sector’s $100 billion pull forward, her analyst team is still tracking higher growth in 2022 than the pre-covid year of 2019. This means cloud should have a steady year and the firm is positioned in Asana and continues to watch Zoom Video, among others. 

Posted in Media, Tech StocksLeave a Comment on Beth Kindig of I/O Fund Appears on Fox Business News: TSLA, SNAP, ASAN, TWTR

I/O Fund Outperforms Leading Active Tech Funds in 2021

Posted on April 24, 2022June 30, 2026 by io-fund
I/O Fund Outperforms Leading Active Tech Funds in 2021

I/O Fund Outperforms Leading Active Tech Funds in 2021

Despite a difficult year for tech stocks, the I/O Fund releases exceptional 2021 results

This press release was originally published on Apr 20, 2022 on Business Wire.Business Wire.

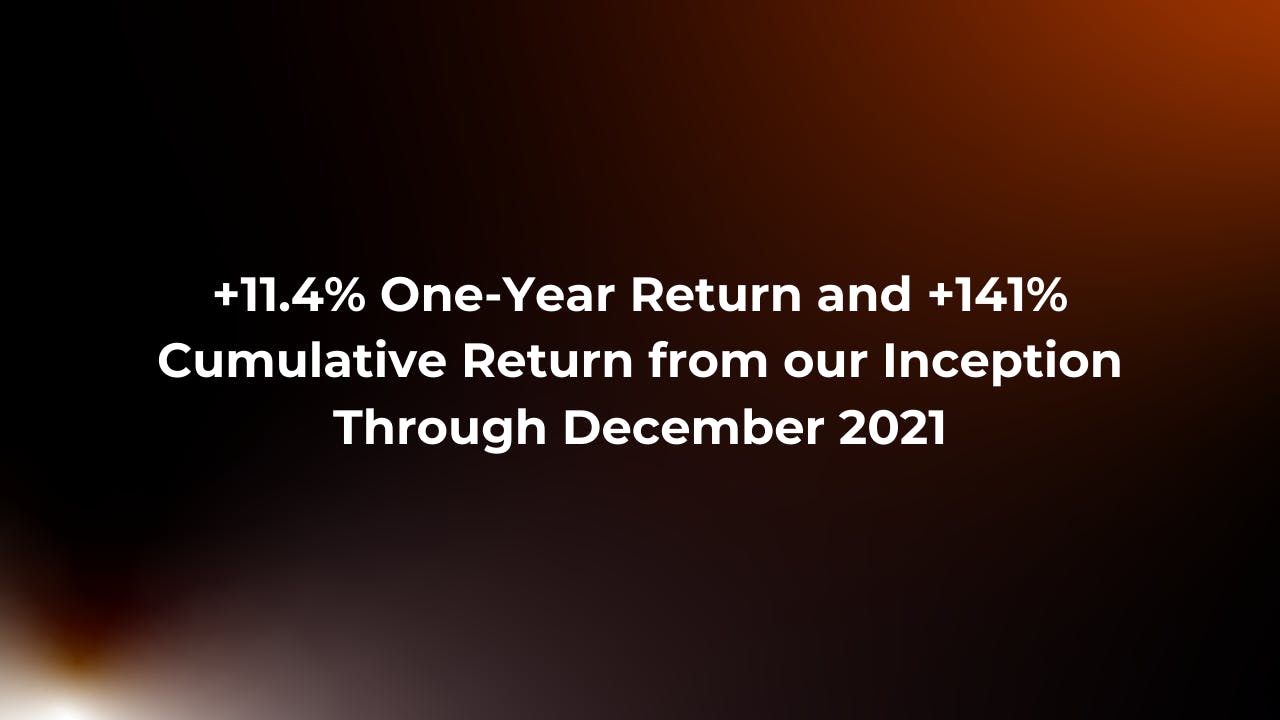
SAN FRANCISCO, CA – (BUSINESS WIRE) – I/O Fund, an actively managed tech portfolio that provides in-depth stock investing research and real-time trade alerts for retail investors, announces a 11.4% return for 2021 and 141% cumulative return from its inception through December 31, 2021. ​​Both figures do not include dividends. These returns were independently audited, and prove I/O Fund’s expertise in the world of tech. 

I/O Fund’s success comes from being first to trends and confidently holding high allocations. In 2021, the all-tech portfolio held an allocation of 30% across leading semiconductor companies and 20% in blockchain assets. The I/O Fund was able to pull ahead of institutional competitors by tactfully selecting leading tech stocks that outperformed in a year when high beta was out of favor.

The 2021 annual report reflects the I/O Fund’s fluency in technology during a turbulent year for tech stocks as the +11.4% returns were nearly 40% higher when compared to popular tech ETFs. On a cumulative basis, the I/O Fund more than doubled the returns from popular tech ETFs since inception. 

I/O Fund 1-Year Returns of 11%

CEO & Lead Tech Analyst Beth Kindig has been covering crypto since 2013, which predates the Ethereum network. Kindig’s in-depth expertise helped the I/O Fund confidently add blockchain positions to an audited stock portfolio with large allocations. The company entered Bitcoin several times in 2020, with entries ranging in the $7,000s – $20,000s, and the I/O Fund rightly trimmed their exposure in Q1 of 2021 in the $52,000 to $58,000 range before the large correction began. I/O Fund premium members were notified of their every move through real-time trade alerts. 

Kindig has also written extensively on Nvidia, predicting that the company would become a leading artificial intelligence stock even when data center revenue was declining. She is a regular contributor to Forbes where she stated Nvidia would become one of the world’s most valuable companies. The I/O Fund leveraged her unique predictions across three additional semiconductor companies, which helped insulate the I/O Fund from weakness in the tech sector.

Sign up for I/O Fund's free newsletter with gains of up to 403% – Click hereSign up for I/O Fund's free newsletter with gains of up to 403% – Click hereClick here

“We firmly believe that tech will generate life-changing gains on Wall Street into the foreseeable future,” says CEO & Lead Tech Analyst Beth Kindig. “We strive to become a valuable resource — and an important alternative to ETFs —- for individuals and funds who are determined to participate in this highly rewarding, albeit volatile, sector.” 

The company also called the two best performing cloud stocks of 2021 – Asana and Datadog. The I/O Fund sold into strength several times, then finally closed their position in Asana with a 286% gain. Datadog was initially bought during the Covid lows at $34.90 with I/O Fund Portfolio Manager Knox Ridley adding to the position several times in 2021, which went on to provide an 80% gain for 2021.

“Our success is largely due to allocations and position sizing,” says Portfolio Manager Knox Ridley. “We were not immune to the tech selloff, rather we use risk management to reduce its impact. Ultimately, we are committed to the tech sector as the world’s leading industry even amidst the current macro headwinds, as we believe the time to be accumulating tomorrow’s FAANGs is when the market is selling out of them.”

The I/O Fund hires an independent accounting firm to conduct its periodic audits. It reviewed statements from January 1st, 2021 to December 31st, 2021 from the fund’s brokerage and blockchain accounts and found no discrepancies.

The I/O Fund publishes institutional-level research in a free weekly newsletter. Premium members have full access to a completely transparent portfolio of 20+ positions, webinars, institutional-level research, real-time trade notifications, and more. 

For more information about I/O Fund, please visit: https://io-fund.com/premium-services-sign-up 

For media inquiries, email us at media@io-fund.com.

Posted in About, Press ReleasesLeave a Comment on I/O Fund Outperforms Leading Active Tech Funds in 2021

2021 Full Year Audited Returns

Posted on April 21, 2022June 30, 2026 by io-fund

We recently released our returns, which continue to be robust despite the risk-off environment in tech. Notably, we are a hyper-growth, high-beta tech fund and we do not switch our positioning by allocating to other industries that might be temporarily in favor, such as energy or commodities. Rather, we believe that tech is the premier sector that is best positioned for long-term growth, and we expect to remain fully allocated to tech throughout the cycle.

However, this doesn’t mean that we do not manage risk, as we constantly look for favorable entries and reduce exposure near tops. We believe that our results highlighted below are strong considering the volatile market in tech during 2021. We discussed our 2021 results during our Q2 2022 Webinar Update, and also discussed our positioning for 2022. For Q2, we believe that we are positioned well to benefit from key trends such as Big Tech Capex, Automotive, and Reduced Cloud Spend and Big Data/Analytics.

Since we are a tech-focused team, we compare our results to leading actively managed tech funds, such as the Ark Innovation ETF and the Morgan Stanley Innovation Inception Fund. As you’ll see in the chart below, we handily beat both of these actively managed funds in a year where high beta tech was out of favor. Notably, this is performance only and excludes dividends, fees and tax distributions.

Our success during the year is attributable to our concentrated holdings in leading industries, such as semiconductors and cryptocurrencies. The I/O Fund made the bold move of placing blockchain assets, such as Bitcoin, Ethereum and Chainlink, into our audited portfolio. Furthermore, we held an average 20% allocation to blockchain assets throughout the year, as we actively managed the position but maintained exposure despite the volatility in the risky asset class. You can read our official press release on the 2021 performance here in Business Wire.

Our exposure to semiconductors has also helped us outperformed other active tech funds. For instance, Ark does not have a single semiconductor company in its top 10 holdings, nor its top 20. We view semiconductors as a major component in the broader cloud complex, which provides the necessary infrastructure to drive key trends forward, such as cloud computing and the adoption of electric vehicles. Stated differently, semiconductors are instrumental in technology innovation. While semiconductors have historically been a highly cyclical asset class, we see signs that the industry is becoming more predictable, which deserves a premium valuation.

We also have high exposure to leading cloud stocks, such as Datadog and Snowflake. We purchased Datadog throughout 2021 and booked gains of around 80% during the year, and also purchased and reduced exposure to leading cloud stocks such as Asana. We note that markets tend to overshoot on the way up and on the way down, which is why it is important to manage risk in a highly concentrated tech portfolio.

We believe that our strong performance during a risk-off environment for high-beta tech proves our deep understanding of tech and our ability to structure a winning portfolio. We remain agile in volatile markets and utilize both fundamental and technical research to understand when and where to allocate in tech.

Performance Review:  

We launched the I/O Fund on May 9th, 2020 and our performance through the end of the 2020 was 115.5%. Our 1-year returns from May 9th, 2020 to May 9th, 2021 was 236% and our initial audit for a 7-month period during 2021 was 28%. You can view this press release here.

We have now reported a full calendar year of performance:

Our full year returns from January 1st 2021 through December 31st 2021 were 11.4%. These returns were independently audited  and highlight the I/O Fund’s ability to deliver favorable results in a period when our sector, high-beta tech, was relatively out of favor. Since inception, our cumulative returns were 141%. We discussed our returns in more detail during our Q2 2022 Premium Webinar Update.

Please note that we do not share the dollar value in our portfolio, so this has been omitted from the report. However, the audited numbers are taken directly from the report shown below. Furthermore, the below performance review takes two to three months to complete, and in this case it took longer. Therefore, we are showing you our 2021 returns today and will update our readers on our 2022 performance in early 2023.

For comparison purposes, we do not calculate total returns on our portfolio. Rather, this is a performance audit that highlights the results from picking stocks, and excludes any fees, dividends and taxes. Total returns from our benchmarks may slightly differ due to dividends, management fees or tax consequences. However, we do take into account the distributions made by the Morgan Stanley Institutional Inception Fund to avoid overly penalizing the mutual fund for year-end distributions. We believe this approach provides a more clear apple-to-apples comparisons of our performance relative to other actively managed funds.

How the I/O Fund Compares:

As noted above, for comparison purposes, we do not calculate total returns on our account. As stated, total returns on Ark Innovation may slightly differ due to dividends and management fees being factored in. In the below table, we highlight a stock-pickers comparison of our performance relative to other funds with no additional income factored in other than stock performance:

We believe that our performance demonstrates our ability to navigate turbulent markets and remain fully invested in tech. While tech may go through periods of high volatility and underperformance, we believe that it will remain the best sector for long-term gains. As such, we remain fully allocated to the sector throughout all cycles but tactfully look to hedge our exposure by moving into stronger industries, such as semiconductors and blockchain tech, when we see signs of strength, and also raising cash when the market appears weak.

We also want to thank our members for believing in a small team that is focused on beating Wall Street. When we launched our retail-focused fund, we aspired to bring institutional level research to investors by forming a small, focused team that cares very much about their chosen specialty. We continue to improve upon on processes and look to strengthen our returns going forward.  

Posted in Portfolio, UpdatesLeave a Comment on 2021 Full Year Audited Returns

Facebook Stock: A Permanent Change To The Business Model

Posted on April 20, 2022June 30, 2026 by io-fund
Facebook Stock: A Permanent Change To The Business Model

This article was originally published on Forbes on Apr 14, 2022,11:41pm EDTForbes on Apr 14, 2022,11:41pm EDT

When a company has an earning miss, the first thing I try to determine is whether the cause of the earnings miss is due to something transient or if it’s due to a permanent change in the story. If the miss is temporary and the market deeply penalizes the company, then there could be substantial alpha. However, we do not think that is the case with Facebook given the company’s guide for 3% to 11% growth next quarter. Instead, we believe Facebook faces a permanent change to its business model.

Below, we discuss the nuances of Facebook’s ad model compared to other mobile ad players and how we came to predict nearly three years ago that Facebook faced insurmountable issues with its product Audience Network. In 2018, we stated the revenue generated from Audience Network was between $5 billion to $10 billion. Fast forward three years, management is stating “the impact of iOS overall as a headwind on our business in 2022 is on the order of $10 billion, so it’s a pretty significant headwind for our business.”

In a series of seven articles including this one on Forbes “Advertising Stocks Face New, Major Challenge with Apple’s iOS 14”, I discussed why third-party data was a significant source of revenue for Facebook despite the company not breaking this out in their earnings reports. Facebook’s business model is fairly complex in how the company collects data, which is why investors are not able to differentiate why Facebook will see a permanent change to its business model while other companies that are dependent on mobile revenue will not.

Below, we go into more detail as to what is unique about Facebook’s business model causing this permanent change following the iOS updates, and why the revenue headwinds could actually exceed $10 billion.

Please note: My firm, the I/O Fund, will hold a one-hour special webinar and Q&A for investors who would like to know more on Thursday, April 21st at 6 p.m. Eastern. Follow me here for more details.Follow me here for more details.

Summary of IDFA Changes:

We want to provide a quick summary on Apple’s IDFA changes for the context of the article. For a more in-depth look, reference my previous analysis here.

The IDFA is a number tied to the device that allows ad exchanges to track user interactions and behavior. The primary function is very similar to cookies in that it helps ad companies store data profiles and preferences for personalized messaging, regardless of which device you are logged into. In addition to targeting, the IDFA also helps with attribution and measurement.

Apple’s IDFA enables the following: user tracking, marketing measurement, attribution, ad targeting, ad monetization, programmatic advertising including DSPs, SSPs and exchanges, device graphs, retargeting of individuals and audiences. Unlike cookies on the web, where there is a tag on the browser, mobile identifiers have much stronger tracking capabilities.

What investors may not realize is that advertising cash machines are largely dependent on tracking software for the high CPMS (cost per thousand views) and CPIs (cost per install) they charge because they can track actions on a granular level even days after a mobile user has seen an advertisement. The mobile users are not aware they are being tracked by many companies they do not have a first-party relationship with (but the developer or publisher does). These developers and publishers must now obtain permission. Without permission, the inventory on mobile becomes less valuable.

Apple Owns the Real Estate

The changes were originally set to take effect in September of 2020 and this was extended to September of 2021. We had covered for MarketWatch in 2019 in an editorial “Governments can’t stop Google and Facebook but Apple Can” that governments had made futile attempts to rein in Facebook’s data collection, but Apple was certainly capable of curbing Facebook and making a serious dent on their business model. In the simplest terms, this is because Apple is the real estate owner. We wanted to make it crystal clear that the market had likely become complacent with near-daily headlines on privacy, but that Apple’s iOS changes were not something to underestimate.

Sign up for I/O Fund's free newsletter with gains of up to 403% – Click hereSign up for I/O Fund's free newsletter with gains of up to 403% – Click hereClick here

Here is what we wrote in 2019 before Apple had announced plans to remove the IDFA:

“The only force that can stand up to the complex tracking methods used by Google and Facebook will be an opposite, yet equal, force. It will not come from governments, which think that paying for search results is the problem. Rather, the problem is the pervasive code and software that continually tracks people, which no competitor can compete with.

Turns out, there is an opposite and equal force in magnitude that has chipped away at the anti-competitive tracking that occurs in the browser with Intelligent Tracking Prevention (ITP). Yet it has not done so on the leakiest device of all: mobile. And that would be Apple.”

We repeated this in 2020 for Forbes when we said:

“This is a problem for the ad industry because it goes well beyond personal sentiments and niceties around privacy and slow-moving government regulations and pits tech giant against tech giant in the black box world of ad software, user tracking and engineered loop holes. There is little question who will win as Apple goes up against Google, Facebook and many others. After all, its Apple’s device, Apple’s operating system and Apple’s app store. The only question is why this hasn’t happened sooner.”

Given that Apple delayed the release of the IDFA changes, we reiterated (again) that we believed Apple’s changes were a reason for investors to stop the music and pay close attention:

“We think when Big Tech goes up against Big Tech, that investors should watch the outcome closely. Our stance for the past two years is that Apple owns the real estate on iOS, and everyone else is renting […].”

We provided the following statistics to support an upcoming Facebook miss. Primarily that models were suggesting a 7% decline if 20% of iOS users opt-in and Flurry had stated about 20% were opting in. Meanwhile, according to Bloomberg, some agencies were reporting that companies went from spending “nearly all” of their budget on Facebook to more around two-thirds or half of their budget due to the iOS tracking changes.”

IO Fund Chart showing company price % change

Pictured Above: Since the time of my first analysis that Facebook would stumble in April of 2018, other FAAMGs have returned nearly 4X to 10X more. Compare this to the 448% returns from Facebook in the previous five years (2013-2018). – I/O FundPictured Above: Since the time of my first analysis that Facebook would stumble in April of 2018, other FAAMGs have returned nearly 4X to 10X more. Compare this to the 448% returns from Facebook in the previous five years (2013-2018). – I/O Fund

Notably, Google is a large real estate owner too and Facebook mentioned in their most recent earnings call that “search ads could have access to far more third-party data for measurement and optimization purposes than app-based ad platforms like ours” – meaning, Google will fare the changes quite well.

Audience Network and Third-Party Data

Facebook is not unique in making the bulk of its revenue from mobile ads as it’s joined by companies such as Unity, Snap, Twitter, Pinterest, Spotify, Tik Tok and more. However, there are key differences to how Facebook generates high ARPU compared to these other mobile applications.

Audience Network is unique in the advertising world as it mixes together first-party data and vast amounts of third-party data to broker ads outside of Facebook’s applications. In this case, the reason Audience Network is unique is because Facebook is able to mix data from its 2 billion users to broker ads across 40% of the top 500 apps on the market. Unity and The Trade Desk play similar roles on the supply side and demand side, but they do not mix first-party data as a publisher with third-party data as an advertising platform. Audience Network blurs these important lines on how data is used (notably, Google does too, and Twitter/MoPub).

The last time Facebook reported Audience Network numbers, it served advertisements to over 1 billion people per month at the end of 2016. To compare, Instagram had 500 million users in 2016. This also means Audience Network reached twice as many people as Whatsapp at time of acquisition, which was valued at $19 billion with 484 million users.

Here’s a statement issued by Facebook on Audience Network’s reach in 2016: “We talk about reaching a billion people every month, and these are real people," said Brian Boland, VP of publisher solutions at Facebook. "We're not talking about cookies or browsers or devices or ID, where one person can look like six things. We're talking about legitimately 1 billion people that can be reached on the audience network."- Q4 2016

When I estimated the revenue of Audience Network to be $5 billion to $10 billion in 2018, I was based this on Google monetizing 2 million websites and 650,000 apps for $17 billion in third-party network revenue. Yet, Facebook Audience Network has a larger reach on mobile than Google’s ad network. This is why MediaPost put FAN’s value at $5 billion by 2020 without websites.

Why Audience Network Could Have a Bigger Impact than $10 Billion

The number one thing to understand about Facebook moving forward is that the company enjoyed peak conditions for its data collection practices, but those days are gone. The mobile device is especially leaky in terms of data compared to browsers and Facebook was able to capture a moment in time when that data was freely collected, even by third-parties (in Audience Network’s case, Facebook is an unauthorized third-party).

There are two major impacts that limiting third-party data can have on Facebook. The first impact is accounted for in the $10 billion headwind discussed by CFO David Wehner, which is that Audience Network is rendered useless without proper attribution and measurement. The second impact is that Facebook will have to work with weaker data for their ads on their own properties, as well, which means investors must answer this question: what will Facebook’s ARPU be when targeting is not informed by vast amounts of third-party data?

Facebook's ARPU graph

Facebook’s ARPU graph – I/O FUND

If you look at the graph above, you’ll see something began to change for Facebook’s ARPU around the year 2016. Interestingly enough, user growth on Facebook flatlined a while back and yet average revenue per user skyrocketed.

Sign up for I/O Fund's free newsletter with gains of up to 403% – Click hereSign up for I/O Fund's free newsletter with gains of up to 403% – Click hereClick here

In the 2016 earnings calls, Facebook also warned of ad load issues due to limited real estate in social networking apps. Despite the limited amount of real estate a social media app has to work with, and flat user growth in the United States and Canada, we see that North America ARPU had some sort of catalyst in 2016 that changed its trajectory.

North American ARPU Graph

North American ARPU – I/O FUND

The unusual trajectory that began in the United States and Canada in 2016 has led to outsized ARPU compared to other social media apps. I believe some of the unusual ARPU growth pictured above was supported by Audience Network as the ad network can help eliminate ad load issues. In 2016, Audience Network had scaled to the 1 billion user mark and beyond.

During this time, Facebook doubled the number of advertisers from 3 million to 6 million. It’s true that Facebook has 2 billion users but the far majority are located outside the United States. If we narrow down United States users, which are at 193 million, then it makes little sense that Facebook is able to monetize at such a higher ARPU. Snap has 92 million users in the United States. The only difference in business model is the third-party data, which has now been eliminated.

Please note: we are not predicting a beat or a miss on Facebook’s Q1 earnings report. The I/O Fund clearly plays the long-game with our theses as we first covered this three years ago. However, we believe ARPU erosion will occur over time and will be irreversible unless there is a new catalyst.

What Facebook’s Management Said

Facebook is guiding for sales of $27 to $29 billion in Q1, or growth of 3% to 11%. The company stated the first quarter is impacted by headwinds to both impressions and price growth with iOS changes mainly affecting price growth.

In the earnings call, when asked for clarification on the $10 billion impact, Facebook management stated the following: “Yes, Mark, on the headwind, we're just estimating what we think is the overall impact of the cumulative iOS changes to where 2022 — our 2022 revenue forecast is. So if you kind of aggregate the changes that we're seeing across iOS, that's sort of the order of magnitude. We can't be precise on this. It's an estimate. We've got ranges on the impact to our business. So we think it's a substantial — the substantial headwind to work our way through.”

Management also stated there’s “a clear trend where less data is available to deliver personalized ads” and that “Apple created two challenges for advertisers: one is that the accuracy of the ads targeting decreased, which increased the cost of driving outcomes, the other is that measuring those outcomes became more difficult. These challenges are complex and interrelated.”

Despite Facebook stating they have advertiser tools, such as aggregated event measurement, the company still expects “the overall targeting and measurement headwinds to moderately increase from Apple's changes and from regulatory changes in Q1 and throughout 2022.”

In contrast, after stating advertisers would need to adopt new tools in Q3, Snap went on to report Q4 revenue growth of 42% to $1.29 billion.

Conclusion:

In the same year that we predicted Facebook would stumble at the share price of $219, we also predicted that Nvidia would become an AI leader at the share price of $160. If you put your money into Nvidia at the time of our coverage instead of Facebook, the returns would be 420% compared to 28%.

We firmly believe that knowing product provides a substantial edge to tech investing and this is one example of where nuances are critical to getting in front of the market. On that note, we believe there are substantial tailwinds for a handful of ad-tech companies due to IDFA changes as now first party data is more valuable ever.

The adage that “your loss is my gain” is certainly true in the competitive industry of ad-tech. The $10 billion+ that Facebook has stated they will lose from Apple’s changes will migrate somewhere. We will discuss further where we think the ad dollars could migrate to in an upcoming webinar on April 21st at 6:00 p.m. Eastern. Follow me here for more details.

Posted in Social Media, Tech StocksLeave a Comment on Facebook Stock: A Permanent Change To The Business Model

Roku Stock May Rebound From Easing Supply Chain Issues

Posted on April 13, 2022June 30, 2026 by io-fund
Roku Stock May Rebound From Easing Supply Chain Issues

This article was originally published on Forbes on Apr 7, 2022,11:53pm EDTForbes on Apr 7, 2022,11:53pm EDT

Last week, we discussed signs of improvement at key automotive semiconductor suppliers and why this was affecting ad-tech stocks. Supply chain issues are causing a ripple effect due to automotive being a significant category of ad spend and due to low inventory, advertising budgets are being slashed. As stated in last week’s analysis, our expectation is that supply issues will ease by Q3 causing both automotive and ad-tech to rebound.

Specifically, it’s the extremes of seeing a $300 billion drawdown in inventories in Q2 2020 followed by the largest increase on record of inventory levels in Q4 2021. We believe this sharp rebound helps highlight that production is catching back up with demand.

Supply Chain Impact to Roku Stock and Ad-tech Going Forward

Below, we discuss why Roku stock could be set to rebound when supply chain issues begin to ease due to extreme oversold conditions based on transient headwinds. We also discuss more in depth the supply chain rebound we are forecasting for some time around the second half of 2022.

Chart: 50-year Trend of Changes in Private Inventories

Source: U.S. Bureau of Economic Analysis (I/O Fund)

While supply chain constraints are expected to remain tight in 2022, there are numerous signs that the bottom is in. For instance, aggregate inventories rebounded strongly in Q4 2021 and have made up most of the decline from production halts during Q2 2020. Moreover, inventories relative to aggregate sales are at multi-year highs. The rebound in aggregate inventories suggests that supply chain constraints are normalizing for the broader economy.

Connected-TV (CTV) is particularly exposed to automotive advertising budgets, and a rebound in automotive inventories will be a tailwind for CTV ad-tech companies such as Roku. Automotive ad spend was just 15% of its pre-pandemic levels, largely due to the shortage of automotive inventories.

During the Q4 earnings call (02/17/22), Roku’s management explained how automotive was ‘soft’ during the quarter, yet they expect this to be a temporary trend. Roku CFO Steve Louden made a good point during the Q4 call, stating that automotive manufacturers are much stronger today than they were at the start of the pandemic, meaning that these brands have increased capacity to market their brands going forward.

For instance, if the top two automotive ad spenders (Volkswagen and Toyota) grow their topline by the midpoint of their respective guides and if their sales and marketing margins normalize to pre-pandemic levels, then aggregate ad spending could rise by about ~25% YoY in 2022, up from the ~6% YoY rise in 2021. Rising ad spend from these two leading manufacturers will likely spur marketing investments from peers.

Despite lower growth in Q1, Roku reiterated full year 2022 growth in the mid-30s. Going into the report, analysts were expecting 36% annual growth. The ad platform missed analyst expectations at $703 million compared to $732 million expected.

EBITDA was a miss with company guiding for $55 million compared to the consensus for $79 million in the upcoming Q1 quarter. The company plans to spend $1 billion on operations, which translates to investments in headcount, The Roku Channel (which is producing originals), and the Roku TV program (which means growing operating system market share).

The $1 billion in expenses is not overly concerning although it’s certainly an adjustment in expectations as the Street may have believed that Roku’s earnings were quickly scaling, but this was impacted by a slowdown in expenses during covid, and now those expenses need to ramp in the upcoming year to remain competitive.

Sign up for I/O Fund's free newsletter with gains of up to 403% – Click hereSign up for I/O Fund's free newsletter with gains of up to 403% – Click hereClick here

I/O Fund Financial Analyst Bradley Cipriano stated in a research note to our clients that Netflix's operating expenses ramped nearly $1 billion YoY when it passed $3 billion in revenues in 2011, which Roku is nearing. Viewed differently, the expected revenue growth in FY2022 of $830 million will be accompanied by a $1 billion rise in expenses, meaning that each $1 of expenses will drive just $0.76 of revenue, which is the lowest value in Roku's history. This suggests that growth is much more expensive than in prior years.

However, this is likely due to the slowdown in investments made during 2020 and 2021, and the three-year average for the above metric is 1.08x (including FY2022), meaning that each $1 of expenses resulted in $1.08 in revenues. This is above the prior three-year average of 1.04x (2019-2017), highlighting that over a longer time frame, Roku is in fact demonstrating leverage, albeit it is lumpy. FY2021 and FY2022 also includes the Player gross loss headwind that wasn't the case in prior years, and adjusting for this, the three-year average would be even higher. The takeaway is that the rise in expenses seems in-line with historical trends once we account for COVID.

The lower EPS this year is a headwind to the company's valuation, but it is expected to be profitable in FY2023. The company should be cashflow positive in FY2022 and with $2.1 billion in cash on balance, likely should not need to dilute shareholders despite the losses. There is also some leverage to improve earnings as there were $82m in one-time expenses during the most recent year.

If we widen our view, we will see that 2020 was the first year Roku was EBITDA positive and the company is expected to remain EBITDA positive this year. Most importantly, Roku has leverage with a gross profit of $1.4 billion and they are choosing to spend for top line growth.

Overall, Roku is a more complex product story because the strategy is to conquer from many angles. It’s an ad exchange, it’s a content channel, it’s an operating system and it’s a hardware player. It also owns the best first-party data available on CTV ads and I tend to stick with the data in terms of ad-tech. So, that’s primarily the reason we own Roku and continue to own Roku.

Regarding Roku’s recent price action, we look for dislocations within the markets and we believe transitory supply chain issues have caused the dislocation seen below in Roku’s valuation and its forward estimates. Most of tech has seen a dislocation between January-March, although Roku’s dislocation is particularly steep.

Chart: Roku's valuation and forward estimates

Regarding Roku’s recent price action, we look for dislocations within the markets and we believe transitory supply chain issues have caused the dislocation seen below in Roku’s valuation and its forward estimates. Most of tech has seen a dislocation between January-March, although Roku’s dislocation is particularly steep. (I/O Fund)

What is most striking about the divergence above is that the current selloff has provided a much cheaper stock than during the pandemic when many businesses were shut down entirely and ad budgets halted.

Despite strong growth estimates in the second half of the year, the forward PS on Roku reached 4x, which we consider to be extreme to the downside. We took this opportunity to begin building up Roku and other key ad-tech allocations. We also believe that Q4 2021 will likely represent a ‘bottom’ in automotive supply constraints, and that ad spend from automotive manufacturers will rebound going forward as supply chain constraints begin to ease.

More Data Supports Supply Chain Issues Easing in Q3

Please reference our first article “Supply Chain Issues Could Recover In Q3 2022” Supply Chain Issues Could Recover In Q3 2022” for additional data points.

The surge in raw materials and work-in-process inventory at major auto manufacturers adds further support that auto companies are positioned to quickly ramp production. As shown below in Chart 8 and 9, both aggregate automotive raw materials and work-in-process inventories have increased to a five-year high relative to total inventory.

Chart 8. Aggregate Automotive Raw Materials to Inventory Ratio

Chart: Aggregate Automotive Raw Materials to Inventory Ratio

Source: Auto manufacturer filings (I/O Fund)

Chart 9. Aggregate Automotive Work-in-Process to Inventory Ratio

Chart: Aggregate Automotive Work-in-Process to Inventory Ratio

Source: Auto manufacturer filings (I/O Fund)

What this trend shows is that automotive manufacturers have high levels of working capital stored in near-complete inventory. Once semiconductor supplies arrive, we should expect automotive manufacturers to quickly convert this inventory into finished goods. A build in finished goods inventory should also lead to a strong rebound in advertising budgets from the automotive industry.

Sign up for I/O Fund's free newsletter with gains of up to 403% – Click hereSign up for I/O Fund's free newsletter with gains of up to 403% – Click hereClick here

Since the semiconductor shortage is a systemic issue, we should expect auto manufacturers to ramp spending at the same time. Furthermore, auto manufacturers will likely look to quickly offload their inventory to avoid oversupply and capture market share. This trend should help drive demand for ad spend going forward.

Notably, the timing of this ramp remains unknown, with some auto executives expecting H2 2022 to be a return to normal, and others forecasting a longer horizon. We discussed this trend in more detail in last week’s analysis.

Chart 10. Aggregate Automotive Finished Goods to Inventory Ratio

Chart: Aggregate Automotive Finished Goods to Inventory Ratio

Source: Auto manufacturer filings (I/O Fund)

Automotive semiconductor OEMs report rising inventories and increasing capex

IHS Markit estimated that North American vehicle production in 2021 increased just 1% YoY to 13.1 million. In 2022, vehicle production is expected to rebound and increase 13% YoY to 14.7 million units in 2022 but remain below the 15 million vehicles produced in 2019.

Nonetheless, the rebound in production should support a rebound in ad spend going forward.

While there remains considerable uncertainty due to the cadence of the ramp in vehicle production, there are signs of improvement from key automotive semiconductor suppliers.

For instance, Infineon Technologies, a key supplier of inverters for automotive applications, stated during their latest earnings call (02/03/22) that “the December quarter was the first one in a while where we did not experience [supply] disruptions”. Management added that tightness remains in securing foundry supply, but that wafer supplies are expected to materially improve in the second half of 2022.

The below charts highlight how raw material inventories have been rising for key automotive semiconductor suppliers, a trend that supports a rebound in supply going forward.

A rise in raw materials signals that companies are expected to ramp production in the near term. Furthermore, these automotive semiconductor suppliers have also ramped capacity, as aggregate capex for the group increased 29% YoY to nearly $8 billion. A rise in capex signals that management is increasing supply capacity in anticipation of future demand growth. The concurrent rise in raw materials and capex signals that supply will improve going forward, suggesting that we are nearing a trough in semiconductor imbalances in the auto industry.

Chart 11. Recent Trends in Raw Material Inventories for Automotive Semiconductor Producers

Chart: Raw Material Inventories for Automotive Semiconductor Producers

Recent Trends in Raw Material Inventories for Automotive Semiconductor Producers (I/O Fund)

Chart 12. Recent Trends in TTM Capex from Automotive Semiconductor Producers

Chart: TTM Capex from Automotive Semiconductor Producers

Source: Company filings (I/O Fund)

We believe that 2021 will likely represent a ‘bottom’ in automotive supply constraints, and that ad spend from automotive manufacturers will rebound going forward as supply chain constraints begin to ease. However, semiconductor supply is expected to remain tight throughout 2022, which is the main bottleneck impacting the ramp in auto production. With record levels of idle work-in-process inventory, we believe that auto manufacturers will quickly ramp ad spend to turnover their inventory once semiconductor supply reaches them. With semiconductor OEMs reporting a ramp in both capacity and raw materials, we believe that automotive ad spend will be a tailwind for ad-tech going forward, with a significant ramp in H2 2022 and into 2023.

Roku has been a strong and steady performer in terms of revenue growth and improvement in the bottom line since going public. In six years, Roku has been able to grow its revenue 850% from $398 million in 2016 to an estimated $3.72 billion for FY2022. The Trade Desk will have grown 687% on a lower revenue base while trading 3X higher.

Even with increased spending of $1 billion, it’s important to consider that the company has leverage in its business model. Critics will point out that TTD has a much better operating margin – but time will tell if Roku has chosen the correct strategy to own the real estate. To me, this is arguably the better business model considering the average consumer owns their connected TV for seven years. If so, the current valuation for Roku is too low compared to its forward growth, which made it a buy in Q1.

Financial Analyst Bradley Cipriano, CFA, CPA at I/O Fund, contributed to this analysis.

Please note: The I/O Fund conducts research and draws conclusions for the Fund’s positions. We then share that information with our readers. This is not a guarantee of a stock’s performance. Please consult your personal financial advisor before buying any stock in the companies mentioned in this analysis.

Posted in Semiconductors, Tech Stock News, Tech StocksLeave a Comment on Roku Stock May Rebound From Easing Supply Chain Issues

Avalanche Premium Analysis: LTBH

Posted on April 7, 2022June 30, 2026 by io-fund

We’ve initiated a new position in Avalanche in the LTBH portfolio as we believe the Layer 1 network can compete with Ethereum long-term due to its ability to scale with application-specific subnets. We also like Avalanche for its ability to address security across subnets by leveraging the Primary Network’s validators.

Note: we are eyeing Solana and Aave for new Momentum positions, so keep an eye out for that analysis coming soon.

The crypto landscape changes quickly and owning crypto requires a more active stance. We cannot remove the volatility of crypto for an investor, and we also want to acknowledge that crypto is sheer speculation at this stage. With that said, blockchain is well worth the effort and can be an area where retail has a rare advantage over institutions. There are over 18,000 cryptos on the market as of March of 2022 and we hope narrowing down these names is helpful by showing you where we are invested and our conviction level.

A potential Solana momentum position would be for similar reasons as Avalanche, which are outlined below. To summarize, we want to diversify our Ethereum holding with more Layer 1s. If we enter Aave, this would be in response to Voyager’s most recent regulation as we are bullish on lending and Aave allows us exposure here without the regulatory pressure that Voyager and Coinbase must overcome. We will keep you in the loop on this.

Avalanche Layer 1 Network

As discussed in our YO/LO write-up in November and then our Crypto Webinar which focused on Layer 1s, the Ethereum network is struggling to keep up with traffic and this is illustrated through the network’s exorbitant gas fees.

The term “gas” refers to the computational effort required to execute specific operations on the Ethereum network. Each transaction requires that a fee be paid called “gas” to offset the costs of computational resources.

The market price for gas is determined by demand. If you want your transaction executed quickly or if you have a larger contract, you’ll pay more gas. As of August, the London Upgrade has changed how transactions are charged with every block having a base fee and a minimum price per unit of gas that is calculated based on demand for the block. Users also tip to compensate miners for executing the transaction.

Up until now, Ethereum has been using proof-of-work, which is an algorithm that requires a miner and large amounts of computational power to create blocks and to confirm transactions. Due to the proof of work (PoW) lacking the ability to scale meaningfully, the network can max out during peak traffic, which causes it to become very costly for the transactions being made during peak usage.

Regarding how exorbitant the gas fees have become; we used the example of TIME magazine’s NFTs in our YO/LO report. The NFTs were called TIMEPieces with a price for 10 NFTs costing around 1 ETH or $2500 to $2800. Due to gas fees, one buyer paid as much as $70,000 (?!) In addition, the wait time to transact ranges from 30 seconds to 16 minutes.

This is why Ethereum is merging to Proof of Stake (PoS). Instead of a large consumption of energy, PoS requires a financial commitment of 32 ETH to become a validator. With that said, for the full benefits of Proof of Stake to be realized, shards and rollups need to go live.

Rather than every node downloading every transaction, calculating it and replicating it, shards create a subset of the network where nodes are dispersed for more efficient processing. Rollups allows for hundreds of transactions to be rolled into a single transaction. This replaces Plasma, the current option where only a single transfer is made per transaction.

PoS is set to go live in 2022 while shards and rollups are set to go live in 2023. This provides competitors with an open window of opportunity through 2023 as competing Layer 1s launched with PoS and/or the ability to scale. We’ve covered these in more depth in the past so our Members would be aware that diversification is needed in terms of holding more than one Layer 1 position.

Grayscale recently added Avalanche to their large cap fund, announced April 6th.

YO/LO write-up
Crypto Webinar

AVAX: Application-Specific Subnets

We like Avalanche for its application-specific subnets, which has the potential to scale better than other Layer 1 networks. We also like Avalanche for its endeavor to tackle the single largest issue that the blockchain faces, which is consumer accessibility. The power users for the blockchain today are niche groups: developers, gamers, NFT collectors. We believe Avalanche is attempting to break into a more mainstream audience through its Core Browser and mobile application. These are the main two points we cover below.

Avalanche currently holds the number four spot for Total Value Locked (TVL) at $10 billion yet there is very little separating AVAX from the others in overtaking the Layer 1. When we first covered the crypto, Polygon (MATIC) and Solana (SOL) both had higher TVL. Currently, Terra (LUNA) is in the number two position with $30 billion TVL.

Avalanche was founded on the idea that subnets are the proper way to increase speed and reduce network congestion and gas fees. Avalanche launched with three chains. Per our original write-up: The X-Chain is for creating and exchanging assets including NFTs, the P-Chain validates and creates subnets, and the C-Chain is for executing Ethereum Virtual Machine (EVM) contracts.

At the time, we had said the C-Chain was most critical for AVAX’s growth due to its easy interoperability with Ethereum. The C-Chain is also where DeFi apps are supported, such as Aave and Trader Joe (more on this below). However, in recent months, it seems the P-Chain is helping to carve out a permanent place as a Layer 1, as this chain is what is used to create and manage subnets. The coordination of Avalanche validators occurs on the P-Chain and it can support thousands of subnets and millions of validators, should this scale be needed.

The three primary chains are known as the Primary Network. Avalanche has taken a similar view towards subnets, which is that one chain cannot provide for all applications/use cases, and is encouraging developers to build out application-specific subnets.

Subnets are not an entirely new concept by any means. Ethereum has what is called sidechains. However, there was a major hack on an Ethereum sidechain on March 23rd and this is partly why we are tracking Avalanche more closely.

You can think of subnets as customized chains that allow blockchain verticals to have enhanced function by grouping together like-kind applications. Gaming d’apps would be separate from Decentralized Finance apps (lending, borrowing, payments), which is key because these d’apps have different requirements.

The benefit of subnets is scale. Ethereum is running into issues with 500,000 to 1 million daily active users. Meanwhile, a single mobile application sees hundreds of millions of users, such a Twitter or Spotify. What Layer 1 can handle this level of adoption? That is a platinum-level question for investors to answer. To be clear, it could be Ethereum in 2023 if the developers and users prefer to not migrate. However, if the ecosystem runs out of patience and seriously looks for an alternative, then Avalanche is a candidate.

To summarize, subnets will allow each application to have its own subnet, and subsequently scale without affecting other applications on the blockchain.

Axie Infinity’s Hack on Ethereum Sidechain

Before we talk more about Avalanche’s subnets, I think it would be good to talk about Ethereum’s sidechains. Recently, there was a major hack on an Ethereum sidechain operated by Sky Mavis.

Sky Mavis is the gaming studio that created Axie Infinity, a play-to-earn game that rapidly scaled from 35,000 users in May of 2021 to 3 million daily active users last Fall, representing 3200% growth. The game is especially popular in Southeast Asia. Per our note above, Ethereum has about maximum 1 million DAU, and therefore, Axie Infinity is quite the success story.

Axie Infinity has in-game economics, where you pay to play, and then play to earn. It costs a few hundred dollars to get started on Axie Infinity with game mechanics that are similar to Pokemon Go, except with creatures that trade through NFTs. Axie Infinity ranks third in overall NFT sales at $4.17 billion, second to Opensea’s $23 billion and LooksRare’s $18 billion.

The game is popular for its play-to-earn rewards that allow gamers to earn income from playing the game and building a virtual economy. Gamers have virtual pets that battle and breed, and gamers also raise kingdoms for their virtual pets.

Axie Infinity exploded after the launch of Ronin, an Ethereum sidechain, which removed Ethereum’s congestion issues and reduced transaction costs. Ethereum d’apps that need to scale have taken to sidechains, such as Axie Infinity with the 3200% growth from 30K to 3M users.

Sidechains require validator nodes to review transactions and to confirm that the inputs and outputs match. If any transaction is deemed not valid by the nodes, it will be rejected. However, sidechains are not fully decentralized and the validators can become compromised across both Proof of Authority (PoA) and Delegated Proof of Stake (DPoS). Sidechains are best used for smart contracts that do not hold or require large sums of money on the sidechain.

The unfortunate news last month was that Axie Infinity’s sidechain was hacked around March 23rd with over $600 million in Ethereum and USDC stolen from the Ronin Network. The issue with sidechains is they have fewer nodes validating transactions and this can become a security risk if the majority of the nodes become compromised. In this case, a hacker was able to compromise four of Sky Mavis’ nodes and one community-owned Axie DAO node.

By hacking five out of nine nodes, the hacker was able to override transaction security and withdraw funds. This brings up the discussion of what is decentralization if Sky Mavis operated nearly 50% of the nodes internally.

How Subnet Validators Are Different than Sidechains

Avalanche’s subnets have access to a set of validators already verified and ready to validate subnet blockchains. This is done by adding the subnets ID to a node configuration and by downloading the virtual machine binary. After this, the validators will sync to the subnet and start to validate.

Avalanche validators must validate all three primary chains – the X-Chain, the C-Chain and the P-Chain, also known as the Primary Network. By requiring all validators to validate the Primary Network, the subnets will benefit by instantly having access to a set of validators. In theory, this is more secure than Ethereum’s sidechain as Sky Mavis created their own validators for the Ronin Network.

Avalanche’s Primary Network and subnets are secured by the full staked value of the network. The consensus is inclusive and can be scaled to millions of validators. Subnets can improve the validation process by allowing validators to remain with their chosen applications (i.e., trading NFTs is very different from decentralized finance and validators may have a strong preference towards one over the other). This is an advantage as subnets can require validators meet certain criteria, as well, such as supporting trusted execution environments, which is a hardware isolation mechanism that provides a higher level of security than an operating system alone.

Subnets can also require higher validator uptime, which ideally is close to 100% unless the validator is doing an upgrade. Know Your Customer (KYC) may also become a required standard to where decentralized finance apps disallow full anonymity. In the case of Avalanche, a subnet could require validators adhere to KYC.

Subnets also allow for permissioned subnets to where a decentralized finance subnet could allow for more privacy and regulatory compliance, which is separate from gaming, which does not adhere to financial regulations. For process-intensive applications, rollup-based subnets can be created to process many transactions at once, which would benefit gaming. In this way, application-specific subnets can leverage customization.

Regarding Rollups, this article here points out on #17 something we have covered in the past, which is that time to finality is faster on Avalanche at less than 1 second compared to competitor Solana at about 13 seconds. The point in #18 the author is making is that time to finality becomes quite important for security purposes in the case of Rollups, which roll up many transactions into one. To summarize the author’s thesis: “Avalanche is not reliant on hoping someone checks every transaction afterwards, the entire network checks the validity of the transaction as part of consensus as it’s added to the chain, with sub second finality that can scale to millions of nodes offering incredible security.”with sub second finality that can scale to millions of nodes offering incredible security.”

AVAX’s Core Browser and Mobile App

We believe the best Layer 1 investment will help solve for accessibility around decentralized apps and put the benefits of the blockchain literally into people’s hands. The Core Browser and mobile application will both be live by Q2 of this year, although it’s important to note that Core also functions similar to an operating system.

Our three-part Bitcoin thesis included mobile payments as one tier for Bitcoin to reach its maximum market cap. This is a similar thesis for Layer 1s which is that to reach maximum market cap, the Layer 1 must break outside the niche power users to reach a wider audience for daily transactions and/or daily usage.

I believe Avalanche is attempting to solve the accessibility problem with the Core browser and the Core mobile application. It’s being called a wallet, yet functions as an operating system for d’apps. Metamask is currently on the market and is used for this purpose, yet Core will not be agnostic and will instead attempt to outperform Metamask by offering a cohesive Layer 1 experience for Avalanche chain users.

The customized wallet for the Avalanche chain will enable higher speeds and for subnets to be built out for a better user experience. In turn, more developers may build for AVAX similar to a proprietary iOS/app store. Avalanche is certainly not unique in these ambitions, rather it’s the first to release a browser/app as a means of reaching more users.

The browser extension will launch in March (this month) and the mobile app is expected to launch in Q2. This means Avalanche is moving quickly while Ethereum is stumbling. If Ethereum can’t match Avalanche’s speed and lower gas fees before 2023, then this leaves a year or longer for Avalanche to gain traction on its Core browser and application.

The company has stated specifically that they are going for “mass-adoption of Web3 systems with a smooth user-experience that has never been seen before.” Obviously, this is marketing language yet the statement is true that a great UX has not been seen before and this launch could connect a few critical dots in terms of blockchain users, developers, and the proliferation of the blockchain across devices.

The Core Wallet/OS will have the following features:

  • Enabled with Ledger, the leading hardware crypto wallet
  • Dashboard for cryptos and NFTs personally held by the user
  • Token swap powered by ParaSwap
  • Buy AVAX from the wallet with Moonpay
  • Address book for token addresses

Rather than challenge Ethereum head-on, Avalanche is being more courteous than other networks with the Avalanche Bridge. The Avalanche Bridge launched in July of 2021 a two-way token bridge that enables ERC-20 (fungible) transfers to Avalanche’s C-Chain. This allows ETH to be easily transferred and used on Avalanche. To help illustrate the demand for a new network that supports ETH, the Avalanche bridge has facilitated a total of $43 billion in asset transfers since last summer, eclipsing nearly 3X the total value locked on Avalanche.

The company has now launched a Bitcoin bridge to allow BTC to be used on the Avalanche’s Layer 1 network. This allows for more functionality across decentralized apps on the Avalanche network and also reduces the number of tokens a user needs to manage. Previously, a user would need to wrap ETH or BTC to be used on a network like Avalanche, which creates friction between new Layer 1 networks and these widely held tokens.

The issue that Bridge and Core will solve is that wallets do not function like operating systems so there is a need to transfer the tokens to/from networks for d’apps, and this creates an opportunity for hacks and also creates more friction. Avalanche will now compete with wallets such as Metamask while improving its functionality over other Layer 1 networks by becoming a one-stop shop. Being Ledger-enabled, the wallet should function securely with larger amounts of crypto easily held in cold storage.

Avalanche has a few popular apps, such as Aave which we have held in our YO/LO Fund in the past and we may initiate a new Momentum position. Aave allows users to earn interest by lending assets to creditworthy borrowers and has $21 billion in liquidity locked across 7 networks. As stated above, the #2 Layer 1 has slightly less than this in total value locked (TVL).

Trader Joe is a platform on the Avalanche network that could see a spike of interest when Avalanche releases Core. It includes an automated money maker to help stabilize tokens, allows for yield farming or the staking of tokens for interest, and allows tokens for lending/borrowing. There is $1.5 billion in assets staked to the platform.

Risks:

We’ve noted the sheer competition that all emerging technologies must overcome, with blockchain perhaps seeing more competition than most emerging technologies due to developers being naturally drawn to the philosophy and virtual economies of decentralization.

However, there are additional risks specific to Avalanche which a Member pointed out on our forum, which is the inflation rate of the AVAX token often being in the 20%+ range. It’s important to pay attention to this. The Member pointed towards this source:

https://youtu.be/e6VeFz-Aw8M?t=593
https://youtu.be/e6VeFz-Aw8M?t=795

It’s well worth the time to watch the video with some key points, such as:

  • Avalanche has over 100% inflation rate over the past 12 months with near doubling of circulating supply. This required $8.4 billion to keep it even.
  • The max supply has disappeared from Coin Market Cap, although as the comments out Ethereum and Solana also have no max supply listed. I also checked out Terra (Luna) and it has no max supply listed at this time. It could be due to the deflationary aspects of burning as to why max supply is missing, which is that the total number of tokens will decrease over time at an unknown rate. In Solana’s case, it is potentially missing because the circulating supply has no cap. That’s my best guess.
  • The next 144 million tokens will be released until September of 2024, which will require $450 million or roughly $6 billion per year to keep the token afloat.
  • The presenter expects inflation of 23.5% over the next 12 months.

The one counterpoint I would provide is that Avalanche has the max supply of 720 million (last on record) yet Cardano has low inflation of 1% and max supply of 41 billion. Considering AVAX has a decreasing supply, all things equal, I would prefer the first scenario. This is not a comment about Cardano, it’s only a comment about inflation relative to max supply.

Avalanche has heavyweight backers, such as Andreessen Horowitz and Naval Ravikant. This comes at a cost with insider shares, yet potentially lowers risk if the crypto is attractive to those who are typically very successful in early-stage tech.

Conclusion:

Certainly, crypto is speculative and carries risk, yet we believe this risk will normalize in the near future. The information above discusses why we believe Avalanche has staying power from a product perspective and how it could potentially outpace competitors on decentralization, security and scalability. In our original write-up, we discussed how every blockchain must compromise within these three requirements, and therefore, investors should be looking for which Layer 1 has to compromise the least. There is no simple answer, yet we appreciate (and accept) the challenge in analyzing cryptocurrencies as we believe the rewards will far outweigh the effort this asset class requires. 

Posted in Blockchain, Crypto Investment, Ethereum, LtbhLeave a Comment on Avalanche Premium Analysis: LTBH

Cloudflare – A potential momentum play

Posted on April 6, 2022June 30, 2026 by io-fund

We are planning on entering Cloudflare (NET) as a momentum holding. Beth had recently written about Cloudflare’s product in depth here for Forbes, and a non-paywall version of the article is posted further below. We also posted on the forum here that we are considering both Bill.com and Cloudflare as momentum holdings.

What we really like about Cloudflare is the company’s ability to lower costs in the cloud by addressing Amazon’s AWS “Egregious Egress” fees, placing Cloudflare in direct competition with AWS. Since cloud will be a multi-year secular tailwind for growth, we believe that companies that can lower costs in cloud environments will outperform, and Cloudflare is positioning itself to significantly lower costs for its customers in the cloud.

Another trend highlighting the success of the company is its strong growth rate. Cloudflare just reported its fifth straight year of 50% or more topline growth. McKinsey found that companies that consistently(and sustainably) grow sales >50% CAGR vastly outperformed peers. The study found that >50% CAGR companies reported a 3-year rolling average total stockholder return of 22%, versus a 9% TRS for companies that sustainably grew at a 10-49% CAGR.

Cloudflare is also growing sustainably, evident by its improving cashflows. Free cash flow margin improved YoY from -19% in 4Q20 to 4% in 4Q21 and on a TTM basis, FCF margin was -7%, up from -21% in the year-ago period. Improving cash flows highlights that Cloudflare is not employing a "growth at any cost" model, rather the company is demonstrating leverage, and is actually reporting positive free cash flow while growing at over 50% YoY. Furthermore, cash flow growth is being driven beyond a rise in stock-based compensation (SBC) as SBC increased $34 million YoY in 2021, while free cash flow improved $49 million. It is a positive sign that cash flows are not being driven by higher rates of non-cash compensation expenses and are instead being driven by operating leverage as sales growth outpace expenses. This trend warrants a premium multiple.

Further highlighting the strength in Cloudflare’s topline growth is the improvement in deferred revenue, which is a forward-looking metric. As the name implies, deferred revenue will turn into revenue in the future, adding balance sheet support to future sales. Deferred revenue increased 112% YoY in Q4, its fastest pace of growth on record. Furthermore, deferred revenue has accelerated YoY for six consecutive quarters, further highlighting the increasing demand for its products as customers are increasingly paying cash upfront, a sign of strength. As shown below, deferred revenue has rapidly outpaced the growth in quarterly sales, and deferred revenue-to-three-month sales surged to an ATH of 60% in Q4. This trend suggests that future sales will accelerate, as there is relatively more pre-paid revenue stored on the balance sheet than in prior years. Looking forward, Cloudflare has relatively more support for future sales, which reduces uncertainty and warrants a premium multiple.

Following the company’s strong product positioning, consistent and robust topline growth, and improving financial performance, Cloudflare is priced at a premium valuation. Looking one year forward, Cloudflare trades at a 31x P/S multiple, which is the richest valuation in our universe of cloud stocks. This may appear odd, considering that the company is not expected to grow the fastest, nor does it report the strongest cashflows. However, the company is one of the best-positioned companies, benefitting from two massive secular tailwinds: cybersecurity and cloud. Furthermore, Cloudflare results are high-quality, as deferred revenue has outpaced sales growth for six consecutive quarters, and the pace has recently steepened. Finally, the company’s strong deferred revenue trends suggest that sales may accelerate going forward, which is at odds with forward estimates, which expect 2022 sales to grow 42% YoY to $932 million, a deacceleration from the 52% YoY growth rate in 2021accelerate going forward, which is at odds with forward estimates, which expect 2022 sales to grow 42% YoY to $932 million, a deacceleration from the 52% YoY growth rate in 2021. Nevertheless, the company’s rich valuation leaves little room for a misstep, and we will be monitoring this position closely, which is why we are allocating it to our momentum portfolio for now.  

Below is a repost of Beth's Forbes article on Cloudflare

Cloudflare Stock: Ambitious Company Must Prove Its Valuation

The most exciting products and the most rewarding tech stocks on the market today are the ones that challenge Big Tech. This is because the market will often underestimate the ability of an agile team to disrupt the incumbents despite substantial evidence that this is exactly what the tech industry is built to do.

What’s remarkable about Cloudflare is how the company has leveraged its content delivery network footprint to simultaneously be a leader in application and website security, then to further innovate with Zero Trust security combined with SASE network connectivity, and more recently to leverage the elimination of egress fees for object storage to attract developers. The latter is the most exciting as Cloudflare has already proven its ability in driving down costs and will now take on AWS head-to-head.

However, in light of Cloudflare’s impressive price movement this year, the company is now priced to perfection. When looking at its peers with similar or higher growth rates, which we discuss below, Cloudflare could see a 35% cut in its price to 40X forward sales and the company would still be fully valued.

Below, we look at the products driving Cloudflare to trade at a higher valuation and whether it’s a valuation the company can sustain.

Cloudflare’s Core Products:

Cloudflare is a well-known company that owns a predominant share of the CDN market. Content Delivery Networks contain a cached copy of website content on multiple servers located across the world to help improve page loading times. When a person visits the website, it will provide the content from the server closest to the end-user, which helps increase the delivery speed of the content. When a website is hosted on a server in the United States, the person browsing the website from any part of the globe, like Asia or Europe, will receive the content from the nearest location instead of the server in the USA. The Fastly outage this year shows the prominence of these CDN providers to where one outage can create downtime for sites, such as Amazon, Reddit and the New York Times.

According to data from W3Techs, 81.2% of all websites that use a CDN or reverse proxy rely on Cloudflare. We had discussed in a podcast earlier this year that Cloudflare is strong in the small to medium-sized business (SMB) category and offers free entry-level services. The penetration among SMBs is one reason why Cloudflare has an estimated annual revenue of $648 million this year with over 1 million customers compared to the enterprise-focused Akamai at $3.48 billion with roughly 50,000 customers. The overall revenue is low for its high customer count compared to Akamai partly because of the free-entry level.

According to Intricately, the cloud Content Delivery Network market is expected to grow at a compounded annual growth rate of 28% between 2020 and 2025. Cloudflare has the highest number of customers (this data includes free users). As of June 2020, Amazon Web Services has the highest share among enterprise customers with Cloudflare is in second place. Among the SMB customers, Cloudflare is leading all the other players. Cloudflare also has a better overall rating when compared to Fastly and also compared to Amazon Web Services in the Gartner Peer Insights.

The company has a large free customer base. In addition to the benefit of converting the free base to paid services it can use the free base to test the features before they are launched.

The free user base was mentioned by management in the earnings call,

“One of our secret to success is our broad customer base that we have millions of customers, many of whom use our services for free means that we have an eager pool excited to test new features before they’re released. While traditional B2B companies have extensive QA team, we regularly ask volunteers from our community to be our earliest alpha testers. Our iteration cycles can then be extremely fast. And by the time a feature makes its production at one of our enterprise customers, it’s full of proof, having been through the paces under real network conditions.”

Cloudflare has built a large footprint, which means the company already owns a large portion of the TAM for CDNs. The 81% footprint is impressive but one could argue this leaves little room for growth. Cloudflare’s potential in a largely-commoditized CDN market will come from the “extremely fast” iteration cycle. There’s ample evidence the company can execute as it now owns a large portion of the application and website security market, especially for DDoS attacks (distributed denial-of-service).

Because Cloudflare has a large global presence of servers and data centers, it’s particularly well suited for analyzing traffic to determine security risks. The company is able to analyze and detect attacks by running a background program known as a daemon on every server in every data center. The scans are shared as threat intelligence among the servers in each data center without affecting the latency of the CDN.

Cloudflare is able to mitigate at optimal locations in the tech stack, for example at L4 inside the firewall or at L7 inside the reverse proxy with a 403 error page. The company is advanced at preventing L3 DDoS attacks, which targets network equipment and infrastructure. The benefit of having access to more of the stack for security purposes is that CPU consumption and intra-data center bandwidth remains relatively unaffected. It’s also autonomous so Cloudflare is not using manual employees for this process.

DDoS attacks are essentially bots that send millions of requests to overload servers and to shut down a specific website by targeting its IP address. Often times, these bots are run from devices infected with malware and operated remotely by an attacker. Cloudflare recently detected and mitigated a 17.2 million request-per-second DDoS attack, which was three times larger than any previous DDoS attack on record. This is two-thirds the average rate per second that Cloudflare had served in all of Q2.

DDoS is one example of what the company offers and certainly Cloudflare has other security and network offerings based on their large footprint. They can also cross-sell security and CDN customers with WAN-as-service, or Magic WAN, which connects office networks through the local area network. The company also offers application delivery controllers located centrally within a customer’s infrastructure for Layer 3 through Layer 7 security for applications and APIs.

Cloudflare’s Move into Zero Trust

Across Cloudflare’s security products, an important one to focus on moving forward is Cloudflare One, which is a Zero Trust network-as-a-service. Zero Trust is gaining increasing acceptance due to rising security threats from data not being stored in one place. Secure access service edge (SASE) is a cybersecurity concept that utilizes Zero Trust to identify users and devices to deliver secure access to specific applications or data. The need for this has grown due to remote teams as SASE allows policy-based security no matter where the user, application or device is located.

Zero Trust Security is built on the premise that no one should be trusted within or outside the network. In the traditional security systems, it is difficult to obtain access from outside the network while those located inside the network were trusted. With Zero Trust, these trust assumptions are removed with tools such as multi-factor authentication, giving access for a limited time and to also verify, authorize and to have a continuous check on all the data points that are given access.

In the earnings call, the company’s CEO assured that the company’s proxy infrastructure could be used for both reverse proxy and forward proxy. He stated, “but it turns out that it’s as easy to make the traffic flow one way through the pipe as it is to make it flow the other way through the pipe.” Its proxy has security features built-in and also has the capacity to increase customer’s traffic.

Earlier this year, the I/O Fund covered the launch of Cloudflare One, and the management’s belief in the shift from a traditional hardware-based security approach to a modern zero trust approach, and the company’s confidence to be a leader in making that transition.

Cloudflare One has been getting a good response from customers due to mitigating attacks and improving overall performance. On the earnings call, the company discussed a Fortune 500 pharmaceutical company which was using Cloudflare One that signed a $600,000 expansion deal to increase the total contract value to over $2 million. Another large European software company signed a three-year deal worth $600,000. According to October numbers, Cloudflare signed a social network company which has a contract value of more than $1 million annually. Another video conferencing company also moved to Cloudflare which has a contract value of about $8 million.

Due to the increasing hybrid work conditions, Cloudflare has announced new cloud firewall functionality for distributed environments to overcome the issues with traditional firewalls. The company’s rating on TrustRadius and also on capterra shows that it rates higher than Zscaler, which has also performed well in the market.

Cloudflare R2 storage

Cloudflare began to lead its cloud peers when the company announced its R2 storage product on September 28th, 2021. You can see the dark purple line start a sharp rise upward following the start of October.

R2 storage allows unstructured data to be stored without egress bandwidth fees, which are charged when developers retrieve data from a cloud provider like AWS. The egress fees are essentially a tax without any value. Markups are as high as 7900% in the United States region when calculating what AWS charges. This is an 80X bandwidth markup and was detailed here by Cloudflare’s management.

Eliminating egress fees with R2 Storage places Cloudflare in direct competition with Amazon’s S3. Cloudflare’s motivation is to win over developers and their loyalty.

In the words of Matthew Prince, “We want developers to keep developing, not worrying about their storage bill. Our aim is to make R2 Storage the least expensive, most reliable option for storing data, with no egress charges. I’m constantly amazed by what developers are building on our platform, and look forward to continued innovation as we expand the tools they have access to.”

Primarily, Cloudflare is hoping to attract developers for its Workers product, which is a serverless compute service for developers to build applications and deploy code at the edge. This removes the need for developers to maintain servers or spin-up containers. The cloud service provider (in this case, Cloudflare) provisions, scales and manages the infrastructure required to run the code. Cloudflare wants developers to choose them over the larger cloud providers because of their location at the edge. This is ambitious as most developers are accustomed to AWS, Google Cloud and Microsoft Azure, all three of which also offer serverless at the edge with plans to aggressively expand, such as AWS Lambda and its extension Lambda@Edge.

R2 Storage will help Cloudflare grow its addressable market and will help the company compete as a best-of-breed player in the trends towards multi-cloud. In response, Amazon has lowered prices by up to 31% but this may not be enough if Cloudflare plans to get rid of egress fees entirely. When Cloudflare announced R2 storage, the company’s co-founder and CEO, Matthew Prince, tweeted, “Why R2? Because it’s S3 minus the one most annoying thing: egregious egress.” The product will be launched soon and has a waitlist for customers.

Notably, the outcome from Cloudflare’s R2 Storage, and also the Bandwidth Alliance, which is a consortium of cloud providers who address bandwidth pricing issues, could end up forcing Amazon to drop its egress fees rather than lose customers. Also, as an investor, it’s not clear how much R2 Storage will contribute to Cloudflare’s top line considering the markup will be eliminated. Regardless, the market has rewarded the company for taking on AWS and my hunch is developers will support the cause regardless of AWS’s response.

Cloudflare has done well since its initial focus on the CDN and web security market, increased its TAM with Zero Trust Security, and now adds object storage as a way to attract developers for products like Workers. It is interesting to note that Amazon successfully grew by targeting companies that had good margins with a famous quote from Jeff Bezos, “Your margin is my opportunity.” Now, companies like Cloudflare are doing what Amazon did in its early days by toughening the competition. Amazon’s AWS is a profitable powerhouse, and if Cloudflare can disrupt this, it could be another game-changer for the company.

Financials

The market is excited about how Cloudflare has performed post-Covid as it’s clear the company did not need the one-time bump from 2020 as growth has been stable throughout 2021. Cloudflare decelerated in the most recent quarter — — but not by much; from 54% revenue growth last year to 51% revenue growth in the most recent quarter. The guide for next quarter is also a slight deceleration from 50% revenue growth last year to 47% this year.

The company’s revenue growth was partly helped by growth in large customers with annualized revenue greater than $100,000. We also noticed a similar trend of large customer growth in the last quarter. The company exited the 3Q with 1,260 large customers, a net addition of 172 in the recent quarter for 71% growth. The company had 132,390 paying customers, which represents total customer growth of 31% YoY.

Cloudflare has also demonstrated its ability to be profitable. The company reported break-even adjusted earnings per share, which beat estimates by $0.04. The gross profit margin improved to 78.2% compared to 76.3% in the 3Q 2020. Adjusted gross margin improved to 79.2% compared to 77.3% in the 3Q 2020.

Adjusted net income came at $1.4 million or $0.00 per share compared to an adjusted net loss of $7.3 million or ($0.02) per share in the 2Q 2021 and adjusted net loss of $5.8 million or ($0.02) per share in the same period last year.

Net cash flow from operations was negative $6.9 million compared to a positive $2.0 million for the 3Q 2020. The company had cash and investments of about $1.8 billion at the end of the quarter, including about $790 million of net proceeds from the convertible note issuance in August.

The dollar-based net retention was 124%, the same as the 2Q 2021 and higher than the 3Q 2020 that was 116%.

The company’s revenue guidance for the 4Q is $184 million to $185 million, represents an increase of 46% to 47%. The adjusted earnings are expected to be between ($0.01) to break even. The full year revenue guidance is $647 million to $648 million, representing an increase of 50% and adjusted earnings per share are expected to be between ($0.06) to ($0.05).

Valuation:

Cloudflare has an eye-watering valuation of 47X EV to 1-year forward revenue. As a tech growth portfolio, the I/O Fund is certainly not the valuation police as we often find our best winners carry high valuations if a company is executing against the competitors.

However, it’s the growth rate of Cloudflare that makes me question if this valuation is appropriate. In regards to Cloudflare’s high-valued peers, we see that Cloudflare has one of the lowest revenue growth rates at 51% in the most recent quarter and free cash flow isn’t a strong factor here either. As mentioned, the only other stock on our list carrying this 1-year forward valuation is Snowflake, which had nearly double the growth.

Cloudflare’s analyst consensus for next year is revenue of $886 million with 20 analysts providing estimates. This represents growth of 37.2%. The analysts covering the stock are modeling Cloudflare to be profitable next year with $0.02 EPS. At this valuation, investors should feel confident there will be a beat and raise to at minimum 50% growth although the data above suggests revenue growth must be in the 60% range to be in the top 10 for valuation.

Posted in Cloud Platforms, Growth StocksLeave a Comment on Cloudflare – A potential momentum play

Supply Chain Issues Could Recover In Q3 2022

Posted on April 6, 2022June 30, 2026 by io-fund
Supply Chain Issues Could Recover In Q3 2022

This article was originally published on Forbes on Apr 1, 2022,01:24pm EDTForbes on Apr 1, 2022,01:24pm EDT

Aggregate Inventories Have Recovered but Auto Inventories Remain Under Pressure:

Supply chain issues have been a well-publicized event that has been hard to predict. While there have been improvements in supply chain management since the harsh production halts enforced during the pandemic, semiconductors continue to be a bottleneck in numerous industries, especially automotive.

Furthermore, the semiconductor bottleneck has had a ripple effect and has impacted industries outside of automotive production, such as ad-tech. In fact, ad-tech has been one of the most beaten-down industries due to the supply chain crisis. This is because automotive is a significant category of ad spend, and without inventory to sell, advertising budgets have been slashed. Nonetheless, we expect that this is only a temporary concern and that ad-tech will rebound in 2022 as supply chain issues begin to normalize. We especially look for discounts in tech that stem from a transient yet external issue outside of any individual company’s control.

The I/O Fund team went beyond relying on management commentary and studied the data to better understand the supply chain bottleneck. We found that aggregate inventory levels have generally recovered, but automotive inventories remain under pressure. I/O Fund Financial Analyst Bradley Cipriano notes that an analysis of automotive inventory composition suggests that the supply-chain issues have likely bottomed and will improve going forward.

The I/O Fund chose to be aggressive during the Q4 earnings season between January and March by building ad-tech positions for this reason. We expect that improving inventory trends will lead to a sharp rebound in automotive advertising in the back half of the year, driving topline growth for the ad-tech sector. We discuss why we believe that the supply chain crisis will ease around H2 2022 below.

Supply Chain Management: Aggregate Inventories Have Recovered but Auto Inventories Remain Under Pressure

The pandemic began in early 2020 and resulted in a whipsaw effect that impacted both supply and demand. With governments enforcing strict shelter in place orders, production of goods declined in 2020 but consumers still demanded goods. Government stimulus further bolstered demand and there was less of a contraction in total demand than there otherwise would have been. This dynamic led to the supply shortage that many sectors have been working through.

Since inventories are essentially the difference between production and sales over a period of time, the dynamic of reduced production but increased demand led to a sharp reduction in inventories in 2020 and 2021. As shown below in Chart 1, changes in private inventories, which is a measure of the value of the physical volume of inventories that businesses maintain to support their production, materially declined in Q2 2020. In fact, the $300 billion drawdown in inventories in Q2 2020 was the steepest drawdown in history.

However, while Q2 2020 represented the steepest decline on record, Q4 2021 represented the largest increase on record, as inventory levels bounced back by over $200 billion. This sharp rebound helps highlight that production is catching back up with demand

Chart 1. 50-year Trend of Changes in Private Inventories

Chart shows 50-year Trend of Changes in Private Inventories

Source: U.S. Bureau of Economic Analysis – I/O FUND

Chart shows Three-Year Trend of Changes in Private Inventories

Source: U.S. Bureau of Economic Analysis – I/O FUND

In Chart 3 (below), inventories are also rising relative to sales, suggesting that there has been a build in inventory levels. Furthermore, the metric is above the five-year average, implying that inventories are not tight on a systemic scale.

Chart 3. Five-Year Trend of Private inventories to Final Sales

Chart: Ratio of Private Inventories to Final Sale of Domestic Business

Source: U.S. Bureau of Economic Analysis – I/O FUND

While the above charts highlight that there has been a strong recovery in inventory levels in the economy, it fails to take into account the types of inventories. Specifically, despite the recovery in aggregate inventories, automotive inventories have fallen to all-time lows.

Sign up for I/O Fund's free newsletter with gains of up to 403% – Click hereSign up for I/O Fund's free newsletter with gains of up to 403% – Click hereClick here

The below chart from the U.S. Bureau of Economic Analysis shows that auto inventories have declined to a record low and are hovering just above 0. Without much inventory to sell, there is little incentive to spend on advertising, which has negatively impacted ad-tech.

Chart 4. Domestic Auto Inventories

Chart: Domestic Auto Inventories

U.S. Bureau of Economic Analysis – I/O FUND

Chart 5. Domestic Auto Inventories to Sales Ratio

Chart: Domestic Auto Inventories to Sales Ratio

Source: U.S. Bureau of Economic Analysis – I/O FUND

Data from Dentsu’s Global Ad Spend Report highlights how automotive spending is still below 2019 levels. As shown below in Chart 6, global automotive ad spend declined 16% YoY in 2020, and rebounded just 12% in 2021, meaning that global automotive ad spending was still ~6% below its pre-pandemic levels. Since automotive advertisers spend an outsized amount of their budgets on TV ads, ad-tech companies exposed to connected TVs have been especially impacted by the soft recovery in auto ad budgets shown below. As I’ll discuss in more detail below, we believe that automotive ad spending has bottomed and will be a tailwind for ad-tech going forward.

Chart 6. Automotive Global Paid Search Ad Spend

Chart shows the annual change in Global Automotive Ad Spend

Source: Dentsu Global Ad Spend Report – I/O FUND

Curiously, despite the fact that auto inventories are at record lows, automobile manufacturers’ inventories are also at an all-time high. As shown below in Chart 7, total inventory levels in the automotive manufacturing industry have surged throughout 2021 and into 2022.

Chart 7. Automotive Total Inventories

Chart: Automotive Manufacturing Total Inventories

Source: U.S. Census Bureau – I/O FUND

These disparate trends are driven by the well-publicized semiconductor bottleneck. As Chart 7 highlights above, automotive manufacturers have large amounts of nearly completed inventory that is sitting idle until semiconductor supply arrives.

Once the supply of semiconductors arrive, automotive manufacturers should be able to quickly ramp and turn work-in-process inventory into finished goods that can be sold. Moreover, this should also drive demand for advertising as auto manufacturers look to quickly convert their inventory into cash.

Fortunately, there are signs of improvement for supply chain issues, specifically from the automotive industry. For instance, Volkswagen Group’s management team explained on their Q4 call that they “expect semiconductor supply bottlenecks to continue in 2022, but gradually improve in the second half of the year” (03/15/22).

General Motors echoed similar sentiment during its Q4 earnings call. GM CEO Mary Barra stated that “by the time we get to third and fourth quarter [of 2022], we're going to be really starting to see the semiconductor constraints diminish” (02/01/22).

However, this sentiment was not shared by all automotive executives. CEO of Stellantis, maker of Dodge RAM, Fiat and other brands, stated on the company’s Q4 call (2/23/22) that the size of the automotive market will be driven by the supply of semiconductors, adding that “hopefully, things will get a little bit better. But we believe it's going to be very slow. It will take time. And 2022 is not going to be from that perspective, the year where we can say we are back to normal. We don't think that will happen”

Looking forward, automotive manufacturers have outsized raw material and work-in-process inventory that will help them quickly ramp production once semiconductor supply improves. The timing of this ramp remains unknown, with some auto executives expecting H2 2022 to be a return to normal, and others forecasting a longer horizon.

Next Tuesday, we will discuss the signs of improvement at key automotive semiconductor suppliers and what this means for ad-tech including one strategic bet the I/O Fund made in ad-tech during the January-March selloff.

Bradley Cipriano, Financial Analyst, CFA, CPA at I/O Fund, contributed to this analysis.

Posted in Semiconductors, Tech Stock News, Tech StocksLeave a Comment on Supply Chain Issues Could Recover In Q3 2022

Micron Q2 FY2022 Update

Posted on April 5, 2022June 30, 2026 by io-fund

Micron reported Q2 results that beat estimates and guided for Q3 sales and earnings growth above expectations. However, Micron’s share are off 9% post-earnings, which may be due to commentary around soft demand in China, slowing PC sales and concerns that Micron may be nearing the top of the cycle. We believe that these concerns are temporary, and that Micron is structurally becoming a less cyclical company, which deserves a premium multiple. I discuss the company’s latest results and why we believe the recent sell-off is overdone in more detail below.

Micron’s Q2 FY2022 Beat Expectations and Guidance Was Above Consensus 

Micron reported Q2 FY2022 results on March 30th, and sales increased 1% QoQ to $7.8 billion driven by a 4% sequential rise in NAND sales, which accounted for ~25% of total revenues. NAND sales also increased 19% YoY and management expects NAND sales to increase by ~30% YoY for the year. Demand for NAND is being driven by Micron’s new 176-layer NAND technology, which represented the majority of Micron’s NAND shipments. We explained the importance of 176-layer NAND here, stating that Micron has significantly increased memory capacity and is a leader in this technology, allowing the company to capture more market share.

Importantly, the strength in NAND should also be a tailwind for Lam Research, which sells the etching equipment necessary to build the layers for 176-layer NAND. In our latest update on Lam Research, we explained that “the key reason we think Lam could fare better than its peers is because as 3D layers increase, capital intensity also increases. The process does not scale linearly, instead it’s non-linear because it takes longer than 2X to etch a stack that is 2X high and requires more complex etch and deposition equipment”. With Micron guiding for $12 billion in Capex this year and plans for $150 billion in capacity expansions over time, we should expect Lam Research to see strong demand for etching equipment going forward.

Micron’s NAND prices also benefitted from the contamination of ~8% of the global supply of NAND. In February, memory peer Western Digital disclosed that there was a contamination event at two of its Japanese JV facilities, which resulted in 6.5 exabytes of NAND memory being contaminated. Likely benefitting from this event, Micron’s Q2 NAND prices rose ~4% QoQ, driving much of the topline growth as volumes were flat. As shown below, Micron has outperformed relative to Western Digital YTD, however, both companies have underperformed the broader market in 2022. I outline a few reasons for this in more detail below, which we believe are only temporary.

Similar to NAND, DRAM sales increased 2% QoQ and were up 29% YoY to $6 billion, or 73% of total sales. DRAM volumes increased but were offset with a decline in ASPs. Strong demand in datacenter drove the increase in DRAM sales. For example, Micron’s largest segment, Compute and Networking, grew sales 31% YoY to $4 billion, driven by a 60% YoY rise in data center sales which were “supported by robust demand across our DRAM and SSD portfolio” (Q2 call, 03/30/22). DRAM sales benefitted from Micron’s leading 1-alpha technology which is increasingly being adopted in the memory-intensive cloud environment. During the Q2 call, CEO Sanjay Mehrotra stated that DRAM sales will continue to ramp into 2023 when he said that “We have broadened the qualifications for our 1-alpha DRAM products and are well positioned to support the data center DDR5 transition driven by new CPU platforms, which are targeted to begin ramping later this calendar year and gain momentum in 2023”.

Following the strength in cloud sales, Storage sales increased 38% YoY to $1 billion as SSDs continue to replace HDDs, while Embedded sales increased 37% YoY driven by strength in automotive. A blemish was weakness in Mobile sales, which increased just 4% YoY to $1.9 billion. While the rollout of 5G phones will lead to a ramp in memory content per phone, there may be demand headwinds on the horizon. For instance, Apple cut its forecast of 5G iPhone shipments by ~20%. I discuss this in more detail below.

Continuing down the income statement, gross margin increased by 2,100 bps YoY and 100 bps QoQ to 47%, benefitting from higher NAND margins and the ramp in 1-alpha DRAM and 176-layer NAND technologies, which reduces costs as it scales. Management noted on the Q2 call that most of the efficiency benefits have been realized, and that margin expansion from the ramp is largely behind the firm. Furthermore, YoY gross margin comps were impacted by a one-time $300 million charge taken last year when Micron switched to FIFO accounting.

The strength in gross margin flowed down to operating profit, which increased 118% YoY to $2.7 billion. The dramatic rise in profitability was driven by higher selling prices and cost reductions from the ramp in new technologies outlined above. However, Micron has historically been a cyclical industry, and there may be concerns that Micron is nearing the top of the cycle. This may explain the recent sell-off in Micron’s sales, yet we believe that Micron is becoming structurally less cyclical and that its multiple will rebound once this is clearly evident in future results (discussed in more detail below).

Finally, GAAP earnings per share were $2.00 while non-GAAP EPS was $2.14, which beat estimates by $0.16. Non-GAAP EPS increased 118% YoY and the strength in EPS growth should continue going forward. For instance, Micron will benefit from a lower tax as Idaho’s governor signed a new tax law on March 16th, 2022 that will reduce Micron’s taxable income (Micron is HQ in Idaho). The CHIPS act may also be a tailwind to earnings as the US government looks to incentivize reshoring of manufacturing capacity.

As of the end of the quarter, Micron had $12 billion in cash and equivalents and free cash flow was over $1 billion during the quarter. Management stated that they expect free cash flow generation will be “substantially higher” over the next two quarters relative to H1 2022. Micron intends to use ~50% of its free cash flow to buy back its stock and pay dividends to shareholders. Since 2019, Micron has reduced its share count by an aggregate 113 million, or by 9%. With Micron guiding for record sales and profits in FY2022, cashflow generation should be significant, which will support more buybacks in the future.

Looking forward, management expects Q3 sales to grow 18% YoY to $8.7 billion, which beat initial topline estimates by 6%.  Management stated that they are “tracking ahead” of their initial guide set in Q1 for FY2022 and that demand remains strong, but noted during the Q2 call that “there are some pockets where semiconductor shortages have not improved as fast as we had expected, and these shortages are likely to continue into calendar year 2023”. Nonetheless, Q3 adjusted EPS is expected to grow 14% QoQ to $2.46, which beat initial estimates by 9%.

Potential Risks are only temporary

As discussed above, Micron reported strong top and bottom-line results, guided above consensus and expects to be report record sales and earnings in FY2022. However, despite this, Micron has underperformed in 2022 and is off ~9% since announcing FQ2 results. This may be due to a couple developments: 1) softness in mobile and PC sales and in China, 2) and concerns that Micron may be nearing the top of the cycle.

In regards to the first point, during the Q2 call management stated that “We see some weakness in the China market as the local economy slows, smartphone market share shifts and some customers take a more prudent approach to inventory management.” CEO Mehrotra added that he expects PC unit growth will be “flattish”. These comments may have contributed to a post-ER sell-off, and it is notable that AMD is also off following the Micron Q2 print, likely due to its exposure to PC sales. However, management added further color that enterprise PC sales are expected to be strong in the near term, which are more content rich in terms of DRAM and NAND content, which should offset this pressure.

Moreover, 5G phone sales are just now starting to ramp, but the timing of this ramp remains unknown. As mentioned above, Apple has reportedly cut its production forecasts for its first 5G phone by ~20%. While this may be a near-term headwind, it is inconsequential in the long term. This is because 5G phones will inevitably take share from 4G going forward, and 5G phone DRAM content is 50% higher than 4G, while NAND content is >100%. We expect mobile will be a tailwind going forward, despite the near term uncertainty in the pace of the ramp.

Finally, a trend that is typical with highly cyclical companies is that investors tend to reduce exposure when earnings are high due to concerns that the company may be nearing the top of the cycle. Historically, Micron has been a highly cyclical company with periods of oversupply and rapidly declining prices. However, with more demand drivers coming from data centers/cloud and automotive, memory demand is no longer dependent on the short-cycle PC market.

During the Q2 call, CEO Mehrotra explained that over 75% of its quarterly volume are under long-term agreements (LTA) that go out beyond four quarters or more, up from less than 25% in prior years. CEO Mehrotra added that all of the company’s large customers are now under LTAs, which helps improve demand visibility and reduces uncertainty. An increase in LTAs significantly reduces the cyclicality of Micron’s business.

Moreover, new trends on the horizon further smooth demand for memory, reducing Micron’s dependence on the short-cycle PC market. For example, CEO Mehrotra stated that “new EVs are becoming like data center on wheels, and we expect over 100 new EV models to launch worldwide in this calendar year alone”. The memory content in higher end EVs is 15x higher than the average car, which further reduces the cyclical nature of Micron’s business.

As shown below, Micron trades at a 9x PE multiple, which is below where it was trading in 2017 and well below its multiple in 2020 and 2021. We believe that the market remains in a “wait and see” mode until Micron can prove that it is less cyclical. If Micron can prove that it is less cyclical going forward, we should expect a re-rating of its multiple going forward.  A trend that supports this is the reduction in finished goods, which declined QoQ despite the softness in China, PC and mobile. A build in finished goods inventory would signal that demand may be weakening, a trend we have yet to observe in the memory market.

Posted in 5G, AI Stocks, Autonomous Vehicles, Consumer Tech, Data Center, Internet of Things, Mobile, Portfolio, SemiconductorsLeave a Comment on Micron Q2 FY2022 Update

Recent Posts

  • The IPO Glut of 2020: Why Valuations Have Gone Too Far
  • Zoom Discusses Two Important Catalysts In Q1 Earnings
  • Three Risk Management Tools the I/O Fund Offers
  • Micron Is Up 900%. Here’s Why the AI Memory Trade May Still Have Room to Run
  • Credo: Reliability Leader Aggressively Moves into Optics

Recent Comments

No comments to show.

Archives

  • June 2026
  • May 2026
  • April 2026
  • March 2026
  • February 2026
  • January 2026
  • December 2025
  • November 2025
  • October 2025
  • September 2025
  • August 2025
  • July 2025
  • June 2025
  • May 2025
  • April 2025
  • March 2025
  • February 2025
  • January 2025
  • December 2024
  • November 2024
  • October 2024
  • September 2024
  • August 2024
  • July 2024
  • June 2024
  • May 2024
  • April 2024
  • March 2024
  • February 2024
  • January 2024
  • December 2023
  • November 2023
  • October 2023
  • September 2023
  • August 2023
  • July 2023
  • June 2023
  • May 2023
  • April 2023
  • March 2023
  • February 2023
  • January 2023
  • December 2022
  • November 2022
  • October 2022
  • September 2022
  • August 2022
  • July 2022
  • June 2022
  • May 2022
  • April 2022
  • March 2022
  • February 2022
  • January 2022
  • December 2021
  • November 2021
  • October 2021
  • September 2021
  • August 2021
  • July 2021
  • June 2021
  • May 2021
  • April 2021
  • March 2021
  • February 2021
  • January 2021
  • December 2020
  • November 2020
  • October 2020
  • September 2020
  • August 2020
  • July 2020
  • June 2020
  • May 2020
  • April 2020
  • March 2020
  • February 2020
  • January 2020
  • December 2019
  • November 2019
  • October 2019
  • September 2019
  • August 2019
  • July 2019
  • June 2019
  • May 2019
  • April 2019
  • March 2019
  • February 2019
  • January 2019
  • December 2018
  • November 2018
  • October 2018
  • September 2018
  • August 2018
  • July 2018
  • June 2018
  • May 2018
  • April 2018
  • February 2018
  • January 2018

Categories

  • 5G
  • About
  • Accounting Tips
  • AdTech
  • Ai Platforms
  • Ai Platforms
  • Ai Platforms
  • Ai Platforms
  • Ai Platforms
  • Ai Platforms
  • Ai Platforms
  • Ai Platforms
  • Ai Platforms
  • Ai Platforms
  • Ai Platforms
  • Ai Platforms
  • Ai Platforms
  • Ai Platforms
  • Ai Platforms
  • Ai Platforms
  • AI Stocks
  • AI Stocks
  • Analysts
  • Application Monitoring
  • Application Monitoring
  • Applications
  • Applications
  • Applications
  • Applications
  • Applications
  • Applications
  • Applications
  • AR
  • Audit Reports
  • Autonomous Vehicles
  • Autonomous Vehicles
  • Autonomous Vehicles
  • Autonomous Vehicles
  • Autonomous Vehicles
  • Autonomous Vehicles
  • Autonomous Vehicles
  • Avod
  • Avod
  • Battery Charging
  • Bear Market
  • Bitcoin
  • Bitcoin
  • Bitcoin
  • Bitcoin
  • Bitcoin
  • Bitcoin
  • Bitcoin
  • Blockchain
  • Blockchain
  • Blockchain
  • Blockchain
  • Blockchain
  • Blockchain
  • Blockchain
  • Broad Market Today
  • Bull Market
  • Bull Market
  • Chainlink
  • Chainlink
  • Chainlink
  • Chainlink
  • China Stocks
  • Cloud
  • Cloud Infrastructure
  • Cloud Infrastructure
  • Cloud Infrastructure
  • Cloud Infrastructure
  • Cloud Infrastructure
  • Cloud Infrastructure
  • Cloud Infrastructure
  • Cloud Platforms
  • Cloud Platforms
  • Cloud Software
  • Cloud Software
  • Cloud Software
  • Cloud Software
  • Cloud Software
  • Cloud Software
  • Cloud Technology
  • Company
  • Company
  • Console Gaming
  • Console Gaming
  • Console Gaming
  • Consumer
  • Consumer
  • Consumer
  • Consumer
  • Consumer
  • Consumer
  • Consumer
  • Consumer
  • Consumer
  • Consumer
  • Consumer
  • Consumer
  • Consumer
  • Consumer
  • Consumer Tech
  • Corrections
  • Crypto Investment
  • Ctv
  • Ctv
  • Ctv
  • Ctv
  • Ctv
  • Ctv
  • Ctv
  • Ctv
  • Ctv
  • Ctv
  • Cybersecurity
  • Cybersecurity
  • Cybersecurity
  • Cybersecurity
  • Cybersecurity
  • Cybersecurity
  • Cybersecurity
  • Cybersecurity
  • Cybersecurity
  • Cybersecurity
  • Cybersecurity
  • Cybersecurity
  • Data
  • Data Analytics
  • Data Analytics
  • Data Analytics
  • Data Center
  • Data Center
  • Data Center
  • Data Center
  • Data Center
  • Data Center
  • Data Center
  • Data Center
  • Data Center
  • Data Center
  • Data Center
  • Data Center
  • Data Center
  • Data Center
  • Data Center
  • Data Center and Processing
  • Data Warehousing
  • Data Warehousing
  • Data Warehousing
  • Data Warehousing
  • Databases
  • Databases
  • Databases
  • Databases
  • Dating
  • Defi
  • Digital Ads
  • Digital Ads
  • Digital Ads
  • Digital Ads
  • Digital Ads
  • Digital Ads
  • Digital Ads
  • Digital Ads
  • Digital Ads
  • Digital Ads
  • Digital Ads
  • Digital Ads
  • Digital Ads
  • Digital Ads
  • E-Commerce
  • Earning Updates
  • Earning Updates
  • Earning Updates
  • Earning Updates
  • Earning Updates
  • Earnings Report
  • Earnings Report
  • Earnings Report
  • Earnings Report
  • Earnings Report
  • Earnings Report
  • Earnings Report
  • Earnings Report
  • ECommerce
  • Electric Vehicles
  • Electric Vehicles
  • Electric Vehicles
  • Electric Vehicles
  • Electric Vehicles
  • Electric Vehicles
  • Electric Vehicles
  • Energy Stocks
  • Enterprise
  • Enterprise
  • Enterprise
  • Enterprise
  • Enterprise
  • Enterprise
  • Enterprise
  • Enterprise
  • Enterprise
  • Ethereum
  • Events1
  • Events1
  • Exchange
  • Faq
  • Finance
  • Financial Analysis
  • Financial Analysis
  • Financial Analysis
  • Financial Analysis
  • Financial Analysis
  • Financial Analysis
  • Financial Analysis
  • Financial Analysis
  • Financial Analysis
  • Financial Analysis
  • Financial Analysis
  • Financial Analysis
  • Financial Markets
  • FinTech
  • Fundamental Analysis
  • Gambling
  • Gaming
  • Genomics
  • Glossary
  • Green Energy
  • Growth Stocks
  • Growth Stocks
  • Growth Stocks
  • Headsets
  • Headsets
  • Health Tech
  • Hydrogen
  • Identity
  • Identity
  • Identity
  • Inflation
  • Inflation
  • Inflation
  • Internet of Things
  • Interviews
  • Interviews
  • Interviews
  • Interviews
  • Investing
  • Investing
  • Ltbh
  • Ltbh
  • Ltbh
  • Ltbh
  • Ltbh
  • Macro Trends
  • Macro Trends
  • Market Trends
  • Market Trends
  • Market Trends
  • Market Trends
  • Market Trends
  • Market Trends
  • Market Trends
  • Market Updates
  • Market Updates
  • Market Updates
  • Market Updates
  • Market Updates
  • Market Updates
  • Market Updates
  • Market Updates
  • Market Updates
  • Market Updates
  • Media
  • Membership
  • Mining
  • Mobile
  • Mobile
  • Mobile
  • Mobile
  • Mobile Gaming
  • Mobile Gaming
  • Mobile Gaming
  • Multimedia
  • Music Streaming
  • NVDA | NVIDIA Corporation
  • Performance Updates
  • Pin Content
  • Podcasts
  • Podcasts
  • Podcasts
  • Portfolio
  • Premium Research
  • Press Releases
  • Press Releases
  • Productivity
  • Productivity
  • Productivity
  • Productivity
  • Productivity
  • Productivity
  • Productivity
  • Reports and Whitepapers
  • Research Services Preview
  • Resources
  • Resources
  • Semiconductor Stocks
  • Semiconductors
  • Semiconductors
  • Semiconductors
  • Semiconductors
  • Semiconductors
  • Semiconductors
  • Semiconductors
  • Semiconductors
  • Semiconductors
  • Semiconductors
  • Semiconductors
  • Semiconductors
  • Semiconductors
  • Social Media
  • Social Media
  • Social Media
  • Social Media
  • Social Media
  • Social Media
  • Social Media
  • Software
  • Software
  • Software
  • Software
  • Software
  • Software
  • Software
  • Software
  • Software
  • Software
  • Software
  • Software
  • Software
  • Software
  • Software
  • Solar
  • Solar
  • Stock Analysis PDFs
  • Stock Updates
  • Stock Updates (Blogs)
  • Supplychain
  • Supplychain
  • Supplychain
  • Supplychain
  • Supplychain
  • Supplychain
  • Svod
  • Svod
  • Svod
  • Svod
  • Svod
  • Svod
  • Tech Podcast
  • Tech Stock News
  • Tech Stock News
  • Tech Stock News
  • Tech Stock News
  • Tech Stock News
  • Tech Stocks
  • Tech Stocks
  • Tech Stocks
  • Tech Stocks
  • Tech Stocks
  • Tech Stocks
  • Tech Stocks
  • Tech Stocks
  • Tech Stocks
  • Tech Stocks
  • Tech Stocks
  • Tech Stocks
  • Tech Stocks
  • Tech Stocks
  • Technical Analysis
  • Telehealth
  • Telehealth
  • Telehealth
  • Telehealth
  • Testing Equipment
  • Testing Equipment
  • Top Tech Stock News
  • Travel
  • Trends Report
  • Tutorials
  • Uncategorized
  • Updates
  • Updates
  • Updates
  • Video
  • Video
  • Video
  • Video
  • Video Footage
  • VR
  • Webinar Alerts
  • Webinar Alerts
  • Webinars
Proudly powered by WordPress | Theme: iofund by iofund.co.uk.