Skip to content
Logo-main-white.860316a8

I/O Fund

  • Home
  • Free Stock Analysis
  • AI Stocks
  • BEST OF 2025
  • Analysts
  • Nvidia Hub
  • About
    • Case Studies
    • About Us
    • Premium Services
    • Pricing
    • Notable Wins
    • I/O Fund Reviews
    • Media
  • Contact Us

Month: June 2025

Palantir Stock: Strong Sequential Growth and Strong Underlying Key Metrics 

Posted on June 12, 2025June 30, 2026 by io-fund

When thinking of strong earnings reports this past quarter, Astera Labs and AppLovin come to mind in terms of ticking critical boxes on fundamentals. However, one could argue that Palantir is tied for the top position on this list, although with Palantir, you pay for what you get with a valuation that is as outrageous as its CEO. 

The company continues to report accelerating growth on a QoQ and YoY basis. The cherry on top is that fiscal year guidance was raised, and key metrics support continued growth down the line.  

In Q1, the company reported $884 million in revenue for growth of 39%, up from growth of 36% last quarter and 21% last year. This represents QoQ growth of 7%. Perhaps most importantly, US commercial revenue drove the results, with 71% YoY growth and QoQ growth of 19% for the segment’s first-ever $1 billion annual run rate.  

Key metrics such as commercial total contract value (TCV), US commercial customer count, US commercial remaining deal value (RDV) and RPO are supportive of continued growth in future quarters.  

There are also robust cash flows and expanding margins to strengthen the story. What is this Perfect 10 worth? The market clearly loves this stock despite its 83 forward PS valuation; therefore, given Palantir’s ongoing invincibility, it’s truly anyone’s guess if the stock can sustain the valuation or not.  

Background on Palantir’s Platforms 

Palantir’s first platform was Gotham for government purposes before many of the integrated features were expanding to Foundry, which launched around 2021 for Commerical purposes (exact date is not available but generally understood to be around this time).  

Gotham and Foundry create a unified data set for actionable insights across industries such as manufacturing, product development, and customer experience. The data that Palantir gets is from the customer database although the company may use other data sets for government customers, such as scraping social media or other publicly available information on the web. The traditional deployment includes hosting Palantir’s servers in a customer’s data center. 

The difference between Palantir and other AI-enabled database competitors is that Palantir is able to answer questions a model cannot answer. Traditional business intelligence companies require a complete data set whereas Palantir is able to tackle situations where there is not a complete data set. You can think of the competitive advantage as being actionable depth, which Palantir has described as “the reasoning that goes into decision-making, not just data.”  

The core platforms were built for the “ability to construct a model of the real world from countless data points.” Unlike a SQL database, natural language is used to query data and return results in real-time rather than through strings.  

Gotham:  

Palantir Gotham was the company’s first platform, built for government operatives in defense and intelligence sectors. The platform enables users to identify patterns hidden deep within datasets using semantic, temporal, geospatial and full-text analysis.  

Here are some ways the platform is used: 

  • Graph application allows data objects to be seen as nodes and edges for the ability to visualize events, filter objects and plot characteristics 
  • Object explorer allows users to query billions of objects, somewhat similar to Apache Spark 
  • Browser allows perform search queries and surface information  

Pictured Above: Gotham uses AI detection models 

Pictured Above: Gotham uses ML models to detect objects and event matches acrsos varying sensor data types, satellite images, audio, text and video.  

Foundry: 

Palantir Foundry is the commercial offering and has four layers of tooling: Foundry Core, Data Foundation, Ontology and Workflows. This four-step process does the following, with the Ontology layer offering a distinct, competitive advantage: 

  • brings volumes of data into one place 
  • transforms the data into a format that analysts can work with and enables validation in any number of programming languages 
  • the “ontology layer” allows datasets to be turned into real-world concepts with the ability to accelerate on the company’s core ontology to reduce redundancy 
  • workflows is where it all comes together in an integrated environment for object exploration, point-and-click top-down analysis, code authoring, time series analysis, data science and application development. When a user has a question, it answers it using all layers and tools available

Pictured: Workflow builder on AIP platform 

Pictured Above: AI-powered Shipments and Supply Chains using AIP platform 

Apollo: 

The Apollo layer provides continuous delivery and an automated configuration layer that allows Foundry and Gotham to work across all cloud environments and also in places where there is little to no connectivity. On top of Palantir being able to form conclusions from incomplete data sets, the company can also deploy its platform and applications anywhere. 

Palantir’s marketing team says Apollo “goes where no SaaS has gone before” because it allows what is done on-premise to also run on multi-cloud SaaS with code that is deployed across all environments rather than written for a specific environment. The orchestration allows for on-hardware AI models to consume real-time data from sensors, radio, geo-data and time series data.  

Where bandwidth is not an issue, the company transmits all raw inputs and enriched metadata from models. Where there are constraints, the platform transmits meta-data only which can reduce bitrate by 20X. At times, a simulated environment can be created with Palantir’s Edge AI from historical data to help train AI models. The simulated environment is then deployed at the edge. With Apollo, Palantir’s centralized operations team is capable of 41,000 updates per week at no additional cost. 

Apollo Edge AI links together satellites to lower latency for the AI-enabled decision chain by orchestrating up to 237 satellites in what the company is calling a “meta-constellation.” This meta-constellation optimizes hundreds of orbital sensors and AI models to power Palantir’s models. One example is tracking submarines that pose a threat to the U.S. and its allies. In this case, submarines are being tracked on a granular level in areas where there is no bandwidth available. These are the kinds of obstacles that Palantir overcomes while being independent of one cloud environment, such as AWS or Azure. 

AIP: 

The Artificial Intelligence Platform has helped the stock surge in recent years as it integrates generative AI with operational data and workflows. When AIP is combined with Foundry and Apollo, it provides an AI service mesh that can run hundreds of microservices, scale compute through its Rubix engine and orchestrate updates through Apollo. Similar to Apollo, AIP Is independent from any one cloud environment.  

AIP Ontology is what Separates Palantir: 

The knowledge graph referred to as Ontology is a distinct advantage. The graph offers better context than a large language model would on its own – or as Palantir states, it’s “the reasoning that goes into decision-making.” 

You will often hear the management team state large language models will become commoditized, which is a way of saying the software that is on top of the LLM is where value creation comes from rather than the LLM alone. For this reason, AIP is designed to not only be cloud agnostic but to also be LLM-agnostic as it works with any large language model – for example, OpenAI, Anthropic, Meta’s Llama, etc. 

The platform also offers an AI agent workflows for building AI agents that are further optimized for specific use cases and customized through additional tools. Autonomous agents can be built and tested on the platform.  

When it comes to security and governance, Palantir’s roots in government contracts means the software company is exceptional compared to peers in this area.

Palantir Reports Accelerating Growth YoY and QoQ, Raises FY Guidance 

Palantir reported $883.9 million in revenue in Q1, beating estimates by more than $21 million. As stated above, this represents growth of 39%, up from growth of 36% last quarter and up from 21% last year. On a QoQ basis, Q1 accelerated 7% from Q4. This is an impressive performance given Q1 is typically one of the slowest quarters seasonally. For Q2, Palantir guided for $934 to $938 million in revenue, or 38% YoY growth. 

Over the past seven quarters, revenue growth has accelerated nearly 27 points, an exceptional feat driven by reaccelerating government growth, persisting AI momentum in US commercial, and strong execution.  

Driven by the strong Q1 report and upbeat Q2 guide, Palantir hiked its full-year revenue growth forecast by 5 points, a rather high-conviction move after just one quarter. Palantir now sees FY25 revenue of $3.89 to $3.902 billion for 35.9% YoY growth, a significant ~$150 million raise from its prior view for $3.741 to $3.757 billion for 30.9% YoY growth.  

With that said, the updated FY25 guidance also suggests that revenue growth may begin to moderate in the back half of the year, given 1H growth is in the mid-38% range. There was a hint in the call that government could be lumpy, thus it’s likely to be the cause for H2 being slightly lower than H1. The other possibility for H2 being forecast to report slower growth would be Europe or other global weakness, which was present in this report. 

Key Segments: US Commercial Revenue Growth Drives Results 

US Commercial drove the results this quarter although Global Commercial was still at a lower growth rate than Government due to weakness in Europe. It’s clear to see in the numbers below that Government contracts remain crucial for Palantir’s success. 

Government: 

  • Government revenue growth accelerated 5 points sequentially to 45% YoY to $487 million, accounting for 55% of revenue.  
  • US government revenue grew 45% YoY to $373 million, and international government revenue also rose 45% YoY to $114 million.  

Palantir said US growth was driven by new awards reflecting growing AI software demand, while international growth was driven by UK healthcare and defense sector work and the new NATO contract.  

In the call, the CEO used the word lumpiness when asked about government contracts, and notably, did not answer the question directly rather used it as an opportunity to talk about the overall business in both the quoted portion below and the lengthier response found here. 

“Dan Ives: 

Thanks. And, another amazing quarter. I mean, it's just — so my question is, given that what we're seeing in the government, isn't that another opportunity where you could actually gain more share of budgets as you go to more meritocracy? Like, Palantir should actually gain more dollars within the budgets of DoD and a lot of other agencies. 

Alex Karp: 

We're very optimistic about what we're going to do in the US, but the devil's in the details. And we're running this business for you with you as owners, which means it's like there's going to be maybe lumpiness, but we predict we're going to do very, very well […] “ 

There was mention on the call that they are seeing government demand globally minus Europe … although that could go against the trend toward sovereign AI.  

Per management: “I would say as an unknown variable, we're seeing very significant demand for our software, our government software around the world outside of Europe. And those are early days, but the demand — the signal there is very strong.” 

US Commercial Revenue Accelerates to 71%: 

Commercial revenue growth accelerated two points sequentially to 33% YoY to $397 million, as Palantir is growing rapidly in the United States, yet faces persisting headwinds in Europe.  

  • US commercial revenue accelerated from 64% last quarter to 71% YoY this quarter to $255 million, surpassing a $1 billion annualized run rate for the first time on elevated AI demand. However, the guide for next quarter does indicate Q1 could be the peak with fiscal year growth of 68% guided. 
  • International commercial revenue declined (5%) YoY to $141 million, weighed down by soft European demand and a one-time revenue catch-up in Q4. 

Not only did Palantir’s US commercial segment see revenue growth accelerate to the highest growth rate in nearly three years, but it also saw record growth in a handful of key metrics that support strong growth continuing through the year.  

  • US commercial accelerated 31 points YoY and 7 points QoQ to 71% in Q1, surpassing Q4 2023’s 70% level and the highest growth since Q2 2022. This strong growth means that Palantir’s US commercial segment is on track to rise more than 2.5x in two years.  
  • Palantir raised its FY25 US commercial growth guidance from 54% YoY to 68% YoY, projecting revenue of $1.178 billion, compared to $457 million in 2023. The raise represents about $100M more than previously expected. 

US commercial customer count rose 65% YoY and 13% QoQ to 432, with Palantir adding 50 net new customers in the quarter. Palantir has added 111 net new customers in Q4 and Q1 combined, its highest two-quarter total on record.  

The segment’s strong growth outlook is supported by robust key metrics: 

  • 2x YoY growth in US commercial deals closed above >$1M 
  • 127% YoY and 30% QoQ growth in US commercial remaining deal value to $2.32 billion 
  • 183% YoY growth in US commercial total contract value (TCV) booked of $810 million 

Key Metrics Support Continued Growth 

While US Commercial featured many strong key metrics yet NRR, RPO and Billings stood out with strong growth as well in Q1. 

  • Total remaining deal value (RDV) accelerated from 39.2% in Q4 to 45.6% in Q1 as it rose to $5.97 billion. 
  • RPO accelerated from 39.5% YoY in Q4 to 46.1% YoY in Q1 at $1.90 billion. 
  • Total contract value (TCV) booked increased 66% YoY to $1.5 billion. 
  • Billings rose 44.8% YoY to $905 million. 
  • Net retention rate (NRR) rose four points sequentially to 124%, its highest level in three years. Palantir pointed out that NRR should continue to expand in the coming quarters: “As net dollar retention does not include revenue from new customers that were acquired in the past 12 months, it has not yet fully captured the acceleration and velocity in our US business over the past year.” 

Margins 

Palantir’s margin profile is exceptionally strong, as the company continues to drive operating margin expansion while accelerating revenue growth. This helps the company’s Rule of 40 metric, which stands at 83 as it combines EBITDA margin with revenue – or more than double the ideal 40 that many SaaS companies set out to acheive yet cannot due to a lack of GAAP margins.  

  • GAAP gross margin was 80.4% in Q1, down 1.3 points YoY. Adjusted gross margin was 82.1%, down more than 1 point YoY. 
  • GAAP operating margin expanded to 19.9%, up more than 7 points YoY.  
  • Adjusted operating margin was 44.2%, up 8.5 points YoY. For Q2, Palantir guided its adjusted operating margin to 43.1%, which would represent a third consecutive quarter above 40% and up nearly 6 points YoY. 
  • GAAP net margin was 24.2%, up more than 7.5 points YoY.  
  • Adjusted net margin was 37.8%, up nearly 8 points YoY. 

Palantir also boosted its full-year adjusted operating income forecast from its prior view of $1.551-1.567B to $1.711-1.723B. FY25’s adjusted operating margin is now projected to be 44.1%, up from its prior view of 41.6%.  

EPS 

Despite the top-line beat, Palantir met adjusted EPS estimates in the quarter at $0.13, up 68% YoY. GAAP EPS was $0.08, up 100% YoY.  

Looking ahead through the rest of FY25, adjusted EPS growth is expected to decelerate, from Q1’s 68% YoY to 20% YoY by Q4. However, estimates have risen over the past three months – Q2’s growth rate has come up 11 points and Q3’s up by 9 points. 

For FY25, Palantir is expected to see adjusted EPS growth of nearly 43% YoY to $0.58, before decelerating to 25% growth to $0.73 in FY26. 

Cash Flows and Balance Sheet 

Palantir stands out for its ridiculously strong cash flows, though operating and free cash flow margins moderated quite substantially in Q1 relative to 2H 2024.  

  • Operating cash flow was $310.3 million in Q1 for a margin of 35%, down from 56% in Q4.  
  • Adjusted free cash flow was $370.4 million for a 42% margin, down from a 63% margin in Q4. Palantir raised its adjusted FCF guidance for FY25 from $1.5-1.7 billion to $1.6-1.8 billion, implying an FCF margin of 43.7%. 
  • Adjusted EBITDA margin was 45%. 
  • Cash and equivalents totaled $5.43 billion, while debt was zero. 

Conclusion: 

Part of our process is to highlight stellar earnings reports and Palantir certainly qualifies. It’s hard to find a blemish in the company’s current quarter as it’s perhaps the best report the company has reported yet – which is saying a lot. We are certainly seeing companies at the data layer doing well in AI with Oracle also reporting strong results, and this is likely to be a theme in the coming years.  

The valuation with Palantir is a gamble. The bulls believe they’ve speculated correctly, while there’s likely to be short sellers who do well with this stock too. PLTR is attempting to set a new bar for AI software with the 80 forward valuation, yet 39% revenue is a tricky spot to be as it barely qualifies as high-growth (yes, it’s US commercial segment does qualify, but you could say that for a few stocks trading a much lower valuations).  

Congrats to all the Palantir longs, it’s certainly paid off in spades. As for the IOF, this isn’t one I was able bite on at the high valuation and that remains my conclusion at this time. If we can get a more reasonable valuation, however, we’d love to have this one in the portfolio.

Please note: The I/O Fund conducts research and draws conclusions for the Fund’s positions. We then share that information with our readers. This is not a guarantee of a stock’s performance. Please consult your personal financial advisor before buying any stock in the companies mentioned in this analysis.

Recommended Reading:

  • Taiwan Semiconductor: Building a Moat under Geopolitical Tensions
  • Dell Riding Nvidia’s Tailwinds to Record $12.1B in AI Server Orders in Q1
  • Nvidia Q1/Q2 Guide: Blackwell is (Finally) Here
  • Microsoft Stock Surges After Q3 2025 Earnings: What Separates Azure from AWS, Google Cloud
Posted in AI Stocks, CybersecurityLeave a Comment on Palantir Stock: Strong Sequential Growth and Strong Underlying Key Metrics 

Taiwan Semiconductor: Building a Moat under Geopolitical Tensions

Posted on June 6, 2025June 30, 2026 by io-fund

This article is a continuation of our free newsletter from May 23, Nvidia Stock Faces a Choppy Q2, But Tailwinds Build for H2 Acceleration. 

For our Premium Members, we discuss the following:  

  • Our analysis on the stock’s valuation and if the stock is a “buy” or a “hold” given the stock faces immense demand from the AI economy yet must also weather geopolitical tensions. 
  • The I/O Fund’s trading plan for TSMC including never-before published buy targets over a 12 to 18-month time frame.

TSMC’s Valuation: 

Historically, semiconductors do not trade at the valuations we saw in 2024. Therefore, the market is essentially saying (given the risks around China), we are not willing to pay the exuberant premium of 2024. Valuation is the primary reason most semiconductors are flat over a 1-year period.  

This is visible in TSMC’s forward PE ratio to where anything over 20 is quite rare. The 3-year median is 18.5 while the stock is trading at 21. The forward PE ratio peaked at 30. 

When you zoom out 10 years, the TTM PE ratio rarely trades over 25 except for the blowoff top in 2021 and the AI boom of 2024. 

When you look at the top line, something similar is seen to where the stock is trading at the 5-year median of 10 PS on a TTM basis. 

On a forward basis, the stock is trading at 8.3 — which essentially means the stock is fully valued unless a technical setup shows us the broad market, semiconductor baskets (ETFs) and/or other leaders like Nvidia are ready to resume leading the market. Rarely will we buy a stock that is at its 3-year or 5-year median unless there is broader participation. With that said, once there are signals that TSMC and a few other AI stocks are ready to lead again, we will not hesitate to buy as the stock is a safe, long-term winner in our opinion.   

A Few Simple Reasons we like TSMC as a Long-term Winner: 

  • Demand exceeds supply and will into the foreseeable future  
  • It’s one of the only companies that has strong pricing power – in fact, it exceeds Nvidia on this point. Reference my Q2 webinar around minute 13:32 
  • The margins and the cash separate it from other semiconductor choices 
  • The United States government will ensure TSMC is successful as a matter of global dominance 
  • One thing to watch out for: TSMC is exposed to smartphones and even with outsized AI demand, HPC segment can be lumpy and cyclical. The H2 slowdown that management guided for could put pressure on the stock.

Taiwan Semiconductor (TSM) Technicals Overview: 

By Knox Ridley 

Like the entire market, TSM is coming to the end of an impressive recovery off the April 7th lows. Note how price went vertical in early – mid May in the chart below. This happened with the highest amount of volume and momentum that we have seen in the bounce, so far.  What has followed is a continuation higher in price; however, with less volume and less momentum. This is a common occurrence toward the end of a trend. Furthermore, since late May, TSM has been trading within a rising wedge pattern, which is a common pattern seen in the last push higher of a trend.  

As long as TSM holds over $188, we can see a continuation of this drift higher throughout June.  Once we break below $188, we will see a reversal of this bounce. When this happens, what will be important are two factors on determining the next larger move in TSM, as well as the larger market: 

What is the pattern the correction takes? If we see a messy/overlapping drop that takes the shape a of a 3-wave pattern, then we believe TSM is setting up for a bigger push to new highs later into the year. If instead, we see a more aggressive/direct drop lower that takes the shape of a 5-wave pattern, we are setting up for a larger drop below the April 7th lows. 

Any drop, regardless of pattern, must hold over $146. Below this level, and the odds greatly favor that we are heading to new lows.  

Based on how the next correction plays out within the above parameters, there are two general scenarios that the price action best represents: 

Red – This would see the next drop taking the shape of a 5-wave pattern that ultimately breaks through $146. If this happens, we will see final targets for this drop to be, at least, in the $120s.  

Green – If we see the next drop take the form of a 3-wave drop that holds over $146, then we could be setting up for a rally toward the $300s.  

As stated, both fading momentum and volume, coupled with a filled-out pattern is suggesting that we are closer to the end of this bounce. Once it completes, the nature and depth of the correction will determine if we aggressively buy more or hedge our position.

Unlock Full Access to the I/O Fund

Pro Members receive access to the I/O Fund’s portfolio, deep-dive research on all portfolio stocks, and quarterly earnings kickoff webinars.

Advanced Market Signals Members get regular technical and broad market analysis, weekly webinars from Portfolio Manager Knox Ridley, our hedge signal, and real-time trade alerts.

Exclusive Offer for Existing Essentials Members:

Upgrade to the Advanced Annual Plan for just $599 and gain full access to everything above — including real-time trade alerts and our complete portfolio strategy.

To claim this limited-time offer or subscribe to the Advanced Plan, contact us at premium@io-fund.compremium@io-fund.com or email us to upgrade

Please note: The I/O Fund conducts research and draws conclusions for the Fund’s positions. We then share that information with our readers. This is not a guarantee of a stock’s performance. Please consult your personal financial advisor before buying any stock in the companies mentioned in this analysis.

Recommended Reading:

  • Nvidia Q1/Q2 Guide: Blackwell is (Finally) Here
  • Nvidia Stock Faces a Choppy Q2, But Tailwinds Build for H2 Acceleration
  • Microsoft Stock Surges After Q3 2025 Earnings: What Separates Azure from AWS, Google Cloud
  • Q2 2025 Webinar Highlights
Posted in AI Stocks, SemiconductorsLeave a Comment on Taiwan Semiconductor: Building a Moat under Geopolitical Tensions

Taiwan Semiconductor: Building a Moat under Geopolitical Tensions

Posted on June 6, 2025June 30, 2026 by io-fund

This article is a continuation of our free newsletter from May 23, Nvidia Stock Faces a Choppy Q2, But Tailwinds Build for H2 Acceleration. 

For our Premium Members, we discuss the following:  

  • Our analysis on the stock’s valuation and if the stock is a “buy” or a “hold” given the stock faces immense demand from the AI economy yet must also weather geopolitical tensions. 
  • The I/O Fund’s trading plan for TSMC including never-before published buy targets over a 12 to 18-month time frame.

TSMC’s Valuation: 

Historically, semiconductors do not trade at the valuations we saw in 2024. Therefore, the market is essentially saying (given the risks around China), we are not willing to pay the exuberant premium of 2024. Valuation is the primary reason most semiconductors are flat over a 1-year period.  

This is visible in TSMC’s forward PE ratio to where anything over 20 is quite rare. The 3-year median is 18.5 while the stock is trading at 21. The forward PE ratio peaked at 30. 

When you zoom out 10 years, the TTM PE ratio rarely trades over 25 except for the blowoff top in 2021 and the AI boom of 2024. 

When you look at the top line, something similar is seen to where the stock is trading at the 5-year median of 10 PS on a TTM basis. 

On a forward basis, the stock is trading at 8.3 — which essentially means the stock is fully valued unless a technical setup shows us the broad market, semiconductor baskets (ETFs) and/or other leaders like Nvidia are ready to resume leading the market. Rarely will we buy a stock that is at its 3-year or 5-year median unless there is broader participation. With that said, once there are signals that TSMC and a few other AI stocks are ready to lead again, we will not hesitate to buy as the stock is a safe, long-term winner in our opinion.   

A Few Simple Reasons we like TSMC as a Long-term Winner: 

  • Demand exceeds supply and will into the foreseeable future  
  • It’s one of the only companies that has strong pricing power – in fact, it exceeds Nvidia on this point. Reference my Q2 webinar around minute 13:32 
  • The margins and the cash separate it from other semiconductor choices 
  • The United States government will ensure TSMC is successful as a matter of global dominance 
  • One thing to watch out for: TSMC is exposed to smartphones and even with outsized AI demand, HPC segment can be lumpy and cyclical. The H2 slowdown that management guided for could put pressure on the stock.

Taiwan Semiconductor (TSM) Technicals Overview: 

By Knox Ridley 

Like the entire market, TSM is coming to the end of an impressive recovery off the April 7th lows. Note how price went vertical in early – mid May in the chart below. This happened with the highest amount of volume and momentum that we have seen in the bounce, so far.  What has followed is a continuation higher in price; however, with less volume and less momentum. This is a common occurrence toward the end of a trend. Furthermore, since late May, TSM has been trading within a rising wedge pattern, which is a common pattern seen in the last push higher of a trend.  

As long as TSM holds over $188, we can see a continuation of this drift higher throughout June.  Once we break below $188, we will see a reversal of this bounce. When this happens, what will be important are two factors on determining the next larger move in TSM, as well as the larger market: 

What is the pattern the correction takes? If we see a messy/overlapping drop that takes the shape a of a 3-wave pattern, then we believe TSM is setting up for a bigger push to new highs later into the year. If instead, we see a more aggressive/direct drop lower that takes the shape of a 5-wave pattern, we are setting up for a larger drop below the April 7th lows. 

Any drop, regardless of pattern, must hold over $146. Below this level, and the odds greatly favor that we are heading to new lows.  

Based on how the next correction plays out within the above parameters, there are two general scenarios that the price action best represents: 

Red – This would see the next drop taking the shape of a 5-wave pattern that ultimately breaks through $146. If this happens, we will see final targets for this drop to be, at least, in the $120s.  

Green – If we see the next drop take the form of a 3-wave drop that holds over $146, then we could be setting up for a rally toward the $300s.  

As stated, both fading momentum and volume, coupled with a filled-out pattern is suggesting that we are closer to the end of this bounce. Once it completes, the nature and depth of the correction will determine if we aggressively buy more or hedge our position.

Recommended Reading:

  • Dell Riding Nvidia’s Tailwinds to Record $12.1B in AI Server Orders in Q1
  • Nvidia Q1/Q2 Guide: Blackwell is (Finally) Here
  • Nvidia Stock Faces a Choppy Q2, But Tailwinds Build for H2 Acceleration
  • Microsoft Stock Surges After Q3 2025 Earnings: What Separates Azure from AWS, Google Cloud
Posted in AI Stocks, SemiconductorsLeave a Comment on Taiwan Semiconductor: Building a Moat under Geopolitical Tensions

Taiwan Semiconductor Stock: AI Growth Amid Geopolitical Risk 

Posted on June 6, 2025June 30, 2026 by io-fund
Taiwan Semiconductor Stock: AI Growth Amid Geopolitical Risk 

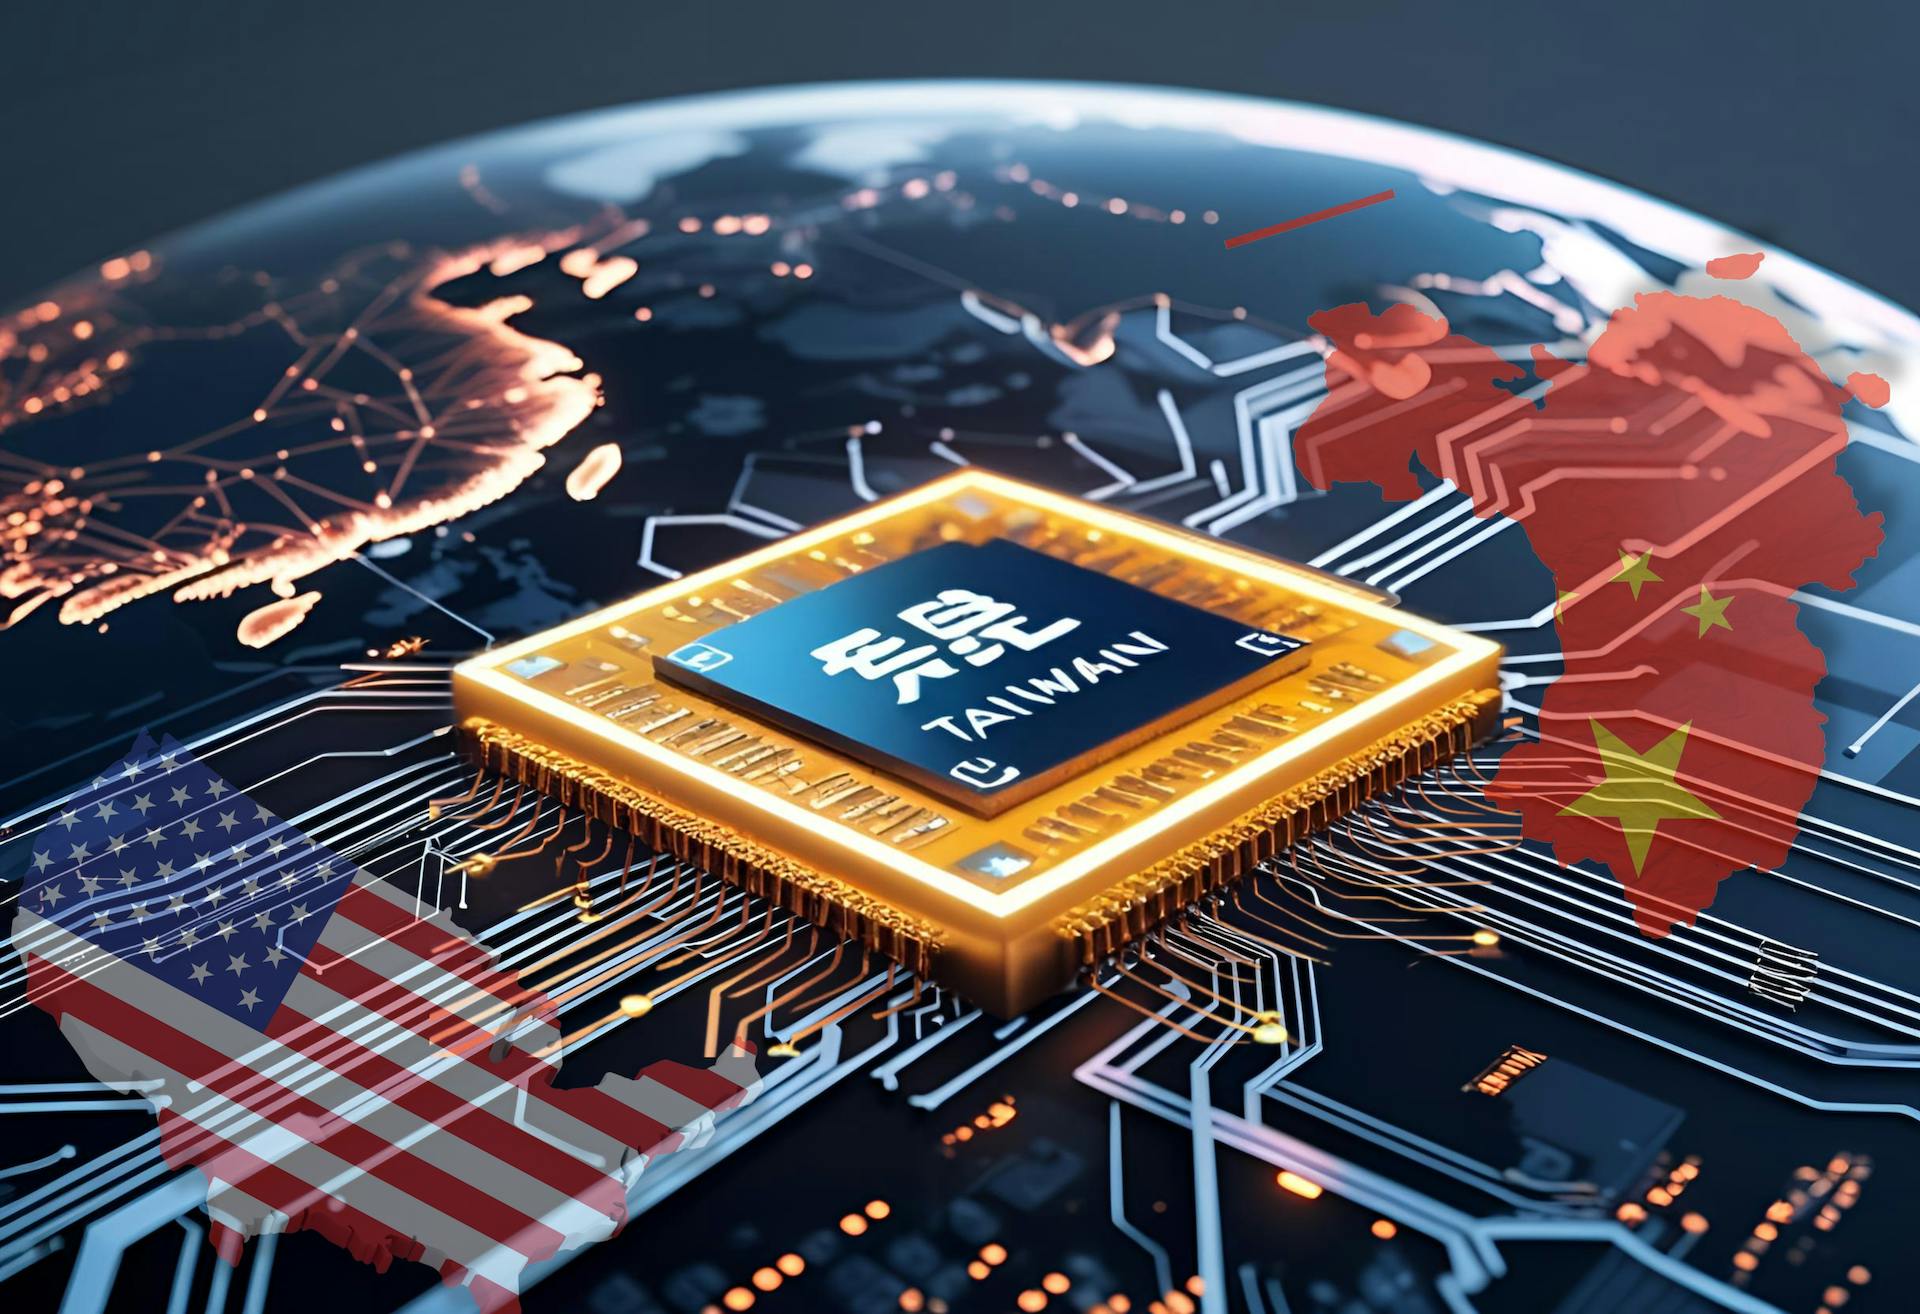
Despite their leadership, AI stocks like Taiwan Semiconductor and Nvidia are flat year-to-date and trading at similar levels as June 2024. Clearly, the AI trade is not as straightforward as it might seem. Taiwan Semiconductor, in particular, sits at the center of geopolitical tensions — yet those tensions tend to surround companies with deep IP in the AI economy. What makes this economy so distinct is not just the extraordinary commercial demand, but also its rare, historical role in shaping global alliances (and adversaries). 

Investors are confronted almost daily with friction between the U.S. and China — and at the center of it all is one stock: Taiwan Semiconductor (TSMC). While enthusiasm around AI demand remains strong, assuming it will simply override geopolitical headwinds is overly optimistic. Onshoring a supply chain like TSMC’s takes years, yet markets can react to a negative headline in seconds. 

Headlines aside, the bigger picture is that TSMC is deepening its moat with advanced nodes, such as N2 and A16. The company already powers tens of trillions in market cap on the stock market when you consider Apple, Nvidia, Broadcom, Amazon, AMD and Google are customers of TSMC. Essentially, all mega cap stocks have an AI strategy spanning merchant GPUs and custom silicon, and of course, software – yet the common denominator to these strategies is they all funnel into TSMC. 

The problem my firm helps with is this — how does an investor ride out the inherent cyclical nature of semiconductors given the powerful, secular trend of AI? For every stock that becomes a multi-generational winner, there are dozens that never reclaim their all-time highs. The cloud sector for example, is becoming an all-time high graveyard with once-upon-a-time Wall Street darlings trading meaningfully below their ATHs for over three years now. 

TSMC will very likely push beyond its ATH yet returns can increase meaningfully if an investor has the guts to buy during a steep selloff. Other times, that selloff isn’t coming and it’s best to buy before a breakout. We answer these complex questions in the analysis below. 

TSMC’s Advanced Nodes have Created a Competitive Moat 

The most advanced node shipping today is the 3nm, offering 15% better performance than the 5nm process when power level and transistors are equal. The die sizes are an estimated 42% smaller than the 5nm and TSMC also states the 3nm process can lower power consumption by as much as 30%.  

Power efficiency is a major advantage, helping to deepen TSMC’s moat. Samsung was first to introduce 3nm process chips in 2022 yet has not been as competitive on yield and power efficiency at a roughly 10% to 20% difference compared to TSMC. The moat is visibly seen in TSM’s pricing power with the dominant foundry charging 25% more for its 3nm process compared to its 5nm process, and customers are willing to forego Samsung to pay the higher pricing.  

Last year, companies such as Apple, Nvidia, AMD and Intel committed to working with TSMC for its 3nm process, and eventually Google and Qualcomm left Samsung “after careful consideration” to also secure a partnership with TSMC.  

This was an important moment for TSMC to complete its near-monopoly in advanced nodes as Google had been outsourcing its Tensor processors to Samsung’s foundry for four generations, before moving to TSMC for the fifth generation. Qualcomm also switched to TSMC from Samsung for the Snapdragon 8 Gen 4 series. 

To attract these large customers with different end markets, TSMC offers a few 3nm processes, such as the N3E, N3P and N3X. This allows a company like Apple to customize the 3nm chips differently than AI chips for hyperscalers. N3E is the baseline for IP design with 18% increased performance and 34% power reduction, N3P has higher performance and lower power consumption, whereas the N3X will offer high-performance computing very high performance but with higher power leakage. 

To illustrate the near monopoly that TSMC has over other foundries, consider that its market share stands at 67.1%, up 2.4% QoQ in Q4. Meanwhile, second-place Samsung was at 8.1% down from 9.1% for a lead of 59 points.  

When comparing revenue, TSMC reported $26.85 billion in Q4 for a 14.1% increase compared to Samsung’s $3.26 billion, which declined 100 basis points to 8.1%.  

In the latest quarter, advanced nodes below 7nm drove 73% of wafer revenue with 3nm contributing 22% of revenue and 5nm representing 36% of revenue. Nvidia is not on the 3nm process yet for its Blackwell shipments, thus 5nm is outsized in terms of its market share.

TSMC 3nm revenue surpasses 20%, up from 9% year-over-year

Pictured Above: 3nm revenue for TSMC has ramped quickly, up from 9% in the year ago quarter and in its third consecutive contributing >20% of revenue. 

TSMC’s 2nm Nanosheet Transistors (Gate All-Around) 

Looking ahead, 2nm is expected to see volume production in the second half of 2025 with a more advanced iteration called N2P scheduled for volume production in the second half of 2026. The 2nm marks a new era in TSMC's transistor architectureas N3 relied on FinFET while gate-all-around (GAA) is being introduced for N2. As the name implies, the gate is wrapped around on all sides compared to FinFET which had a gate wrapped on three sides. By having the gate wrap “all-around,” a greater surface is created for better electrostatic control and to also reduce leakage.  

For TSMC, the 2nm will feature NanoFlex technology, which is similar to FinFlex to where designers can use cells from different libraries. However, due to the new gate-all-around (GAA) nanosheet transistors, there are additional benefits, such as customizing the width and height of cells. For example, GAA can uniquely widen the channels for a performance boost, or there is an option to narrow the channel to optimize power cost. The goal is to increase the performance-per-watt to enable higher levels of output and efficiency.  

According to management on the earnings call: “N2 will deliver full-node performance and power benefits with 10% to 15% speed improvement at the same power or 20% to 30% power improvement at the same speed and more than 15% chip density increase as compared with N3E.” 

Similar to the 3nm, there will be a few variants of the 2nm chip for customers to optimize performance with power requirements. The first two years of the 2nm ramp is outpacing the 3nm and 5nm ramp, signaling good things to come for TSMC. 

TSMC Stock will Close out the Decade with Pricing Power 

As a growth investor, it certainly doesn’t hurt to keep an eye on the horizon. A16 is the 1.6nm process node that will emphasize backside power delivery. Our firm first covered this topic last year in the analysis: “Taiwan Semiconductor Stock: April Sales Soar From Advanced Nodes" stating the Angstrom era will translate to “future process generations where the nodes are not smaller necessarily, rather the transistors they’re built with will be improved upon.”  

For the A16, the Super Power Rail (SPR) backside delivery will offer a redesign to where power routing is moved from the front to the back, which allows for the signaling on the front side to have lower latency. By reducing voltage drop, SPR becomes attractive for AI workloads since multiple cores are operating at high speeds with complex signal routes and dense power requirements.  

Intel’s PowerVia is first to market with the backside power delivery design, yet TSMC’s design will likely result in higher yields and volume production. TSMC also connects the backside power delivery to each transistor’s source and drain, which is more expensive yet also more efficient compared to Intel’s approach. 

The A14 is due out in 2028 and will offer a significant breakthrough in performance while offering up to 25% to 30% lower power consumption, with increased density of 20% to 23%. There will be an A14 variant that offers backside power delivery in 2029. It's expected that A14 will help to drive forward edge AI due to a combination of speed improvements and power reduction. Pricing for the A14 is expected to increase from $30,000 per wafer for the 2nm process to $45,000 per wafer as we close out the decade.  

TSMC to Grow Revenue Mid-20%; AI Accelerator Revenue will Double 

The company is off to a good start for the year with revenue growth of 35.3% YoY while guiding for an acceleration to the 38% range in Q2.  Revenue was down (5.1%) sequentially, impacted by smartphone seasonality, partially offset by AI-related demand growth. However, the Q2 guide represents 13% QoQ growth with revenue between $28.4-29.2 billion.  

TSMC offers monthly reports with April starting Q2 off strong as monthly revenue surged 48.1% YoY and 22% MoM to ~$11.55 billion, with Bloomberg stating the outperformance could be due to a rush in pre-tariff ordering, although certainly 3nm and 5nm demand helped as well.  

TSMC earnings: strong H1 growth, slower H2 outlook

TSMC earnings show strong growth in H1 followed by lower growth in H2. 

This year, IDC is forecasting Foundry 2.0 will grow by 11% compared to 6% last year. Foundry 2.0 describes a broader range of foundry technologies, with the foundry segment expected to grow 18% down from 20% last year.  

Regardless of which way you dice it, TSMC is guiding for above industry growth, stating in the most recent quarter: “we continue to expect our full-year 2025 revenue to increase by close to mid-20s percent in U.S. dollar term.”  

Of this, AI accelerator revenue is expected to double in 2025 and management also forecasts AI to grow at a mid-40% CAGR for five years from 2024: “Based on our planning framework, we are confident that our revenue growth from AI accelerators will approach a mid-40s percentage CAGR for the next five years period starting from 2024.” 

Slower Growth Up Ahead with H1 > H2 

An area of concern is that TSMC is guiding a slowdown in the second half of the year, given the mid-20% revenue growth is below Q1/Q2 revenue growth of 35% to 38%.  

There was a question on the call about this from analyst Charlie Chan asking: “And also based on your full-year guidance, so called the mid-20%, it seems like second half recovery will be very, very gradual or flattish. So I'm wondering if you're already bake in kind of consumer tech demand impact. And if a tariff have some kind of turnaround, right, meaning, for example, major smartphone brands whether there's a chance for you to revise your full-year revenue guidance? Thank you.”

Management answered the H2 weak guide is due to uncertainty and tariffs: “Charlie, as we also said in the prepared remarks, there are uncertainties and potential risk from tariffs exist.”

Analysts are a bit concerned about the full-year guide given the risks key customers are facing from April’s tariff shocks. JPMorgan analysts say TSMC “could pare [its forecast] slightly to target low- to mid-20%” sales growth, while Deutsche Bank analysts raised the concern that the chipmaker “may also withdraw its guidance as customers adjust to tariffs.”    

Management also stated that things are more “balanced now” — meaning demand is not overwhelming supply like it once did: “Brett, three months ago. Now I can tell you that three months ago, we are barely – we just cannot supply enough wafer to our customer. And now it's a little bit balanced, but still the demand is very strong. And you are right. Other than China, the demand is still very strong, especially in U.S. And so we are confident that we are going to double our AI revenue this year.” 

Echoing these comments, if we look at the segments listed below, we can see that smartphones are reporting higher seasonal weakness than last year. 

TSMC Reports Strength in HPC offset by Smartphones 

HPC Revenue rose 7% QoQ 

TSMC continues to ride AI accelerator tailwinds, evident in its rising HPC revenue and mix. HPC revenue rose 7% QoQ in Q1, surpassing $15 billion for the first time. HPC accounted for 59% of TSMC’s revenue, expanding from 53% of revenue last quarter.

Top tech firms drive TSMC AI chip growth via HPC segment

Pictured above: Major tech companies choose TSMC for AI chips, visible in its HPC segment 

Management stated that they “continue to observe robust AI-related demand from our customers,” and reaffirmed that AI accelerator (GPU + ASIC + HBM) revenue is expected to double YoY in 2025. As stated, management also confidently forecast AI accelerator revenue to grow at a mid-40% CAGR over the next five years starting in 2024. 

Smartphones Declined 22% QoQ: 

Smartphone revenue declined (22%) QoQ due to seasonal trends, accounting for 28% of revenue in Q1. This was larger than last year’s (16%) seasonal decline.

TSMC sees increased seasonal weakness in smartphone segment

TSMC is reporting higher seasonal weakness in the smartphone segment compared to last year. 

IoT, Auto and Other: 

IoT revenue declined (9%) QoQ to account for 5% of revenue, while Automotive revenue increased 14% QoQ to also account for 5% of revenue. Digital Consumer Electronics increased 8% QoQ to account for 1% of revenue, while Other revenue rose 20% QoQ to account for 2% of revenue. 

Gross Margin to See 3% to 4% Headwind  

Margins came in at the higher end of guidance in Q1, with TSMC seeing continuing strength in Q2.  

  • Gross margin was 58.8%, at the high end of management’s guided range for 57-59%, dipping slightly sequentially from the January earthquake impacts and the ramp of the Kumamoto fab. On a YoY basis, gross margin expanded 5.7 points. 
  • Operating margin was 48.5%, at the high end of the guided 46.5-48.5% range.  
  • Net margin was 43.1%, flat with Q4 and up 3.1 points YoY. 

TSMC delivered nearly 54% YoY growth in EPS in Q1 as it delivered a slight beat to $2.12, its third straight quarter with EPS growth above 50% YoY. This growth also reflects TSMC’s operating leverage, outpacing revenue growth in the mid to high-30% range.

TSMC Q1 EPS up 53.6%, but growth expected to plateau later in the year

In Q1, TSMC reported strength on the bottom line with EPS growth of 53.6% although EPS will face tough comps with growth plateau’ing toward the end of the year. 

For Q2, EPS growth is expected to maintain this >50% growth rate to $2.24, before decelerating rather sharply to the mid-single digits by Q4 as it begins to lap these more difficult 50% growth comps. 

FY25 EPS is currently expected to increase 31.5% YoY to $9.26, before decelerating to 15.2% growth in FY26 to $10.66. 

For Q2, TSMC guided for similar gross and operating margin ranges, but flagged some headwinds from the fabs buildout. However, a larger headwind exists – FX. TSMC’s guidance below assumes an exchange rate of US$1 to NT$32.5, yet the current rate sits at US$1 to $NT30.1, down nearly 8% from the guided level.  

  • Gross margin is forecast at 57-59%, down 0.8 points sequentially at midpoint as dilutive impacts from ramping the Arizona fab kicks in. Management added that overseas fab impacts are expected to grow more pronounced throughout the year, forecasting 2-3% dilutive impact for the full year from Arizona and Kumamoto. 
  • Operating margin is forecast at 47-49%, down 0.5 points sequentially at midpoint. 

Over the next five years, management sees the dilutive impact from ramping its overseas fabs widening, projecting it to start at 2-3% each year in the early ramp stages before widening to 3-4% each year. Despite this, TSMC remains confident in its ability to keep long-term gross margins at 53% or higher.  

$100B Investment Announced for Arizona Fabs 

In the recent quarter, the company’s cash flow increased 37% YoY to $19.0 billion, for a 74.5% margin, a slight YoY expansion. Capex was $10.1 billion in Q1, down more than 10% QoQ but up more than 74% YoY. Cash and equivalents rose $7.5 billion sequentially to $81.4 billion, while debt is $30.4 billion. 

In March, TSMC announced a new $100 billion investmentto expand manufacturing in the United States. The $100 billion will go toward building new fabs in Arizona bringing TSMC’s total investment in the United States to $165 billion. Once the new fabs are built, 30% of TSMC’s advanced nodes capacity will be located in Arizona.  

TSMC’s current Arizona fabs began producing chips this year, with Apple being the first to receive chips on the 4nm/5nm process and Nvidia receiving chips later this year. In addition, it’s been reportedthe 2nm process is seeing a 90% yield for memory products in the newer Arizona fab.  

Notably, due to rising costs, there are rumors that TSMC will raise prices from the Arizona fab by 30%. 

Subscribe for Full Access to the Article 

Below the Paywall is the Following information  

  • Our analysis on the stock’s valuation and if the stock is a “buy” or a “hold” given the stock faces immense demand from the AI economy yet must also weather geopolitical tensions. 
  • The I/O Fund’s trading plan for TSMC including never-before published buy targets over a 12 to 18-month time frame.
    Sign Up to Continue ReadingSign Up to Continue Reading

Paid subscribers, click here to view the full articleclick here to view the full article

Not ready to subscribe but want more thoughtful analysis from a top-performing team in tech? Every week, we publish free research. 👉 Sign up here.

For any account-related issues, please contact our customer support team at premium@io-fund.com.

Please note: The I/O Fund conducts research and draws conclusions for the Fund’s positions. We then share that information with our readers. This is not a guarantee of a stock’s performance. Please consult your personal financial advisor before buying any stock in the companies mentioned in this analysis.

Recommended Reading:

  • Historic Market Uncertainty Meets $7 Trillion Debt Wall: What Comes Next for the S&P 500
  • Nvidia Stock Faces a Choppy Q2, But Tailwinds Build for H2 Acceleration
  • Microsoft Stock Surges After Q3 2025 Earnings: What Separates Azure from AWS, Google Cloud
  • Tesla Stock Faces Recalibration of Growth Expectations
Posted in Semiconductor StocksLeave a Comment on Taiwan Semiconductor Stock: AI Growth Amid Geopolitical Risk 

Posts navigation

Newer posts

Recent Posts

  • The IPO Glut of 2020: Why Valuations Have Gone Too Far
  • Zoom Discusses Two Important Catalysts In Q1 Earnings
  • Three Risk Management Tools the I/O Fund Offers
  • Micron Is Up 900%. Here’s Why the AI Memory Trade May Still Have Room to Run
  • Credo: Reliability Leader Aggressively Moves into Optics

Recent Comments

No comments to show.

Archives

  • June 2026
  • May 2026
  • April 2026
  • March 2026
  • February 2026
  • January 2026
  • December 2025
  • November 2025
  • October 2025
  • September 2025
  • August 2025
  • July 2025
  • June 2025
  • May 2025
  • April 2025
  • March 2025
  • February 2025
  • January 2025
  • December 2024
  • November 2024
  • October 2024
  • September 2024
  • August 2024
  • July 2024
  • June 2024
  • May 2024
  • April 2024
  • March 2024
  • February 2024
  • January 2024
  • December 2023
  • November 2023
  • October 2023
  • September 2023
  • August 2023
  • July 2023
  • June 2023
  • May 2023
  • April 2023
  • March 2023
  • February 2023
  • January 2023
  • December 2022
  • November 2022
  • October 2022
  • September 2022
  • August 2022
  • July 2022
  • June 2022
  • May 2022
  • April 2022
  • March 2022
  • February 2022
  • January 2022
  • December 2021
  • November 2021
  • October 2021
  • September 2021
  • August 2021
  • July 2021
  • June 2021
  • May 2021
  • April 2021
  • March 2021
  • February 2021
  • January 2021
  • December 2020
  • November 2020
  • October 2020
  • September 2020
  • August 2020
  • July 2020
  • June 2020
  • May 2020
  • April 2020
  • March 2020
  • February 2020
  • January 2020
  • December 2019
  • November 2019
  • October 2019
  • September 2019
  • August 2019
  • July 2019
  • June 2019
  • May 2019
  • April 2019
  • March 2019
  • February 2019
  • January 2019
  • December 2018
  • November 2018
  • October 2018
  • September 2018
  • August 2018
  • July 2018
  • June 2018
  • May 2018
  • April 2018
  • February 2018
  • January 2018

Categories

  • 5G
  • About
  • Accounting Tips
  • AdTech
  • Ai Platforms
  • Ai Platforms
  • Ai Platforms
  • Ai Platforms
  • Ai Platforms
  • Ai Platforms
  • Ai Platforms
  • Ai Platforms
  • Ai Platforms
  • Ai Platforms
  • Ai Platforms
  • Ai Platforms
  • Ai Platforms
  • Ai Platforms
  • Ai Platforms
  • Ai Platforms
  • AI Stocks
  • AI Stocks
  • Analysts
  • Application Monitoring
  • Application Monitoring
  • Applications
  • Applications
  • Applications
  • Applications
  • Applications
  • Applications
  • Applications
  • AR
  • Audit Reports
  • Autonomous Vehicles
  • Autonomous Vehicles
  • Autonomous Vehicles
  • Autonomous Vehicles
  • Autonomous Vehicles
  • Autonomous Vehicles
  • Autonomous Vehicles
  • Avod
  • Avod
  • Battery Charging
  • Bear Market
  • Bitcoin
  • Bitcoin
  • Bitcoin
  • Bitcoin
  • Bitcoin
  • Bitcoin
  • Bitcoin
  • Blockchain
  • Blockchain
  • Blockchain
  • Blockchain
  • Blockchain
  • Blockchain
  • Blockchain
  • Broad Market Today
  • Bull Market
  • Bull Market
  • Chainlink
  • Chainlink
  • Chainlink
  • Chainlink
  • China Stocks
  • Cloud
  • Cloud Infrastructure
  • Cloud Infrastructure
  • Cloud Infrastructure
  • Cloud Infrastructure
  • Cloud Infrastructure
  • Cloud Infrastructure
  • Cloud Infrastructure
  • Cloud Platforms
  • Cloud Platforms
  • Cloud Software
  • Cloud Software
  • Cloud Software
  • Cloud Software
  • Cloud Software
  • Cloud Software
  • Cloud Technology
  • Company
  • Company
  • Console Gaming
  • Console Gaming
  • Console Gaming
  • Consumer
  • Consumer
  • Consumer
  • Consumer
  • Consumer
  • Consumer
  • Consumer
  • Consumer
  • Consumer
  • Consumer
  • Consumer
  • Consumer
  • Consumer
  • Consumer
  • Consumer Tech
  • Corrections
  • Crypto Investment
  • Ctv
  • Ctv
  • Ctv
  • Ctv
  • Ctv
  • Ctv
  • Ctv
  • Ctv
  • Ctv
  • Ctv
  • Cybersecurity
  • Cybersecurity
  • Cybersecurity
  • Cybersecurity
  • Cybersecurity
  • Cybersecurity
  • Cybersecurity
  • Cybersecurity
  • Cybersecurity
  • Cybersecurity
  • Cybersecurity
  • Cybersecurity
  • Data
  • Data Analytics
  • Data Analytics
  • Data Analytics
  • Data Center
  • Data Center
  • Data Center
  • Data Center
  • Data Center
  • Data Center
  • Data Center
  • Data Center
  • Data Center
  • Data Center
  • Data Center
  • Data Center
  • Data Center
  • Data Center
  • Data Center
  • Data Center and Processing
  • Data Warehousing
  • Data Warehousing
  • Data Warehousing
  • Data Warehousing
  • Databases
  • Databases
  • Databases
  • Databases
  • Dating
  • Defi
  • Digital Ads
  • Digital Ads
  • Digital Ads
  • Digital Ads
  • Digital Ads
  • Digital Ads
  • Digital Ads
  • Digital Ads
  • Digital Ads
  • Digital Ads
  • Digital Ads
  • Digital Ads
  • Digital Ads
  • Digital Ads
  • E-Commerce
  • Earning Updates
  • Earning Updates
  • Earning Updates
  • Earning Updates
  • Earning Updates
  • Earnings Report
  • Earnings Report
  • Earnings Report
  • Earnings Report
  • Earnings Report
  • Earnings Report
  • Earnings Report
  • Earnings Report
  • ECommerce
  • Electric Vehicles
  • Electric Vehicles
  • Electric Vehicles
  • Electric Vehicles
  • Electric Vehicles
  • Electric Vehicles
  • Electric Vehicles
  • Energy Stocks
  • Enterprise
  • Enterprise
  • Enterprise
  • Enterprise
  • Enterprise
  • Enterprise
  • Enterprise
  • Enterprise
  • Enterprise
  • Ethereum
  • Events1
  • Events1
  • Exchange
  • Faq
  • Finance
  • Financial Analysis
  • Financial Analysis
  • Financial Analysis
  • Financial Analysis
  • Financial Analysis
  • Financial Analysis
  • Financial Analysis
  • Financial Analysis
  • Financial Analysis
  • Financial Analysis
  • Financial Analysis
  • Financial Analysis
  • Financial Markets
  • FinTech
  • Fundamental Analysis
  • Gambling
  • Gaming
  • Genomics
  • Glossary
  • Green Energy
  • Growth Stocks
  • Growth Stocks
  • Growth Stocks
  • Headsets
  • Headsets
  • Health Tech
  • Hydrogen
  • Identity
  • Identity
  • Identity
  • Inflation
  • Inflation
  • Inflation
  • Internet of Things
  • Interviews
  • Interviews
  • Interviews
  • Interviews
  • Investing
  • Investing
  • Ltbh
  • Ltbh
  • Ltbh
  • Ltbh
  • Ltbh
  • Macro Trends
  • Macro Trends
  • Market Trends
  • Market Trends
  • Market Trends
  • Market Trends
  • Market Trends
  • Market Trends
  • Market Trends
  • Market Updates
  • Market Updates
  • Market Updates
  • Market Updates
  • Market Updates
  • Market Updates
  • Market Updates
  • Market Updates
  • Market Updates
  • Market Updates
  • Media
  • Membership
  • Mining
  • Mobile
  • Mobile
  • Mobile
  • Mobile
  • Mobile Gaming
  • Mobile Gaming
  • Mobile Gaming
  • Multimedia
  • Music Streaming
  • NVDA | NVIDIA Corporation
  • Performance Updates
  • Pin Content
  • Podcasts
  • Podcasts
  • Podcasts
  • Portfolio
  • Premium Research
  • Press Releases
  • Press Releases
  • Productivity
  • Productivity
  • Productivity
  • Productivity
  • Productivity
  • Productivity
  • Productivity
  • Reports and Whitepapers
  • Research Services Preview
  • Resources
  • Resources
  • Semiconductor Stocks
  • Semiconductors
  • Semiconductors
  • Semiconductors
  • Semiconductors
  • Semiconductors
  • Semiconductors
  • Semiconductors
  • Semiconductors
  • Semiconductors
  • Semiconductors
  • Semiconductors
  • Semiconductors
  • Semiconductors
  • Social Media
  • Social Media
  • Social Media
  • Social Media
  • Social Media
  • Social Media
  • Social Media
  • Software
  • Software
  • Software
  • Software
  • Software
  • Software
  • Software
  • Software
  • Software
  • Software
  • Software
  • Software
  • Software
  • Software
  • Software
  • Solar
  • Solar
  • Stock Analysis PDFs
  • Stock Updates
  • Stock Updates (Blogs)
  • Supplychain
  • Supplychain
  • Supplychain
  • Supplychain
  • Supplychain
  • Supplychain
  • Svod
  • Svod
  • Svod
  • Svod
  • Svod
  • Svod
  • Tech Podcast
  • Tech Stock News
  • Tech Stock News
  • Tech Stock News
  • Tech Stock News
  • Tech Stock News
  • Tech Stocks
  • Tech Stocks
  • Tech Stocks
  • Tech Stocks
  • Tech Stocks
  • Tech Stocks
  • Tech Stocks
  • Tech Stocks
  • Tech Stocks
  • Tech Stocks
  • Tech Stocks
  • Tech Stocks
  • Tech Stocks
  • Tech Stocks
  • Technical Analysis
  • Telehealth
  • Telehealth
  • Telehealth
  • Telehealth
  • Testing Equipment
  • Testing Equipment
  • Top Tech Stock News
  • Travel
  • Trends Report
  • Tutorials
  • Uncategorized
  • Updates
  • Updates
  • Updates
  • Video
  • Video
  • Video
  • Video
  • Video Footage
  • VR
  • Webinar Alerts
  • Webinar Alerts
  • Webinars
Proudly powered by WordPress | Theme: iofund by iofund.co.uk.