Skip to content
Logo-main-white.860316a8

I/O Fund

  • Home
  • Free Stock Analysis
  • AI Stocks
  • BEST OF 2025
  • Analysts
  • Nvidia Hub
  • About
    • Case Studies
    • About Us
    • Premium Services
    • Pricing
    • Notable Wins
    • I/O Fund Reviews
    • Media
  • Contact Us

Category: Tech Stocks

Out of Favor With Investors, Poshmark Has Long Term Potential

Posted on March 25, 2021June 30, 2026 by io-fund
Out of Favor With Investors, Poshmark Has Long Term Potential

Poshmark sits at the intersection of three key trends: non-new, sustainability, and social e-commerce. A consumer-to-consumer online marketplace for pre-owned items, Poshmark is a fashion-oriented platform that offers apparel, accessories, beauty and wellness, footwear, home goods, toys and games, and a new pets category. 

The app makes online shopping social, with a user experience similar to Etsy, Instagram, and Pinterest. Poshmark encourages users to follow each other, and like and share items for sale in users’ closets. It also offers video through Posh Stories, free virtual events known as Posh Party Live, and virtual meetups. Prior to the pandemic, Poshmark also supported in-person events.

As the largest fashion-oriented online C2C marketplace in the U.S., Poshmark’s IPO generated significant excitement. The company initially planned to offer 6.6 million shares at $35 to $39, but due to demand priced the IPO at $42. 

In its first day of trading Jan. 14, the stock opened at $97.50 and closed at $101.50, with an intraday high of $104.98. The stock has been falling ever since and reached a new low March 25 when it closed under $39.

Now that the valuation has come back down to earth, Poshmark may offer a good opportunity for investors who believe the future of ecommerce will be social. Below we look at competitors, fundamental, quarterly results, market opportunity, and potential tailwinds. 

Ebay Posts Record Growth  

To understand the potential opportunity in Poshmark, first we need to look at one of the largest online marketplaces in the world, Ebay. As more shopping moves online, specialized ecommerce platforms like Poshmark are fighting for current and potential Ebay customers. 

Founded in 1995, Ebay is the grandfather of the online auction. Like its much larger rival, Amazon, Ebay facilitates B2C and C2C sales through its website and makes money on transactions. Unlike Amazon, which has strict guidelines around used items, sellers can list almost anything on Ebay.  

But it has faced stiff competition from a new generation of online marketplaces that cater to niche interests, including public companies like Poshmark, Mercari, and The RealReal, which encourage users to clear their closets to make extra cash. 

In the universe of private companies, there is also a platform for every niche, from gently used children’s apparel on Kidizen to used tech on Gazelle.   

After years of declining growth, Ebay may have turned a corner last year. Due to tailwinds from Covid-19 and the resulting economic lockdown, the company reported double digit revenue growth in 2020. Here are the full year 2020 highlights: 

  • Revenue was $10.3 billion, up 19% on an as-reported basis. 
  • Gross merchandise volume (GMV) was $100 billion, up 17% on an as-reported basis and an FX-Neutral basis. 
  • GAAP and non-GAAP operating margin were 26.4% and 31.3% respectively. 

Due to a strong holiday season, Ebay also reported strong Q4 results: 

  • Revenue of $2.9 billion, up 28.1% YoY, beat expectations by $160 million. 
  • Non-GAAP EPS of $0.86 beat by $0.03.
  • GAAP EPS of $1.12 beat by $0.48.  
  • GMV was $26.6 billion versus consensus of $25.18 billion. 
  • Annual active buyers grew 7% to 185 million. 

Still, this pales in comparison with high growth e-commerce marketplaces, not all of which are young companies. 

Overstock, founded only a few years after Ebay in 1999, grew 2020 Q4 revenue 84.4% YoY. Wayfair, founded in 2002, grew Q4 revenue 45.1% YoY. Fintwit favorite Etsy, founded in 2005, grew Q4 revenue an astounding 128.7%. 

With the tailwinds from Covid looking ready to expire for Ebay, and the entire ecommerce sector, the market is dubious about whether Ebay can continue growth and beat tougher comps. Executives were upbeat in the most recent report, noting the progress the company made in executing on the three pillars of its long term vision:

  1. Defend the core business by building compelling next-gen experiences.
  2. Become the partner of choice for sellers.
  3. Cultivate lifelong trusted relationships with buyers. 

It is clear from the report that Ebay executives are aware of the risks to its core business from other ecommerce platforms. To execute on its strategic vision, Ebay is focusing on seasonal opportunities and non-new, including refurbished, which was a top trend for holiday shopping. 

How Big is the Opportunity in Non-New? 

The online U.S. resale market for apparel and footwear was estimated at $7 billion in 2019 and is expected to grow to an estimated $26 billion in 2023, according to data from GlobalData cited in Poshmark’s S-1.

A report last June by Poshmark competitor Thredup, which filed for IPO recently and is expected to begin trading on the Nasdaq March 26, valued the secondhand apparel market at $28 billion and predicted it would reach $64 billion within five years. It said the resale market grew 25 times faster than the overall retail market in 2019, with an estimated 64 million people buying secondhand products. 

Good opportunities attract competition, and competition for the online secondhand apparel and accessories market is fierce. 

In addition to Poshmark, Depop, Grailed, Mercari, Thredup, Tradesy, The RealReal, other notable competitors include Vestiaire Collective, a French company that recently raised $216 million in fresh funding, and Vinokilo, a German company that has not raise any venture capital and has been consistently profitable. 

Luxury brands and platforms are also starting to consider controlling the lifecycle of their own products. For example, luxury marketplace Farfetch launched Farfetch Second Life in November 2020. It allows customers to trade in high-end bags in exchange for a credit to shop new collections. 

Authentication is a key feature of the luxury resale market, such as designer handbags, shoes, and apparel. As part of its strategic vision, Ebay rolled out its own authentication program for secondhand watches over $2,000 and sneakers over $100 last fall.

Based on the results, it is a potentially profitable niche for Ebay, and validates part of the opportunity Poshmark and its competitors are trying to exploit. Ebay saw a double digit increase in GMV growth in Q4 versus Q3 for watches over $2,000, while sneakers over $100 grew triple digits YoY in Q4.

Investors should note that authentication has been controversial for sites such as The RealReal, an online and brick-and-mortar marketplace that offers authenticated luxury clothing, jewelry, and watches. 

The RealReal has been plagued by claims in the media, and on social platforms, that fraudulent products slip past low paid authenticators and are sold on the platform. The RealReal is also being sued by Chanel, which alleges that The RealReal is selling counterfeit Chanel bags. 

Poshmark has faced similar claims from users. So far, accusations against The RealReal seem to be more prevalent and much higher profile. The potential risk is real to any company that claims 100% authentic designer goods.

Tailwinds from Sustainability

Consumers are increasingly aware of the fashion industry’s impact on the environment. The U.S. sustainability market is projected to reach $150 billion in sales this year, according to Nielsen. 

In Europe, 67% of surveyed consumers consider the use of sustainable materials to be an important purchasing factor, and 63% of consumers consider a brand’s promotion of sustainability in the same way, according to July 17 report from McKinsey & Company on Sustainability in fashion. 

Secondhand is inherently more environmentally friendly, as it extends the life of consumer products. 

Seller Ecosystem: Size is a Moat

Sellers create marketplaces by offering the products that attract consumers. That is why one of one of Ebay’s three key priorities for its long term vision is becoming the partner of choice for sellers. In a virtuous cycle, sellers create the marketplace that keeps buyers coming back, which keeps sellers engaged. 

For example, of all buyers who activated on Poshmark between 2012 and 2018, 34% also activated as sellers by the end of 2019. Of all sellers who activated between 2012 and 2018, 39% activated as buyers by the end of 2019, according to the company’s S-1 Registration Statement.

For sellers, every marketplace has advantages and disadvantages. Poshmark’s fees are less complicated than Ebay’s but significantly higher:

·         Poshmark. For sales under $15, Poshmark charges a flat rate of $2.95. For sales above $15, the fee is 20%.

·         Ebay. Ebay has been working to simplify its notoriously complicated fees. For most categories on Ebay, managed payments customers pay 12.35% up to $7,500, plus 2.35% on the portion of the sale over $7,500.

Poshmark has been criticized for its high fees. But the company acknowledged in its S-1 the potential for future reductions:

“In the future, we may be unable to attract new sellers or retain current sellers at these fee levels, as they may choose to sell their merchandise on other platforms with lower fees. Furthermore, pricing pressures and increased competition generally could result in having to decrease fees, which could cause reduced revenues, reduced margins, or losses, any of which would harm our business, results of operations, and financial condition.”

For Ebay, size is a moat. With its gargantuan user base, that moat is not easy to disrupt. The same may be true of Poshmark, which is the leading C2C marketplace for fashion, according to data from May 2020 from Statista, a German company that specializes in market and consumer data.

poshmark's number of unique monthly visitors in millions

Founded in 2011, Poshmark has grown significantly larger than other fashion oriented secondhand marketplaces, most of which were founded around the same time. 

Notable competitors in secondhand fashion include Depop, founded in 2011; Grailed, founded in 2014; Mercari, launched in the U.S. in 2014; The RealReal, founded in 2011; Thredup, founded in 2009; and Tradesy, founded in 2009. 

Mercari, a Japanese company, had 3.4 million monthly active users in 2019, according to a company press release. It can be difficult to sell on platforms with much smaller user bases, although it helps to offer desirable brand names, according to user reviews.

Some sellers dislike Poshmark’s social aspects—it creates extra work by forcing sellers to like and share items, and negotiate with potential buyers—the size of the marketplace means sellers and buyers keep coming back. In 2020, Users who spent an average of 27 minutes daily on the app continue to re-engage over time as buyers and sellers, according to Poshmark’s Q4 report. 

Fundamentals: User and GMV Growth 

Poshmark launched in the U.S. in 2011 with a valuation of more than $600 million. The company has an asset light model and does not own or manage inventory, as items are listed, sold, and shipped by sellers. 

In May 2019, Poshmark expanded to Canada, growing its community to more than 1.4 million users in that country within the first year. 

International GMV was $6.4 million in 2019, according to the company’s S-1. It grew to $32.6 million in the nine months ended Sept. 30, 2020. For each of these periods, revenue from international operations was less than 10% of the company’s net revenue.

As of Sept. 30, 2020, Poshmark had 31.7 million active users in North America, 6.2 million active buyers, and 4.5 million active sellers, according to the S-1.

Executives did not update the total number of active users or active sellers in the Q4 report. It did note an increase in active buyers to 6.5 million, a 20% increase YoY from 5.4 million in Q4 2019. Social interactions also grew 48% to 30.4 billion in 2020, according to the Q4 report.  


Poshmark Active Buyers (Thousands) 

poshmark active buyers (thousands)

Source: S-1 

Poshmark doubled the number of active buyers from June 30, 2018 to June 30, 2020, which it says has been a key driver of GMV growth.

GMV in Millions  

poshmark's gmv in millions


The company plans to continue growing through increased engagement, new product categories, and international expansion, starting with English-speaking countries. Last month, Poshmark launched in Australia. 

Poshmark chose Australia as its first market outside of North America due to the well-established thrift shop culture, high rates of e-commerce adoption, environmentally conscious consumers, said Chief Executive Officer Manish Chandra, in an interview with Bloomberg. 

Quarterly Results and Valuation 

Poshmark had a market capitalization of $3.35 billion and an enterprise value-to-sales ratio of 12.60 as of March 24. The company reported Fiscal Q4 2020 earnings March 11 for the period ending Dec. 31.

In Q4, Poshmark achieved its third consecutive quarter of profitability and had revenue of $69.3 million, a 27% increase from $54.7 million in the fourth quarter of 2019, according to the report.

Income from operations was $1.6 million, compared to a loss of ($15.1) million in the fourth quarter of 2019. GMV was $387.2 million, an increase of 28% YoY from $302.1 million in Q4 2019. Quarterly GMV has increased YoY for the past 11 quarters.

Adjusted EBITDA was $4.2 million which increased from a loss of ($12.6) million in the fourth quarter of 2019. Adjusted EBITDA margin was 6.1%.

GAAP diluted net loss per share attributable to common stockholders was ($0.31). Non-GAAP diluted net income per share to common stockholders was $0.05 a share and excludes non-cash expenses related to convertible notes and warrants due to the increase in the fair market value of our common stock share price.

For the full year 2020, income from operations was $23.4 million, compared to a loss of ($49.8) million in 2019. Net revenue was $262.1 million, a 28% increase YoY from $205.2 million in 2019.

GMV was $1.4 billion, an increase of 29% YoY from $1.1 billion in 2019. GMV has increased YoY since the company was founded in 2011.

Trailing 12 months Active Buyers reached 6.5 million in the fourth quarter of 2020, a 20% YoY increase from 5.4 million from Q4 2019. The company did not update the number of active sellers. Adjusted EBITDA was $34.3 million which increased from a loss of ($37.1) million in 2019. Adjusted EBITDA margin was 13.1% in 2020.

GAAP diluted EPS attributable to common stockholders was $0.22. Non-GAAP diluted net income per share to common stockholders was $1.25 a share and excludes non-cash expenses related to convertible notes and warrants due to the increase in the fair market value of our common stock share price, and the impact from the undistributed earnings attributable to participating securities.

Cash, cash equivalents, and marketable securities were $262.1 million as of Dec. 31, 2020. During the third quarter, Poshmark issued a $50.0 million three-year convertible note which converted into 1.4 million shares of Class A Common Stock upon completion of the IPO on Jan. 14, 2021.

Guidance for Q1 2021 is $76.5 at the midpoint versus $80 million expected, with adjusted EBITDA of $1.5 million at the midpoint. 

The company plans to continue executing on its four growth strategies: focus on innovation to drive user engagement, growing international footprint and capability, growth through category expansion, and deliver robust, easy-to-use, effective seller services, according to the report.

As part of that plan, in 2020 the company launched two new product categories: Beauty & Wellness and Toys & Games and launched several new features. Poshmark also completed the rollout of “Posh Stories,” the company’s first video feature which enables sellers to showcase and sell their listings with short videos and photos, released “Drops Soon,” feature that allows Poshmark sellers to pre-market items not yet available for purchase, and launched Reposh, a feature that provides users with a one-click way to resell items purchased on the marketplace.

Conclusion 

Poshmark is the largest online C2C marketplace in the U.S. that specializes in fashion, in a space with fierce competition. Its success is not limited to the U.S. After expanding to Canada in 2019, Poshmark grew its community there to 1.4 million users within the first year. Users apparently enjoy the social aspect of the platform, which uses an asset light model that been profitable for the last three quarters. 

The pandemic has created uncertainty for Poshmark, and the entire ecommerce sector. But with the recent expansion to Australia, and the launch of new categories and features, Poshmark has room to grow. It benefits from long term tailwinds, including an increased interest among consumers in sustainability and the rise of social commerce. 

Some investors have criticized the company’s social platform, saying it is a waste of time for sellers who will leave the platform. Poshmark has also been criticized for its high fees. We think these are relatively minor complaints about a platform with a record of success. 

Any company can lose market share to competitors. But Poshmark’s competitors have a lot of catching up to do. Now that the valuation has come down to earth, and sentiment with it, the stock may provide a good long-term opportunity—even if the growth is not what hypergrowth investors are used to.

Disclaimer: This article represents the opinion of the writer, who may disagree with the official position of Beth Kindig and I/O Fund. Jessica Ablamsky does not currently own shares of Poshmark but may initiate a position within the next 72 hours. Beth Kindig and the I/O Fund does not currently own shares of Poshmark. The content in this article is intended to be used for informational purposes only. The author has not received any compensation from any third party or company discussed in this article. The content is the expressed opinions of the author and is intended for educational and research purposes. Any thesis presented is not a guarantee of any particular stock’s future prices, so please factor this risk into your own analysis. It is very important that you do your own analysis before making any investments based on your personal circumstances. The author is not a licensed professional advisor. Please seek counsel form a licensed professional before acting on any analysis expressed in this article, to see if it is appropriate for your personal situation.
 

Posted in Consumer, E-Commerce, Tech StocksLeave a Comment on Out of Favor With Investors, Poshmark Has Long Term Potential

The importance of the NASDAQ100, and Levels to Watch

Posted on March 25, 2021June 30, 2026 by io-fund
The importance of the NASDAQ100, and Levels to Watch

 Long term technical signals suggest the current selloff is a buying opportunityLong term technical signals suggest the current selloff is a buying opportunity

Coming out of the 2008 Financial Crisis, we saw a shift from value to growth for the first time since the 90s. Growth stocks took the lead and have been the general theme of the current secular bull market that we are in. With a multitude of tech focused microtrends like the internet, mobile, social media, e-commerce, now cloud and soon to be 5G and AI, the tech sector has led growth stocks. 

From a broad market perspective, the NASDAQ100 (NDX), and index of predominantly large cap stocks, has been the most important index to track within the current cycle. It has led the broad market into and out of almost every major correction since this bull market began.  

This pattern has even continued since the quick bear market in March of 2020. From peak to trough, while the S&P 500 saw a 35.40% drawdown, the richly valued NDX only saw a 30.50% drawdown. Since the March 23rd low, we have seen a consistent trend where the NASDAQ100 has led us into each correction and also bottomed before the S&P 500. 

However, since the recent correction began on February 16th, we have seen a meaningful shift from growth to value. Where the DOW is at new highs, the S&P 500 and DOW Transports are down less than 2%, while the NASDAQ100 is still about 7% away from new highs.  

This is a meaningful rotation, which we see as healthy. The microtrends in tech are not over or at the end of their cycle, regardless of stock prices. Also, we want to see as many sectors and stocks participating in this bull market, which is happening. 

Considering the importance of tech’s leadership, as well as the overall weight of tech within the S&P 500, which currently sits at about 24%, without the NASDAQ 100 participating in new highs, I would consider any bottom to be suspect. For this reason, we believe tracking the NASDAQ100 to be crucial right now in order to glean broad market cues. 

I/O Fund has been preparing for a correction since late February. We built up a nice cash position, which we were vocal about with our readers as well as on Twitter (here here here). We also added a series of hedges prior to the selloff, and have recently added them back due to the possibility of a lower low.  As of now, the long-term technical signals, and trend is still up. This suggests the current selloff is a buying opportunity, which we have been taking advantage of. 

NDX: Levels to Watch 

From a technical perspective, there are two scenarios we are tracking:

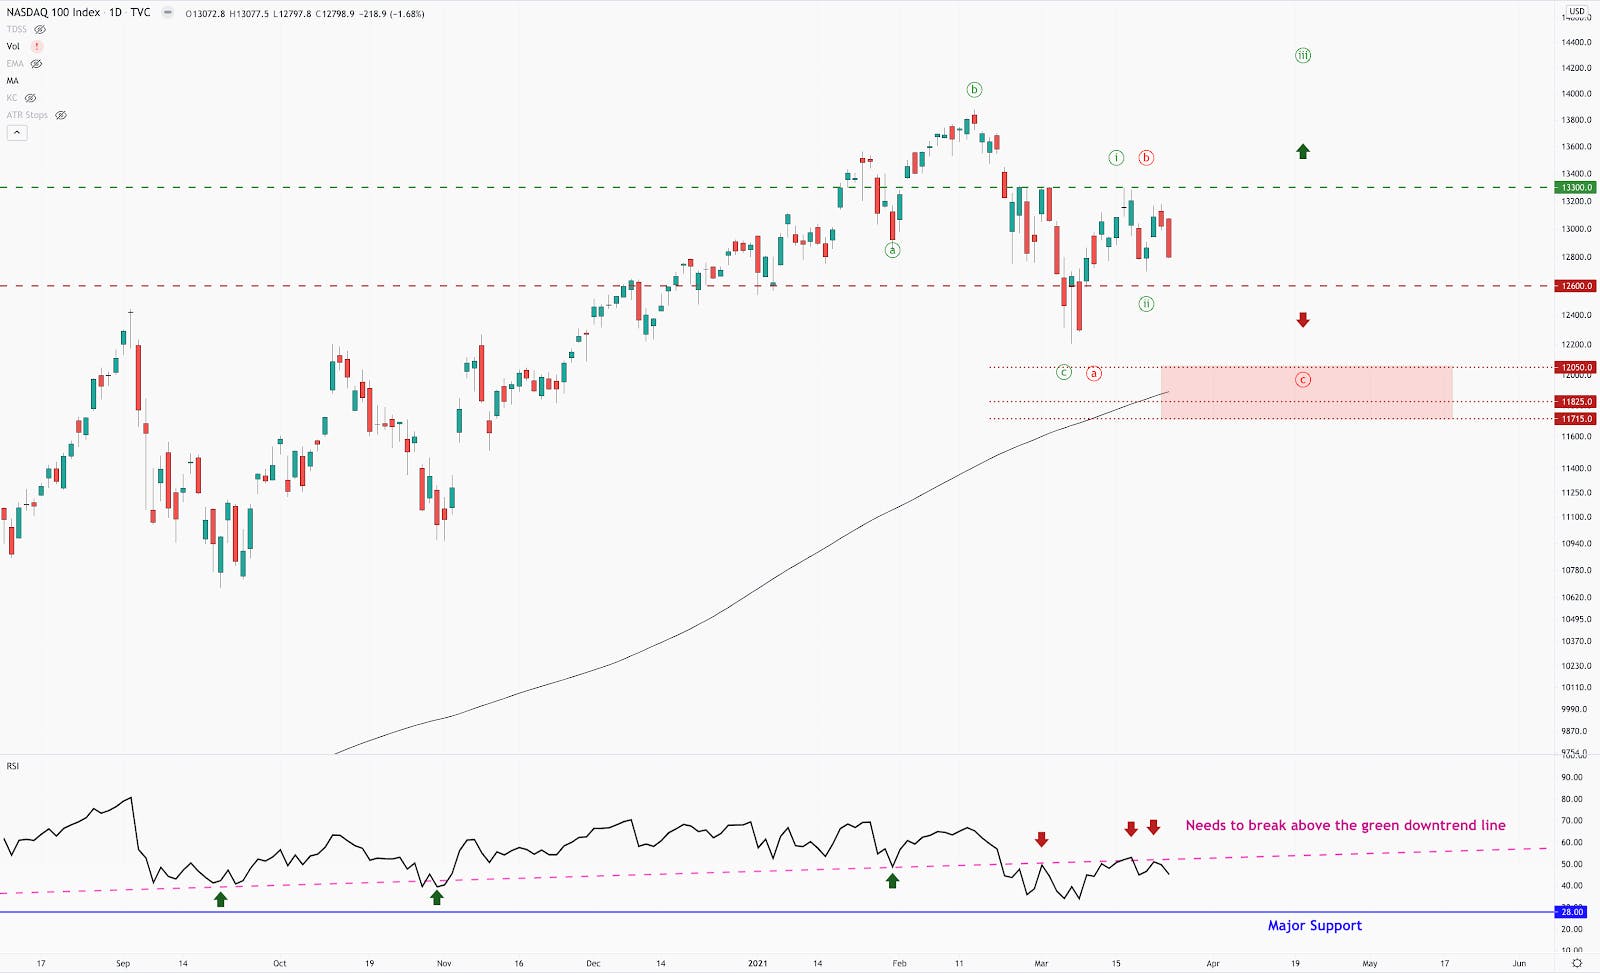
  1. The correction is over. For the green count in the chart above, we finished the final leg in the March 5th correction. If NDX holds 12,600 and we see a breakout above 13,300, the low is likely in for this correction. To confirm this scenario, we need NDX to breakout above 13,300, at which point our small hedge will come off.
  2. NDX makes a new low. If NDX breaks 12,600, that would put us in the red count. This count has us in the final leg of the correction, with a potential bottom at 11,715 to 12,050. 

Regardless of what path NDX takes, we view this pullback as a buying opportunity and when the correction is complete we expect the uptrend to resume. We have been building key positions as we feel you can’t time the market and you most certainly can’t time a bottom.

There are many tools we use to guide our entries as well as risk management. One is the RSI, which I believe will be a key technical indicator to focus on based on the pattern in the daily chart. The trendline that was acting as support has become strong resistance. NDX needs to break back above the trendline before we can call this correction over. Furthermore, NDX has major support at the blue line. This was the final capitulation point for the March 2020 lows. If NDX reaches that level, we will take it as a strong buy signal. 

Disclaimer: Beth Kindig and the I/O Fund currently owns shares of TSLA. The content in this article is intended to be used for informational purposes only. The author has not received any compensation from any third party or company discussed in this article. The content is the expressed opinions of the author and is intended for educational and research purposes. Any thesis presented is not a guarantee of any particular stock’s future prices, so please factor this risk into your own analysis. It is very important that you do your own analysis before making any investments based on your personal circumstances. The author is not a licensed professional advisor. Please seek counsel form a licensed professional before acting on any analysis expressed in this article, to see if it is appropriate for your personal situation.


Posted in Broad Market Today, Market Trends, Tech StocksLeave a Comment on The importance of the NASDAQ100, and Levels to Watch

Market Update – March 19th, 2021

Posted on March 21, 2021June 30, 2026 by io-fund

Since the market topped on February 16th, the current correction is a very different experience depending on if one’s style of investing (value or growth). While the S&P500 only dipped 5.6% and is currently at new highs, the tech-heavy NASDAQ100 dipped 12% from peak to trough, and is still 7% from new highs. After value has underperformed for years, we are finally seeing a meaningful rotation out of tech and into beaten down value names.

The story on the rotation has to do with the quick rise in the US 10-year treasury yield. There are many reasons why bonds are being sold off, which inversely pushes up yields – inflation pressure has the bond market believing the FED will have to raise rates, which would likely stop this economic expansion. Also, the amount of fiscal debt written since the pandemic is creating a glut of supply, which the FED will likely not be able to fully absorb and this will put pressure on rates

Regardless, since many high growth stocks are projecting positive cash flow into the future, higher yields on longer duration bonds will affect future cash flows, causing a reset of current valuations. While the speed of the rise is unusual and unnerving to some investors, it is important to zoom out to gain some perspective on the recent move in yields.

As we can see above, the US 10-year treasury yield is still at historically low levels.  In the chart above, bear markets are highlighted in gray.  Going back to 1970, we have never seen a bear market begin with a US 10-year treasury yield below 3%.  Our current rate is around 1.75%. 

Further assurance comes directly from the Fed Chair, Jerome Powell, when he recently said the Fed expects to observe a momentary bump in inflation in March and April as the $1,400 stimulus checks shows up in economic data, but that they are not concerned about inflation rising above their 2.5% tolerance threshold.  If inflation start to rise more than expected, Fed officials believe they have the tools to control it. 

The Fed further claimed that they will be able to control inflation and has stated they will want to see maximum employment before changing their policy.  This suggests it could be at least 2023 before we see major policy changes from the Fed, which is in line with the timeline they have outwardly discussed.       

What’s Next?

With numerous microtrends in play, and recent earrings reports confirming or even raising future guidance, we view this correction in tech stocks as normal and temporary. We believe central banks are and will continue with an accommodative monetary policy for the foreseeable future.  Corrections in growth stocks are not uncommon or unusual, no matter how painful they may be.  A short-term price correction does not ultimately affect the underlying businesses of the stocks that we own.

In 2019, we saw a similar correction in tech growth. That year, the focus was on cloud pure plays, where the popular narrative at the time was stressing the overvalued cloud stocks as the neo-bubble stocks. While the S&P500 dipped 6.6%, and quickly recovered, many names like Twilio, Zoom, Fastly, Shopify, Okta, etc. saw corrections between 30-50%.

Our portfolio is geared towards taking advantage of powerful, long-lasting industry microtrends that will shape future generations.  It is therefore illogical to stress over daily price movements in these innovative companies.

Growth Vs. Value and the NASDAQ100

Since the current secular bull market began in March of 2009, there is not an extended period of time where value has outperformed growth. This has been a growth driven bull market, with tech leading the way.


Even since the March low in 2020, tech has continued this trend. After the pandemic shutdown, many tech names saw outsized growth due to ongoing microtrends, while others saw a bump due to a stay-at-home economy leaning heavier on tech for support. Many of the value names were hit exceptionally hard, further widening this gap. With valuations stretched in the tech sector, rates on the rise and the economy opening up, we are starting to see a real value rotation.


 As the chart above shows, the 14% Gap between Tech Growth and Value has nearly closed. In fact, while many growth names are down, much like the cloud names in 2019, value stock in the same timeframe are actually up.

We view this rotation as a positive sign for the overall market. We need all sectors participating in a bull market for it to remain healthy. Furthermore, we do not believe this market will continue with value leading the charge. There are simply to many exciting and profitable microtrends unfolding in tech, which we do not see ending anytime soon. Instead, we view this moment as an opportunity.

We have been focusing on the NASDAQ100 for several reasons. For one, it is predominantly tech focused. Also, it has been leading this bull market, and for the market to continue higher, we don’t see that being possible without the NASDAQ100. We really need it to join the other major indexes to new highs before we can count this correction as being over.

In short, if the NASDAQ100 can break above last Wednesday’s high at 13300, the probability increases that the low is in for this growth selloff. However, if we fail to break above this level, we could see another leg lower before we can write this correction off.

With the NASDAQ100 showing a negative RSI reversal signal, coupled with many charts we track whose current corrections appear to be incomplete, we may add hedges going into next week. We are 3% from the 13300 breakout, and about 10% from our downside target, if the NASDAQ100 cannot breakout above the 13300 region. This is the type of risk/reward we are willing to take for a hedge, if this final leg lower does unfold.

Relative Strength

Regardless, if we breakout and continue up, or need one final leg lower, we do not believe this bull market is over yet, and that this drawdown has provided some fantastic opportunities. In periods of market weakness, it is important to look at areas of strength. The future leaders tend to be stocks that go down less than their peers, bottom first, and lead out of a correction. That being said, the bounce off the March 5th low has provided some clues on where who might lead the next leg higher.

As the above chart shows, to lump all of tech into one category would be a mistake. Even though the S&P500 Tech Sector is showing poor relative strength in the chart above this year, as well as from the March 5th bottom, it’s important to identify what dominates that sector. Being a market cap weighted index, Apple and Microsoft makes up over 40% of the index, so it is heavily influenced by big tech.

If we dive into other microtrends within tech, there are a handful of sectors that are showing strong relative strength, even in light of the tech sell-off. What interests us are the sectors that are showing the most strength since the March 5th bottom.

Bitcoin/Crypto Currencies

The number one performer since March 5th is bitcoin/cryptos, and the businesses around this microtrend. Bitcoin is up over 58% YTD, and more notable is that it has continued its strength since the March 5th bottom. Bitcoin is our largest position, and though we are forecasting a bout of weakness in the near future, we do believe the uptrend will ultimately continue into 2022.

However, there are several businesses that benefit from the crypto market, such as Square, Silvergate Capital, eToro, Coinbase, Voyager Digital, just to name a few. We currently own Voyager Digital (VYGVF), which is a crypto exchange as well as a fintech company.

After being up over 500% YTD, we believe Voyager’s best days are ahead of it. It’s also the leader of the group just mentioned in terms of projected forward growth. If Voyager Digital continues with the revenue it already posted in February at $20 million per month, the valuation below will be cut in half.

China Tech and Green Energy

Another trend we have seen since the March 5th bounce is green tech and Chinese tech. In fact, they rank as the #2 and #3 micro sectors within tech since the March 5th bottom.

This falls in line with one of our favorite tends in 2021 – Chinese EVs. XPeng has been in a large downtrend, which we have thoroughly tracked and bought into along the way. Since the March 5th bottom, XPEV has bounced as much as 48%, showing outstanding relative strength. Nio has also bounced as much as 38% from the bottom. We used this bout of weakness in Nio to begin our position. Even if we do see another leg lower in the market, the reaction from March 5th further confirms the opportunity we see in the Chinese EV market in 2021, which we will continue to target. 

You can read Beth’s analysis on XPEV and NIO here and here.

OTT/CTV Ads

Finally, OTT/CTV Ads has also shown considerable relative strength since the March 5th bottom. Going into 2021, it was one of our biggest convictions and we allocated our portfolio accordingly. This micro sector has been considerably strong YTD, outperforming all major sectors in the broad market, short of beaten down energy stocks. It currently ranks #4 in terms of strength since the March 5th bottom, suggesting that this trend still has more room to run.  

We currently own Roku, Magnite, Fubo within this trend. Even after a considerable drawdown in these names, they are still showing outperformance against the NASDAQ100.

Stocks on our Radar that are Showing Solid Relative Strength

Two more stocks that made news from a relative strength perspective include UPST and VUZI.  UPST recently raised 2021 revenue guidance by over 50% and the stock roared higher, while VUZI stock also reacted very positively to its earnings beat. 

Conclusion

We do not believe that this is the end for tech leadership in the bull market. There simply too many important microtrends at play, and more about to go online. This rotation is healthy. We want as many stocks and sectors participating in the bull market, which is typically what we see going into the strongest leg of a bull market.

We believe this correction has provided a fantastic opportunity to buy shares of out-of-favor tech names, which we do not believe will stay out of favor for long. The relative strength in certain micro sectors is telling us what areas will likely lead into the next leg up, and we are pleased to see that they are lining up with Beth’s 2021 thesis so far.


Posted in Bitcoin, China Stocks, Crypto Investment, Ctv, Market Updates, Tech StocksLeave a Comment on Market Update – March 19th, 2021

Why We’re Skipping Coinbase and Prefer Voyager Digital: Overview of Crypto Trading 

Posted on March 17, 2021June 30, 2026 by io-fund
Why We’re Skipping Coinbase and Prefer Voyager Digital: Overview of Crypto Trading 

Voyager Digital is a smaller cap that gives investors exposure to the Bitcoin and crypto trading trend at a reasonable valuation. The company offers zero commissions and more coins than its competitors, including the rumored $100 billion market cap Coinbase that is going public soon, Kraken and Gemini. The stock is listed on the OTC market, which is higher risk than the Nasdaq as these stocks tend to be thinly traded.  

Voyager is a zero-commission competitor to Robinhood, and due to many PR mishaps, has opened a door for Voyager to become a replacement for customers who seek fewer politics around their crypto trading app.

Voyager also comes with the added benefit of offering 9% interest on stable coins as the company is a consortium for stable coins, including USD Coin (USDC) and Tether’s USDT, which have surpassed $7 billion in circulation.  As such, it provides exposure to decentralized coins like Bitcoin and stable coins based on the fiat system.

Although I am personally in favor of decentralized crypto and not stable coins, Big Tech and the Fed are likely to put immense pressure on adopting stable coins. Voyager allows investors exposure to both at a market cap of $2.18 billion, at time of writing. You can read my Facebook Libra article here where I am especially against this company entering the stable coin market.

Below we explain what makes Voyager a compelling investment, including what it does, how it makes money, valuation, catalysts, management, and potential risks.

Voyager: Zero Commissions, More Coins

As longtime crypto investors, we know all too well the issues around Coinbase and the other sites. The primary issue is the commissions that Coinbase charges, which are exorbitant to say the least. To make a $5000 trade on Coinbase, you will be charged about $80 in commissions. This isn’t competitive in an environment where stocks are traded at $0.

Voyager does not charge commissions on crypto trades and offers 9% interest on stable coins. One thing to note is that Voyager does not offer insurance like Gemini, and that our fund does not hold large amounts of crypto on trading platforms. Instead, we store crypto in cold storage wallets and use trading platforms for trading only. We discuss how Voyager makes money below, the differences in crypto platforms and how investors typically store their crypto below.

The fallout with Robinhood over GameStop has created an influx of customers for Voyager. Total revenue growth between December and February was over 1000% from $1.7 million to $20 million in monthly revenue.

Please note, my readers often ask me about the volatility of crypto and my answer to this is that crypto promises to be some of my most volatile investments. Stocks and crypto prices can drop 60% or more – and this has happened since my official coverage on bitcoin when it was priced at $12,000 and saw $4,000 before finding a base. You can read my past coverage here on Bitcoin in the summer of 2019.

Financial Overview

Although Coinbase was first to market, there is plenty of room for competitors to disrupt the company’s non-existent customer service and excessive commissions. For those who don’t trade crypto, you might be surprised to know that after paying such high fees, you are given no customer service whatsoever. The I/O Fund prefers Gemini as a commission-based platform as there is insurance offered to offset the cost of commissions.  

Voyager is FDIC-insured. However, the crypto held with Voyager is not insured. Gemini, which operates as a trust, has private insurance. Like us, crypto investors generally store their assets on a cold storage crypto wallet, which means it is not connected to the internet. In the event there is no insurance, the risk to cold storage wallets is minimal.

Significant Growth from Robinhood Tailwinds

Crypto investors are a tightknit community and we think word-of-mouth will grow nicely in this niche as it actively looks for new platforms. In December, the company reported $1.7 million in revenue and has grown to $8.5 million in January of 2021.

The company reported $2.5 million in revenue from Feb. 1 to Feb. 4—which we predicted could lead to $17 million in revenue in February. The company exceeded this and reported $20 million in revenue for February.

robinhood tailwinds growth rate data

Assets under management (AUM) grew from $230 million in December to $800 million by early February. Total assets under management by the end of February was $1.7 billion.

Trades per day averaged more than 30,000 for the month ending Jan. 31, up from approximately 6,500 in Dec. of 2020, representing 450% growth in daily trade volume. By early February, daily trades averaged 60,000 trades per day or nearly 1000% growth. In the March earnings report, the company reported a total of 70,000 trades in February.

In January, the value of customer trades increased over 500% to $840 million, up from $150 million in December of 2020. Over twelve months, the overall number of trades increased from 8,500 trades in December of 2019 to 1 million trades in January of 2021, an increase of 117,000%. This number may be irrelevant as most of this is priced in right now, yet we think it's important to look at the ongoing strength before the Robinhood issues.

Basic users grew from 150,000 in December to 440,000 by early February. The company reported 605,000 verified users at the end of February.

Here is the full statement from Steve Ehrlich, cofounder and CEO of Voyager, regarding the Robinhood catalyst and what investors can expect moving forward:

"While we believe our recent business metrics reflect the growing interest in the cryptocurrency ecosystem and long-term benefits of our business model, the unprecedented external events over the past week, including decisions made by competitive products, have brought significant upside to our metrics.

While we don't expect a repeat of the unprecedented external events of the past few weeks that have catalyzed the recent growth, we anticipate continued meaningful growth in our business, including from the pipeline of approximately 80,000 customers who have signed up and that we are presently onboarding.

We remain focused on executing our long-term business plan and expect Voyager will continue to grow the business in a more traditional pattern throughout the balance of 2021. To support this growth, we anticipate increased expenditures to materially increase our employee headcount during this period, while also growing our technology architecture stack in the near-term to accommodate significantly more users."

The company closed a private placement of $46 million on January 21st, 2021.

Voyager has seen 75%+ sequential quarter growth with increasing operating margins in 2020. Per the Investors Presentation, Voyager had a previous goal of reaching $20 billion AUM based on $500 million AUM as of Q1 2021 (this was achieved at nearly 3X the company’s original goal with currently $1.7 billion AUM). The company believes it can achieve 90% CAGR on number of funded accounts and 35% CAGR on average account size.

The company also states it takes $35 to acquire an account, and the company makes $30 per account in monthly revenue—which is excellent unit economics. Customer acquisition costs have averaged from $20 to low $30s per new account, according to Stifel Research.

In contrast, monthly revenue per account has accelerated from $40 per month at the calendar end of 2020 to $80 per month in C2021. A catalog of research reports are available from various funds and analysts covering the company, which is fairly extensive coverage considering the company's small market cap.

Voyager is a strong choice for alternative coins, as the app allows you to trade many tokens that Coinbase or Kraken does not support. For example, Voyager offers Dogecoin, a meme coin pushed by Elon Musk. It also offers interest on Bitcoin, Ethereum, Polkadot, and Chainlink.

Voyager sees its diversification across revenue streams as a way to minimize volatility. The revenue streams include listing fees, interest revenue, alternative coins and major coins.

Quarterly Financials
Voyager reported Fiscal Q2 2021 results March 1 for the period ending Dec. 31. The company had $3.56 million in revenue with $2.06 million in fees and interest income of $1.51 million. There was a net and comprehensive loss of $9 million.

Voyager expects to continue bringing new products to The Voyager platform, according to the report. In 2021 and beyond, executives anticipate adding debit cards, credit cards, stock trading, and the ability to trade on margin. Voyager will also look to grow internationally by expanding into Canada and Europe. 

Fiscal Q1 2021 results were reported on November 30th for the period ending September 30th. The company had $2 million with $1.6 million in fees and interest income of $400,000. There was a net and comprehensive loss of $3.97 million or ($0.04) EPS.

The company had cash and cash equivalents of $7.48 million and debt of $1.12 million at the last earnings report, which includes a PPP loan. There was an update for fiscal Q2 2021 on January 5th with quarterly revenue expected to reach $3.5 million.

Voyager also completed a private placement during the quarter, which increases gross proceeds raised during fiscal 2021 to C$13.8 million. It completed the acquisition of LGO, SAS, an AMF regulated entity that provides Voyager with a fully licensed European entity to accelerate its European strategy.

How does Voyager Make Money?
Voyager’s revenue is not dependent on commissions or fees. The company plans to introduce a debit card, credit card, margin, loans, and advisory products over the next year or so. Right now, the business model creates revenue in two specific ways:

1. Smart Order Routing: When you place an order to buy or sell a cryptocurrency, Voyager provides a listed price that you accept. It then connects your order to 12 exchanges. Unlike securities, which by law must have the same price across all domestic exchanges, cryptocurrencies are priced at variable levels. In other words, the same coin can be listed at two different prices at the exact same time.

Voyager uses your order to capitalize on this inefficiency by performing an arbitrage across various exchanges. The profits from such a move would typically surpass any commission or fee, allowing Voyager to provide exceptional pricing. Voyager will thus share the profits from this arbitrage with you in an attempt to execute your order at a lower price than you agreed to.

This business model will likely remain profitable until regulations change or there is too much competition in the arbitrage. Changes to the process would appear in the margins.

 2. Voyager operates like a bank. In their terms and conditions, Voyager very clearly states “We will lend, sell, pledge, rehypothecate, assign, invest, use, commingle or otherwise dispose of funds and cryptocurrency assets to counterparties, and we will use our commercial best efforts to prevent losses.”

 If you receive a loan from a bank, the loan is used by the bank as collateral for other investments. This creates multiple derivatives on a single asset. This is similar to Robinhood in that the users take on counterparty risk. Should Voyager become insolvent, you will need to stand in line behind other creditors to receive your money back.

 For taking on this risk, Voyager offers significant yield in a yield-starved economy. Like a bank, a minimal deposit must be kept to receive this interest payment, which can be as high as 9%. As part of this program, it may take up to 7 days for you to withdraw any crypto from your account. Voyager Digital is engaging in fractional lending practices, which banks have been doing for centuries.

 However, Voyager is not considered a bank or a broker-dealer. It does not provide FDIC or SPIC insurance for your cryptofor your crypto if there is a run on the bank, or if something occurs that would prevent them from meeting obligations. To conclude, FDIC insurance applies to the cash you hold at Voyager, but there is no insurance for the crypto held there. We discuss the differences in crypto trading platforms below.

Catalysts: Stablecoins and Global Expansion
Last March, Voyager acquired Circle Internet Financial’s trading app, which provided an additional 40,000 clients. The acquisition strengthens Voyager in offering the USDC stable coin that has $7 billion in circulation. Circle is backed by Goldman Sachs and is the founder of the consortium for USDC. The USDC coin allows global transfer of dollars at an instant and for a very low transaction cost.

The stable coin is part of a consortium that is also sponsored by Baidu, IDG Capital and Bitmain with participation on trading apps, such as Voyager and Coinbase. The supply of USDC has grown by 41% since the start of 2020. A recently announced acquisition of France-based digital asset exchange LGOUY expands Voyager Digital’s reach into Europe. Similarly, the firm is targeting to grow its footprint in Canada. We believe this global expansion should further boost Voyager's platform in terms of customers and revenue.

Valuation  

When we first covered Voyager on our premium site in January, the company was trading at a forward P/S of 100. We knew the revenue was growing substantially and the company would catch up to its valuation quickly. This is one reason that we think following people who understand tech growth is essential as Voyager is now reporting $20 million in revenue for the month of February alone. This places Voyager’s valuation at a forward P/S of 10 if we assume $200 million in revenue this year based off February and January numbers.

Compare this to Coinbase, a company expected to open at a $100 billion valuation, per a private auction as reported by Bloomberg. The company’s revenue in 2020 was $1.14 billion, up from $482 million in 2019 for 136% growth. If we generously assume similar growth in 2021, the revenue will be between $2.5 billion and $3 billion. Therefore, even if Coinbase can continue this high level of growth, the company will trade at a 30 forward P/S or higher.

Given these numbers and the likelihood Voyager will surprise to the upside from February’s revenue, we think the valuation on Voyager is more attractive at this time. This comes with risk as Voyager is on the thinly traded OTC markets. However, Coinbase is pursuing a direct listing and these have not performed well historically with both Spotify and Slack trading well below their opening DPO price for nearly two years after listing.

Coinbase has 2.8 million monthly transacting users and 43 million verified users. Assets under management are at $90 billion, per the S-1 filing.

Management

We personally do not see any red flags among management, which can often be the case in smaller cap companies.

CEO Stephen Ehrlich has experience running brokerages and financial companies. He was the CEO of E-Trade Professional Trading arm before it was bought by Lightspeed, and was then the CEO of Lightspeed Financial, CEO of PennTrade, and CEO of Tradier. Oscar Salazar is a Co-founder and he was early in Uber as the CTO.

The one issue that I do see is that they are involved in another company called Pager, a digital health startup. I prefer a founding team with one focus.

Major Differences in Crypto Trading Platforms plus Risks …

Since then, most major exchanges like Coinbase and Gemini have become custodians, which addresses the security risks. Coinbase, for example, keeps 98% of cryptocurrencies held in cold storage, where it is stored securely offline. The remaining 2%, which are held in hot storage, comes with insurance.

Gemini takes these security features a step further. Being classified as a trust, Gemini adheres to strict fiduciary capital reserve and cybersecurity standards by one of the toughest financial regulators, the New York Department of Financial Services.

The company also secured the SOC for Service Organizations Type 1 examination, which is typically reserved for the most stringently run financial services or technology firms. A SOC 2 review from an independent, third-party like Deloitte validates that Gemini is holding itself to high security, availability and confidentiality standards. Because of these additional measures, Gemini has become a favorite exchange/custodian for intuitional investors.

Voyager Digital was hacked as recently as December of 2020, but no customer data or assets were lost as the company shut down its systems when the vulnerability was detected.

As mentioned above, cryptocurrencies do not come with FDIC or SPIC insurance. FDIC protects depositors from banks becoming insolvent, providing guaranteed insurance of up to $250,000. The SPIC protects investors from a broker-dealer going bankrupt, providing insurance up to $500,000 in the unlikely occurrence of a broker-dealer becoming insolvent.

Counterparty risk is a reality for any crypto investor holding their coins at an exchange/custodian. If a custodian does not segregate coins and provide unique private keys that the company cannot access, the risk remains that an investor could lose a portion of their coins in the event of insolvency.

This happened to BitGrail in 2019, an Italian exchange. The courts declared that because all crypto deposits were directed towards the primary address of the exchange, and were not segregated, it was impossible to determine the coins' ownership. Thus, the remaining coins were used to pay off creditors, wiping out most of the individual investors using that exchange.

To be clear, we don't think this will happen with Voyager but are providing a 360-degree view of the risks. We think the crypto landscape has become much more secure since Mt. Gox and BitGrail, and these old stigmas prevent many investors from participating in this sweeping trend.

Coinbase, for example, clearly states that they do not segregate coins and control all private keys. In their terms and conditions, the company states that "Coinbase may use shared blockchain addresses, controlled by Coinbase, to hold Digital Currencies held on behalf of customers and/or held on behalf of Coinbase."

On the other hand, Gemini does segregate coins and states that not even the founders, CEO or president can access coins held in cold storage. They are further in the process of securing privately backed FDIC-like insurance for further protection and safeguards in the unlikely case of insolvency.

Please note, Voyager Digital is a thinly traded over-the-counter (OTC) stock. The OTC markets come with higher risk as there are no central brokers compared to stocks traded on the Nasdaq. As a small cap OTC stock tied to crypto moves, Voyager promises to be a roller-coaster ride.  

Conclusion

Coinbase also now has a competitor (Voyager) undercutting them on commissions and on the breadth of tokens. For most crypto investors, the process of holding tokens securely in cold storage is easy enough, and therefore, Voyager Digital is likely to be very popular despite the lack of insurance on crypto.

In our opinion, Voyager is a serious competitor to Coinbase – and most certainly to Robinhood. For our goals and desired gains in the I/O fund, we will take the 10 forward P/S on a company growing rapidly rather than an overpriced DPO at a much higher valuation.

Eventually, Voyager’s growth will settle but we think the value proposition of undercutting Coinbase on commissions will continue to help the app take market share in the word-of-mouth community of crypto traders.

Gemini does well for the high-dollar crypto investors, but this is not the same crowd as Voyager Digital. We see Voyager Digital as a competitor to Robinhood and Coinbase at an attractive market cap. We like the management and the diversification with stablecoins, as the Fed and Big Tech are likely to support stablecoins as time goes on. Therefore, Voyager offers exposure to both and has global expansion on the horizon.

Beth Kindig and the I/O Fund currently owns shares of Voyager. This is not financial advice. Please consult with your financial advisor in regards to any stocks you buy.

Follow me on Twitter. Check out my website or some of my other work here.Twitter. Check out my website or some of my other work here.

Posted in Bitcoin, Blockchain, Crypto Investment, Exchange, Finance, FinTech, Tech StocksLeave a Comment on Why We’re Skipping Coinbase and Prefer Voyager Digital: Overview of Crypto Trading 

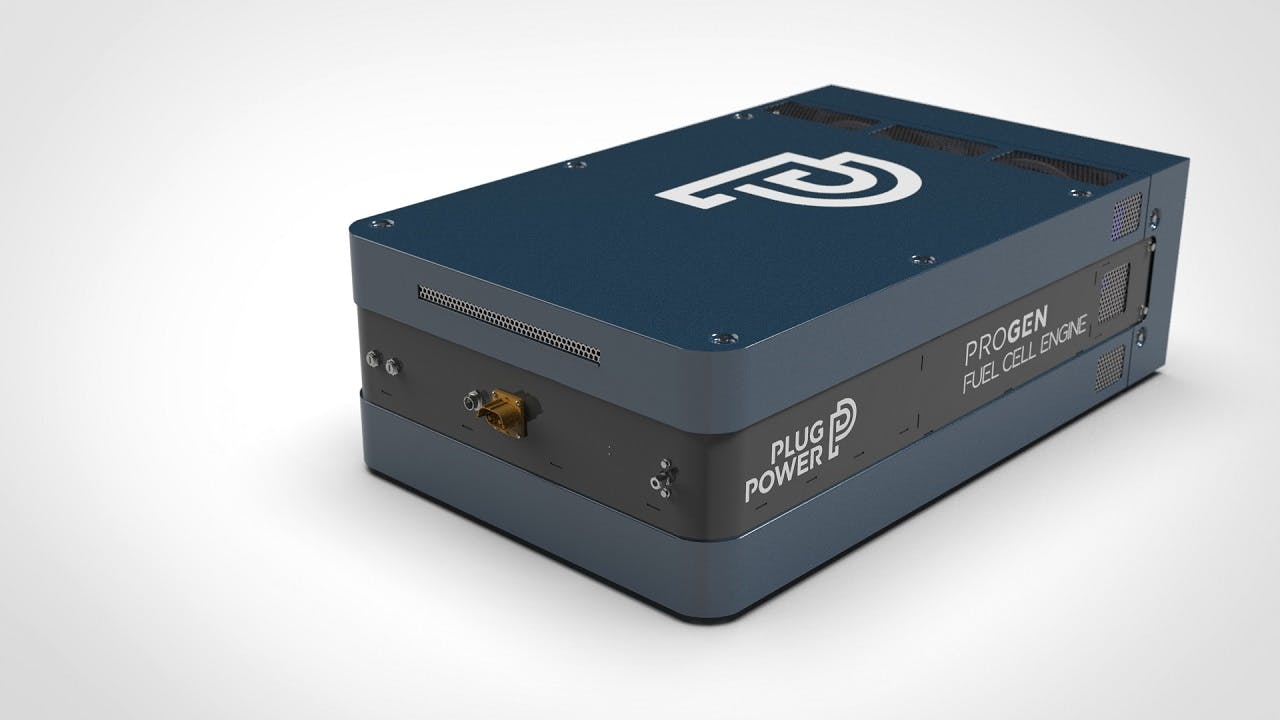
What’s Next for Plug Power?

Posted on March 11, 2021June 30, 2026 by io-fund
What’s Next for Plug Power?

With the Nasdaq still in correction territory, renewable energy star, Plug Power (PLUG), is more than 35% off the all-time high. This is after a large bounce off the recent $34 low.

When the stock made a new all-time high of $75 in late January, we started to get signals of a top forming. We warned our premium readers, and even provided downward price targets we would be looking to start a position. Our readers were skeptical when we suggested a short-term price target of $34 was on the table in a webinar. At the time, this level of correction seemed extreme, so we provided an upper target at $43 region. This price, based on our forward growth analysis, was a solid value.

As we hit the $34 region, we saw heavy buying. Based on the significance of this level from our analysis, we expect this level to hold on any retest in the near future. The excitement in renewable energy, plus the technical significance of the recent bottom, should put a floor at this level.

We see the move in Plug as a healthy pullback in a strong long-term uptrend. Plug is a key player in the global green energy trend. This coupled with how it has followed our outlined count, made us comfortable laying into the position on this pullback. The fact that we bottomed at the $34 region, so far, further confirms our long-term view.

We added to Plug at $43, and will look to add on any notable breakout.

Posted in Energy Stocks, Hydrogen, Tech StocksLeave a Comment on What’s Next for Plug Power?

Podcast with Motley Fool: I’m Bullish on These Trends for 2021

Posted on March 4, 2021June 30, 2026 by io-fund
Podcast with Motley Fool: I’m Bullish on These Trends for 2021

Recently I joined Tim Beyers and Brian Feroldi on The Motley Fool podcast. In the hour-long interview we discussed cloud stock valuations, trends I’m bullish on, why I think Zoom Video and Shopify are the best cloud stocks, my prediction that EVs would pullback (they later did) and why that’s a buying opportunity, and why I continue to be long FUBO due to the company being centered between two important microtrends albeit extremely early.

Here’s a brief summary of our conversation which occurred on February 9th prior to tech stocks selling off, and yet the information is even pertinent now. If you want to watch the full video, it is available below the article.

Cloud Valuations

Leading cloud stocks were trading at 50x sales when I was first interviewed by Motley Fool (minute 35:15 – 40:00). I emphasized that I don’t buy big positions in this range.

We also discussed the high likelihood that cloud stocks would soon revert to the mean of approximately 30x sales for leaders and 20x sales for average companies.

That’s exactly where we are at now, so I don’t see the sell-off as a big surprise. As I write this on March 4th – we are in the healthy pullback range as leaders often hit the forward 30 P/S range and average growth in cloud stocks the 20 forward P/S range.

cloud stocks forward p/s chart

What is unusual is the sheer number of cloud stocks forecasting growth in the range of 30% to 40%. We won’t know who is going to pull ahead of the pack until we see what Q1 reports due to the tougher comps from last year. 

cloud stocks q1 reports

Please note, data was pulled approximately two weeks ago.

In the past, momentum traders could pile cloud leaders growing in the range of 50% to 70% and make their bets that those forecasting top growth would perform. Nine times out of ten, the company met its forward guidance. This year we don’t have that luxury as the category faces harder comps.

Towards the end of the interview, I was asked my favorite cloud stocks for 2021. I said it was easy to get creative here but I prefer to stick to the tried and true during years where the market doubts a tech vertical. I named Shopify and Zoom Video as my favorites as their bottom lines are exceptional and on par with Salesforce. This is one way to tell if a company has product-market fit, as they do not need to use sales and marketing budgets to drive growth. 

Cloud stocks are going to test momentum investors who don’t study underlying fundamentals. Our fund is 2/3 long-term buy and hold and 1/3 momentum and we continue to hold cloud stocks in our buy and hold portfolio. 

How I Find Stocks  
Instead of using stock screeners, I like to invest in mega trends. It’s more forgiving for the companies. Companies positioned at the center of powerful trends can pivot or change the business model and the outsized demand will overlook those mistakes.

That’s why I prefer to invest in trends rather than use screeners. Tech needs to be forgiving, because growth tech companies are trying to take over the world.

I need a big trend so I don’t lose conviction if there’s a bad earnings report or other short-term issue. Investing in trends helps me to stay patient while the management executes.

SPACs:

We chatted about SPACs prior to the selloff in this interview and I had said “proceed with caution” yet look for gems. The way we do this is by investing very small percentages in speculative names – as low as 0.5%. From there, we layer either as the company breaks out on strength OR we layer in at lower prices if we have a higher-than-usual conviction.

Here’s a breakdown as to our strategy, which is spearheaded by Knox Ridley, our research site’s portfolio manager.

  • Early trend, 1%. These trends haven’t showed up yet in earnings.
  • Some Evidence, 2% to 3%. We see some evidence for these trends in earnings.
  • Overwhelming Evidence, 5%. These trends have overwhelming evidence in earnings.

The Bull Case for Fubo

FuboTV is centered in a crucial trend, which is live sports streaming. The bear argument on Fubo is that licensing fees are too high for the company to improve margins and become profitable. This is negated by the Sportsbook launch which is coming much sooner than I originally thought. My best guess is we will see institutions initiate prior to the Olympics yet before the Sportsbook launch.

Comcast has announced a 9% stake in Fubo and Disney has a 5% stake in the company. They will want to run sports betting through a separate brand as these are family-friendly entities.

Sports are seasonal and Q1 should not be compared to Q4, yet the bears will attempt to hammer on this. At our fund, we do not compare Pinterest’s Q4 to its Q1, for example, as we understand that smart money does not do this either.

In the interview, the point I make is that live sports OTT is the holy grail as the majority of cable subscribers continue their subscriptions for this purpose. In fact, all of the cord-cutting leading up to this point (about 10-15 years) is equal to the cord-cutting opportunity of live sports fans. We do not see Fubo as a sports licensing business just as I did not see Roku as a hardware business. You can access my previous analysis on Fubo here and a library of analysis on Roku here.

Instead, Fubo is a live sports OTT business that will drive monetization through its Sportsbook. Subscribers are willing to pay $65 per month for Fubo because it offers access to a wider range of live sports.

Fubo announced last January that it plans to offer sports betting in a separate app, which is a model that worked for Sky Media in the U.K. While you’re watching live sports, you can open a separate app and make a bet with your friends. This is ideal for casual betting rather than serious gambling. With many states in debt and legalizing sports betting, this is a tailwind.

You could say, “Why don’t you go with DraftKings?” Fubo has the same size audience that DraftKings did in 2019. Yet, the valuation of DraftKings is 3-4 times higher than Fubo and fully valued. I also think Fubo will do well with casual betting compared to DraftKings.

Chinese Electric Vehicles:

The interview from February 9th was especially timely in regards to EVs as I had said they were trading at historic valuations and could see a 30-40% haircut. We like this trend so much that we started to layer in around the time of the interview and as the market has sold off, we’ve continued to build our exposure to Chinese EVs.

I’m bullish on Chinese EV companies due to China’s desire to reduce its dependence on foreign oil. The country does not produce oil like we do in the United States.

Another reason I like Chinese EVs is because nationalist China will probably want its domestic car companies to be in the top three for sales. Apple is number 4 or 5 in China for smartphones (depending on the quarter). I wouldn’t be surprised to see Tesla to follow the same path as Apple in terms of ranking in China. This is important because China’s lack of oil plus its population is a nice combination.

The I/O Fund is invested in high quality leaders of the most important tech microtrends. When we enter or exit a stock for the I/O Fund, premium subscribers receive alerts by email and text, plus regular in-depth analysis from technology analyst Beth Kindig.    

Want to know more? To receive in-depth analysis on popular technology stocks, and alerts for key entries and exits, subscribe at research.beth.technology.research.beth.technology.

Access the full interview here: 

Interview timestamps:

0:00 Introduction

1:33 Cloud valuations

5:00 Okta and Alteryx

6:45 Research Process: How I invest in major tech trends  

9:00 AR/VR Trend: Unity, Apple, Snapchat

18:00 SPACs

21:40 Opendoor

22:40 Star Peak Energy Transition Corp.

26:30 Cloud earnings

28:00 Portfolio Management: When to enter and exit

30:15 Entries: Roku, Magnite

32:00 Exits: Alteryx, Dynatrace

37:50 Fastly, Cloudflare

43:20 FuboTV

49:10 Agora.io

50:15 Chinese EV: NIO, Xpeng, Li Auto

53:30 Favorite cloud stocks: Shopify and Zoom

Posted in Podcasts, Tech Stocks, WebinarsLeave a Comment on Podcast with Motley Fool: I’m Bullish on These Trends for 2021

What’s Next for Tesla? Levels to Watch.

Posted on March 4, 2021June 30, 2026 by io-fund
What’s Next for Tesla? Levels to Watch.

With the NASDAQ100 down about 10%, the current bull market’s darling, Tesla, is down about 27%. Even after a 500% increase over the past year, we believe the current correction will provide a great opportunity to participate in this real trend, which we see accelerating in 2021.

The price data with Tesla suggests that a pullback to the $500-$495 region is on the table. This would provide the most ideal entry, and if we do see a drawdown to this level, expect heavy buying. We realize this would be a sizable drawdown; however, a correction to this level would confirm that our current long-term target of $1400 would be on track.

However, it’s worth pointing out that several momentum indicators/oscillators are currently at levels that have indicated significant market bottoms. For this reason, we may look to layer into a position in the $630s if we receive a series of buy signals.

We would position Tesla as a momentum play that we would likely sell if we approach our upside targets. This is not the stock we would be comfortable holding once we enter a bigger selloff, so we will lean heavier on technical analysis to both manage risk, and take gains.

View Webinar Here:

Disclosure: Beth Kindig currently owns shares of TSLA. This is not financial advice. Please consult with your financial advisor in regards to any stocks you buy.

Posted in Electric Vehicles, Energy Stocks, Tech StocksLeave a Comment on What’s Next for Tesla? Levels to Watch.

Q4 Earnings Analysis for Shopify, Roku, Fiverr And Palantir

Posted on March 4, 2021June 30, 2026 by io-fund
Q4 Earnings Analysis for Shopify, Roku, Fiverr And Palantir

In my latest Forbes article, I cover the 2020 Q4 earnings for Shopify, Roku, Fiverr and Palantir. More importantly, we explain why tech stocks have been selling off recently despite some healthy earnings reports.

We discuss key points in the earnings reports from leading e-commerce software company Shopify (NYSE:SHOP), a company that’s not sitting stagnant by any means. We review Shopify’s product road map and how the company continually innovates to maintain its lead. The company grew revenue 94% YoY to $978M, topping consensus estimates by $64M (7%). Adjusted EPS of $1.58 beat estimates by $0.37.

We also discuss Roku (NASDAQ:ROKU) and why CEO Anthony Wood does not believe his industry has seen a pull forward from COVID-19 but rather a structural shift that benefits AVOD and programmatic CTV ads long term. In my previous analysis on Forbes, I had pointed out that Roku’s true market is pay-TV advertisers (rather than cord cutters). This was echoed on the recent call (nearly verbatim). Management also explained why Peacock and HBO are not truly competitors but rather increase the pool of customers for Roku.

Moreover, driven by strong advertiser demand, Roku beat on revenue and earnings when it announced Q4 results Feb. 18 with 58% growth year-over-year and guided for 51% growth for Q1 2021.

Fiverr (NYSE:FVRR) is a stock that has seen phenomenal gains of more than 800%. We review this company’s growth potential as a gig economy leader with the recent launch of its subscription service. The online freelance marketplace platform beat on revenue and earnings as it closed out a breakthrough quarter in the company’s history.

Lastly, we talk about Palantir (NYSE:PLTR). The company is guiding for 30% growth over the next five years which didn’t match its valuation going into earnings. Under the hood, the commercial accounts growth was a paltry 4% although perhaps the recent partnership with IBM (NYSE:IBM) will help strengthen the commercial customer base.

Palantir also announced Q4 results Feb. 16. Revenue grew 40% YoY to $322M, beating consensus estimates by $21.02M. Net loss of ($0.08) per share missed estimates of ($0.02), according to Bloomberg, despite the net loss improving from ($0.29) per share for the same period last year.

Read the Full Article at Forbes

Posted in Broad Market Today, Earning Updates, Tech StocksLeave a Comment on Q4 Earnings Analysis for Shopify, Roku, Fiverr And Palantir

Pinterest and Snap Show V-Shaped Recovery; Cloudflare Guns for Zero-Trust

Posted on February 16, 2021June 30, 2026 by io-fund
Pinterest and Snap Show V-Shaped Recovery; Cloudflare Guns for Zero-Trust

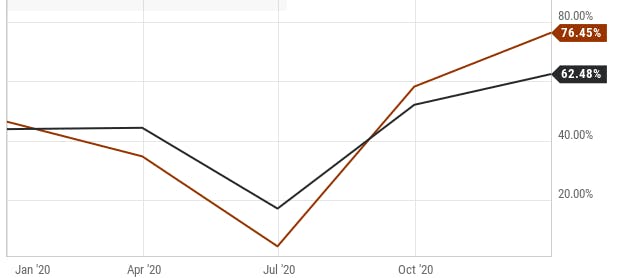
2020 earnings from ad-tech stocks have shown us that digital advertising has rebounded sharply from the pandemic recession lows.  Pinterest’s growth rate dropped to 4% YoY in Q2 but has since rebounded to +77% in Q4.  SNAP’s growth rate bottomed at 17% in Q2 and has recovered to +62% in Q4. 

In total, global digital advertising spend grew less than 5% in 2020 but is expected to accelerate with 17% YoY growth in 2021 as we head into a higher GDP environment.

Global digital ad spend now makes up 52% of all ad spend, the first year it has eclipsed over 50% share.  Over the next 4 years, global digital ad spend is expected to grow 61% from its current total and will exceed 60% of all advertising dollars.  The industry growth we are expecting to see will provide a powerful tailwind for digital ad stocks.  Pinterest and Snap have proven to be two of the industry’s leaders, with both companies announcing record results in Q4. 

Pinterest

Pinterest reported Q4 results on February 5th, beating estimates on both the top and bottom lines.  Revenue of $706M (+77% YoY) came in 9% above the consensus projection of $647M.  Adjusted EPS of $0.43 exceeded the street estimate of $0.33 while adjusted EBITDA of $299M far outpaced estimates calling for $226M. 

The company announced that Global Monthly Active Users (MAUs) grew 37% YoY to 459M vs. 450M consensus, US MAUs were 98mm vs. 97M consensus, and International MAUs were 361M vs 360M consensus. 

Management also indicated that it is expecting revenue to grow in the low 70% range YoY for the March quarter.

In its Q4 earnings call, Pinterest CFO, Todd Morgenfeld, attributed the strong Q4 to the investments the company has made in technology and the expansion of their sales coverage:

“Over the last year, we’ve invested in our ability to better deliver returns [through] accountable performance advertising, including scaling, conversion optimization, ads, shopping, ads, and building improved automation to help advertisers of all sizes more easily onboard and realize the value of being on Pinterest…We also expanded our sales team in Western Europe to monetize our engagement there.”  One of the standouts from the company’s Q4 results is the international growth they saw.  Pinterest grew international revenue 146% YoY, international MAUs 79% YoY, and international ARPU 67% YoY.  All three metrics represent record results for Pinterest.   

On the technology front, Pinterest has created value for advertisers through the onboarding of catalogs and automation tools to make spending on the platform easier. The investments Pinterest has made in improving their technology to deliver more value to advertisers paid off with record numbers in Q4. 

Management’s commentary and guidance indicate that they expect this momentum to continue in Q1: “we expect positive trends from our investments in ad tools like shopping and automation, and sales coverage expansion to continue. We plan to expand our international coverage further in existing geographies, and also expand monetization into Latin America in the first half of the year.” 

Recently, Microsoft attempted to buy Pinterest according to news sources. At $51 billion, Pinterest is twice the valuation of LinkedIN at the time of acquisition. Last year, Microsoft put in a bid for Tiktok.

Snap

Snap announced Q4 results on February 5th, topping consensus estimates on both the top and bottom lines although guidance for next quarter came in under expectations on adjusted EBITDA. 

In Q4, revenue grew 62% YoY to $911M, topping Wall Street’s estimate of $855M by 7%. 

Adjusted EPS of $0.09 beat by $0.02 while adjusted EBITDA of $166M comfortably exceeded expectations calling for $142M. 

Global daily active users (DAUs) rose 22% YoY to 265M, surpassing expectations for 258M. Daily active users exceeded expectations across all geographies, including North America, Europe and ROWS.

For Q1, Snap sees revenue of $730M at the midpoint and adjusted EBITDA of -$60M. The adjusted EBITDA guidance came as a surprise as analysts were expecting positive EBITDA for Q1.  Still, -$60M would be an improvement over -$81M in Q1 2020.    

In its Q4 earnings call, Snap CFO Jeremi Gorman discussed the rebound the company observed after Q2: “in Q3 and Q4, we saw many existing advertisers return to Snap and so many new ones leverage our innovative ad formats and bidding capabilities to drive real business value on our platform. This drove active advertisers to an all-time high.” 

Snap currently has an average of 200 million people engaging with AR on Snapchat every day. The company noted that they will continue to invest heavily in AR to create new cutting-edge tools and capabilities that allow advertisers to reach their audience in new ways.

Snap believes there is tremendous value in giving advertisers the ability to engage with their audience directly via the camera.  Management disclosed that businesses leveraging AR as one component of a larger multi-product campaign on Snapchat tend to achieve stronger results. 

Another key area for investment moving forward for Snap is video advertising and the growth of Spotlight: “We see more opportunity over time to grow video inventory particularly via the growth in viewership of Spotlight and Stories.” This is the primary way Snap monetizes its users, but the company believes there will be even more opportunity here in the future. 

Snap has invested in content to support the launch of spotlight and plans to continue to make this a focus area moving forward.  These investment areas are the main reason for Snap’s adjusted EBITDA target coming in below consensus. 

Snap management tempered expectations for 2021 when discussing how the iOS platform policy changes could affect their business: “We anticipate that the iOS platform policy changes to be implemented later this quarter will present another risk of interruption to demand in the period immediately after they are implemented. It is not clear yet what the longer-term impact of those changes may be for the top-line momentum of our business, and this may not be clear until several months or more after the changes are implemented.”

Snap showed tremendous growth in Q4 and continues to be a key tool for advertisers that are trying to reach a younger audience. On average, DAUs opened the app 30 times a day in the fourth quarter with an average of over 5 billion snaps created each day.  CEO Evan Spiegel indicated that he expects Snap to accelerate its full year growth rate in 2021 to above the 46% number the company recorded in 2020. 

Cloudflare

Cloudflare (NET) announced Q4 earnings results on February 11th.  Adjusted EPS of ($0.02) beat consensus estimates by $0.02 while adjusted operating margin of (7.9%) improved 1.7% on a YoY basis.  Revenue of $126M grew 50% YoY, topping consensus expectations by $7.6M. 

Gross margin declined slightly on a YoY basis to 77.6% from 78.2% a year ago.  Management attributed this decline to the fact that they did not raise prices because they did not want their customers to end up with a surprise bill during the pandemic.  FCF was negative $23.5M, representing a FCF margin of (18.7%).    

For Q1, Cloudflare sees $130.5M in revenue at the midpoint, coming in above the $126.2M consensus. Loss per share is expected between $0.02-0.03 vs. the $0.03 loss estimate. Full year 2021 guidance also topped analyst estimates with management expecting revenue of $591M versus a $561M consensus. On the bottom line, Cloudflare is expecting a loss per share of $0.08-0.09 for the FY21 versus the $0.09 loss estimate.   

Q4 was a strong quarter for Cloudflare despite the initial 6% decline in the stock on Friday following the announcement of these results. NET shares were up 20% YTD coming into the earnings report, creating a potential profit-taking scenario following Q4 results. 

CEO Matthew Prince highlighted the company’s growth in paying customers accounts and large customer accounts in Cloudflare’s Q4 earnings call: “Our paying customer accounts grew to over 111,000, up 10% quarter-over-quarter and our strongest quarterly growth in several years.

Large customers, those that spend over a hundred thousand dollars per year with us, continue to be our strongest growth area adding 92 new customers in Q4 and bringing our total large customer account to 828. Revenue from these large customers increased sequentially to 49%, up from 47% in Q3 as our sales team continues to close larger and larger enterprise accounts.” 

Cloudflare announced that their Dollar-based net retention of 119% improved 3% sequentially, driven by continued strength from large enterprise customers. Management attributes the growth in large enterprise customers to the company’s expanded product portfolio.

The company has launched a number of products and features that are important to customers, including its zero-trust network security solution, Cloudflare 1, and Magic Transit. CEO Matthew Prince believes Cloudflare’s zero trust solution is the best in the industry, noting that Cloudflare “is the only company with a zero-trust solution that really understands and is built for the needs of developers”.  Cloudflare’s mission is to provide value for developers in a way that other companies do not. 

Cloudflare management highlighted a few significant customers wins in Q4.  They attributed these customer wins to the platform’s ease of use, technical innovation, and the way multiple products fit together into a unified solution. CEO Matthew Prince believes his company is on the path to more significant customer wins in the future: “Developers are the future of IT and having won their trust we expect will help us win, retain and expand more and more customers over time.”    

Looking ahead, Cloudflare management believes the strong business momentum they observed in Q4 will continue into Q1 and throughout 2021.  The company raised its outlook on both these numbers.  Management noted that in 2020 companies were simply trying to survive. 

In 2021, management believes there will be a big shift from a traditional hardware-based security approach to a much more modern zero trust approach.  The company is confident that Cloudflare will be one of the leaders in enabling companies to make that transition. 

Posted in Applications, AR, Consumer, Tech StocksLeave a Comment on Pinterest and Snap Show V-Shaped Recovery; Cloudflare Guns for Zero-Trust

Why SPACs are (Sometimes) Better than IPOs

Posted on February 4, 2021June 30, 2026 by io-fund
Why SPACs are (Sometimes) Better than IPOs

SPACs offer retail investors the ability to invest early in a company’s life cycle. In the case of Snowflake, a company that went public via a traditional IPO, retail investors did not have this opportunity. By the time Snowflake debuted on the public markets, the share price had soared over 200% from its indicated opening price.

Many pundits and analysts have claimed that the IPO process is broken due to examples like Snowflake and AirBnb. Wall Street institutions and a select group of their top clients can buy shares at discounted prices before they hit the open market.

SPACs allow investors the ability to buy equity in companies going public before the initial price surge. This allows retail investors to participate in some of the same opportunities that have traditionally gone to institutional investors and preferred brokerage clients.     

Why would a company want to go public via a SPAC?  One of the main reasons is that SPACs provide companies with fast cash and the ability to bypass the regulatory hurdles of a traditional IPO.  SPACs allow companies to get to the public markets a lot quicker.  Many of the SPACs we are currently seeing are still pre-revenue or have very little revenue and are mostly unprofitable.  SPACs are ideal for companies that want to get to the public markets as quickly as possible and not have to deal with a long, drawn-out traditional IPO process.

This also happens to be one of the main risks as these are mostly newer, unprofitable companies with not a lot of revenue.  The SPAC method of going public may entice companies in need of fast cash because their financial situation is not fit for a traditional IPO.

SPACs had a bad reputation in the past because the industry was not as regulated and therefore open to more fraud.  In the 1990’s, SPACs would take small companies that were destined to fail public for a large fee. The SEC, however, has cracked down on it, and the regulation on SPACs has undoubtedly ramped up. Many more companies are now exploring alternative methods to going public and SPACs have been a key beneficiary.

Source: Bank of America

The SPAC route gained notable popularity among companies in the 2nd half of 2020 and has continued its torrid pace into 2021.  We are currently on pace to see over $200B in US SPAC capital raised in 2021, representing well over 100% growth year-over-year.

What are SPACs?

SPACs are special purpose acquisition companies, sometimes called blank check companies, formed to raise capital to acquire an existing company and bring them public.  They are traditionally formed by investors with expertise in a certain industry, who are looking to pursue deals in that industry.  The SPAC management team can be a value add for the target company over traditional IPOs as they can partner with an experienced leadership team for guidance.

After a SPAC raises money for its potential acquisition, the funds are placed in an interest-bearing trust account.  The SPAC company then enters a timeline where they look to make a deal.  Once that deal is complete and approved, the SPAC combines with the business they are merging with and starts trading publicly under a new ticker.  If the SPAC fails to acquire a business by the closing date, and the shareholders do not grant an extension, the shares are redeemed for a portion of the cash in the trust account and returned to the shareholders.

In the IPO, a SPAC typically offers units to investors for $10.00 per unit.  These IPOs usually take place at a net asset value of $10.00, although there are some exceptions. 

The bottom line for investors is that SPACs are an increasingly popular method for companies to reach the public markets.  SPACs do not come without risks, but they represent an area of the market that growth investors can no longer ignore.  In some cases, there are notable opportunities for investors to buy equity in promising young companies.    

Posted in Broad Market Today, Market Trends, Tech StocksLeave a Comment on Why SPACs are (Sometimes) Better than IPOs

Posts navigation

Older posts
Newer posts

Recent Posts

  • The IPO Glut of 2020: Why Valuations Have Gone Too Far
  • Zoom Discusses Two Important Catalysts In Q1 Earnings
  • Three Risk Management Tools the I/O Fund Offers
  • Micron Is Up 900%. Here’s Why the AI Memory Trade May Still Have Room to Run
  • Credo: Reliability Leader Aggressively Moves into Optics

Recent Comments

No comments to show.

Archives

  • June 2026
  • May 2026
  • April 2026
  • March 2026
  • February 2026
  • January 2026
  • December 2025
  • November 2025
  • October 2025
  • September 2025
  • August 2025
  • July 2025
  • June 2025
  • May 2025
  • April 2025
  • March 2025
  • February 2025
  • January 2025
  • December 2024
  • November 2024
  • October 2024
  • September 2024
  • August 2024
  • July 2024
  • June 2024
  • May 2024
  • April 2024
  • March 2024
  • February 2024
  • January 2024
  • December 2023
  • November 2023
  • October 2023
  • September 2023
  • August 2023
  • July 2023
  • June 2023
  • May 2023
  • April 2023
  • March 2023
  • February 2023
  • January 2023
  • December 2022
  • November 2022
  • October 2022
  • September 2022
  • August 2022
  • July 2022
  • June 2022
  • May 2022
  • April 2022
  • March 2022
  • February 2022
  • January 2022
  • December 2021
  • November 2021
  • October 2021
  • September 2021
  • August 2021
  • July 2021
  • June 2021
  • May 2021
  • April 2021
  • March 2021
  • February 2021
  • January 2021
  • December 2020
  • November 2020
  • October 2020
  • September 2020
  • August 2020
  • July 2020
  • June 2020
  • May 2020
  • April 2020
  • March 2020
  • February 2020
  • January 2020
  • December 2019
  • November 2019
  • October 2019
  • September 2019
  • August 2019
  • July 2019
  • June 2019
  • May 2019
  • April 2019
  • March 2019
  • February 2019
  • January 2019
  • December 2018
  • November 2018
  • October 2018
  • September 2018
  • August 2018
  • July 2018
  • June 2018
  • May 2018
  • April 2018
  • February 2018
  • January 2018

Categories

  • 5G
  • About
  • Accounting Tips
  • AdTech
  • Ai Platforms
  • Ai Platforms
  • Ai Platforms
  • Ai Platforms
  • Ai Platforms
  • Ai Platforms
  • Ai Platforms
  • Ai Platforms
  • Ai Platforms
  • Ai Platforms
  • Ai Platforms
  • Ai Platforms
  • Ai Platforms
  • Ai Platforms
  • Ai Platforms
  • Ai Platforms
  • AI Stocks
  • AI Stocks
  • Analysts
  • Application Monitoring
  • Application Monitoring
  • Applications
  • Applications
  • Applications
  • Applications
  • Applications
  • Applications
  • Applications
  • AR
  • Audit Reports
  • Autonomous Vehicles
  • Autonomous Vehicles
  • Autonomous Vehicles
  • Autonomous Vehicles
  • Autonomous Vehicles
  • Autonomous Vehicles
  • Autonomous Vehicles
  • Avod
  • Avod
  • Battery Charging
  • Bear Market
  • Bitcoin
  • Bitcoin
  • Bitcoin
  • Bitcoin
  • Bitcoin
  • Bitcoin
  • Bitcoin
  • Blockchain
  • Blockchain
  • Blockchain
  • Blockchain
  • Blockchain
  • Blockchain
  • Blockchain
  • Broad Market Today
  • Bull Market
  • Bull Market
  • Chainlink
  • Chainlink
  • Chainlink
  • Chainlink
  • China Stocks
  • Cloud
  • Cloud Infrastructure
  • Cloud Infrastructure
  • Cloud Infrastructure
  • Cloud Infrastructure
  • Cloud Infrastructure
  • Cloud Infrastructure
  • Cloud Infrastructure
  • Cloud Platforms
  • Cloud Platforms
  • Cloud Software
  • Cloud Software
  • Cloud Software
  • Cloud Software
  • Cloud Software
  • Cloud Software
  • Cloud Technology
  • Company
  • Company
  • Console Gaming
  • Console Gaming
  • Console Gaming
  • Consumer
  • Consumer
  • Consumer
  • Consumer
  • Consumer
  • Consumer
  • Consumer
  • Consumer
  • Consumer
  • Consumer
  • Consumer
  • Consumer
  • Consumer
  • Consumer
  • Consumer Tech
  • Corrections
  • Crypto Investment
  • Ctv
  • Ctv
  • Ctv
  • Ctv
  • Ctv
  • Ctv
  • Ctv
  • Ctv
  • Ctv
  • Ctv
  • Cybersecurity
  • Cybersecurity
  • Cybersecurity
  • Cybersecurity
  • Cybersecurity
  • Cybersecurity
  • Cybersecurity
  • Cybersecurity
  • Cybersecurity
  • Cybersecurity
  • Cybersecurity
  • Cybersecurity
  • Data
  • Data Analytics
  • Data Analytics
  • Data Analytics
  • Data Center
  • Data Center
  • Data Center
  • Data Center
  • Data Center
  • Data Center
  • Data Center
  • Data Center
  • Data Center
  • Data Center
  • Data Center
  • Data Center
  • Data Center
  • Data Center
  • Data Center
  • Data Center and Processing
  • Data Warehousing
  • Data Warehousing
  • Data Warehousing
  • Data Warehousing
  • Databases
  • Databases
  • Databases
  • Databases
  • Dating
  • Defi
  • Digital Ads
  • Digital Ads
  • Digital Ads
  • Digital Ads
  • Digital Ads
  • Digital Ads
  • Digital Ads
  • Digital Ads
  • Digital Ads
  • Digital Ads
  • Digital Ads
  • Digital Ads
  • Digital Ads
  • Digital Ads
  • E-Commerce
  • Earning Updates
  • Earning Updates
  • Earning Updates
  • Earning Updates
  • Earning Updates
  • Earnings Report
  • Earnings Report
  • Earnings Report
  • Earnings Report
  • Earnings Report
  • Earnings Report
  • Earnings Report
  • Earnings Report
  • ECommerce
  • Electric Vehicles
  • Electric Vehicles
  • Electric Vehicles
  • Electric Vehicles
  • Electric Vehicles
  • Electric Vehicles
  • Electric Vehicles
  • Energy Stocks
  • Enterprise
  • Enterprise
  • Enterprise
  • Enterprise
  • Enterprise
  • Enterprise
  • Enterprise
  • Enterprise
  • Enterprise
  • Ethereum
  • Events1
  • Events1
  • Exchange
  • Faq
  • Finance
  • Financial Analysis
  • Financial Analysis
  • Financial Analysis
  • Financial Analysis
  • Financial Analysis
  • Financial Analysis
  • Financial Analysis
  • Financial Analysis
  • Financial Analysis
  • Financial Analysis
  • Financial Analysis
  • Financial Analysis
  • Financial Markets
  • FinTech
  • Fundamental Analysis
  • Gambling
  • Gaming
  • Genomics
  • Glossary
  • Green Energy
  • Growth Stocks
  • Growth Stocks
  • Growth Stocks
  • Headsets
  • Headsets
  • Health Tech
  • Hydrogen
  • Identity
  • Identity
  • Identity
  • Inflation
  • Inflation
  • Inflation
  • Internet of Things
  • Interviews
  • Interviews
  • Interviews
  • Interviews
  • Investing
  • Investing
  • Ltbh
  • Ltbh
  • Ltbh
  • Ltbh
  • Ltbh
  • Macro Trends
  • Macro Trends
  • Market Trends
  • Market Trends
  • Market Trends
  • Market Trends
  • Market Trends
  • Market Trends
  • Market Trends
  • Market Updates
  • Market Updates
  • Market Updates
  • Market Updates
  • Market Updates
  • Market Updates
  • Market Updates
  • Market Updates
  • Market Updates
  • Market Updates
  • Media
  • Membership
  • Mining
  • Mobile
  • Mobile
  • Mobile
  • Mobile
  • Mobile Gaming
  • Mobile Gaming
  • Mobile Gaming
  • Multimedia
  • Music Streaming
  • NVDA | NVIDIA Corporation
  • Performance Updates
  • Pin Content
  • Podcasts
  • Podcasts
  • Podcasts
  • Portfolio
  • Premium Research
  • Press Releases
  • Press Releases
  • Productivity
  • Productivity
  • Productivity
  • Productivity
  • Productivity
  • Productivity
  • Productivity
  • Reports and Whitepapers
  • Research Services Preview
  • Resources
  • Resources
  • Semiconductor Stocks
  • Semiconductors
  • Semiconductors
  • Semiconductors
  • Semiconductors
  • Semiconductors
  • Semiconductors
  • Semiconductors
  • Semiconductors
  • Semiconductors
  • Semiconductors
  • Semiconductors
  • Semiconductors
  • Semiconductors
  • Social Media
  • Social Media
  • Social Media
  • Social Media
  • Social Media
  • Social Media
  • Social Media
  • Software
  • Software
  • Software
  • Software
  • Software
  • Software
  • Software
  • Software
  • Software
  • Software
  • Software
  • Software
  • Software
  • Software
  • Software
  • Solar
  • Solar
  • Stock Analysis PDFs
  • Stock Updates
  • Stock Updates (Blogs)
  • Supplychain
  • Supplychain
  • Supplychain
  • Supplychain
  • Supplychain
  • Supplychain
  • Svod
  • Svod
  • Svod
  • Svod
  • Svod
  • Svod
  • Tech Podcast
  • Tech Stock News
  • Tech Stock News
  • Tech Stock News
  • Tech Stock News
  • Tech Stock News
  • Tech Stocks
  • Tech Stocks
  • Tech Stocks
  • Tech Stocks
  • Tech Stocks
  • Tech Stocks
  • Tech Stocks
  • Tech Stocks
  • Tech Stocks
  • Tech Stocks
  • Tech Stocks
  • Tech Stocks
  • Tech Stocks
  • Tech Stocks
  • Technical Analysis
  • Telehealth
  • Telehealth
  • Telehealth
  • Telehealth
  • Testing Equipment
  • Testing Equipment
  • Top Tech Stock News
  • Travel
  • Trends Report
  • Tutorials
  • Uncategorized
  • Updates
  • Updates
  • Updates
  • Video
  • Video
  • Video
  • Video
  • Video Footage
  • VR
  • Webinar Alerts
  • Webinar Alerts
  • Webinars
Proudly powered by WordPress | Theme: iofund by iofund.co.uk.