Skip to content
Logo-main-white.860316a8

I/O Fund

  • Home
  • Free Stock Analysis
  • AI Stocks
  • BEST OF 2025
  • Analysts
  • Nvidia Hub
  • About
    • Case Studies
    • About Us
    • Premium Services
    • Pricing
    • Notable Wins
    • I/O Fund Reviews
    • Media
  • Contact Us

Category: Consumer Tech

The path to profitability for Uber and Lyft looks more like a dead end

Posted on September 20, 2019June 30, 2026 by io-fund
The path to profitability for Uber and Lyft looks more like a dead end

The ride-sharing companies are subsidizing rides and overspending on technology, and soon their very business model may be upended in California.

Ride-share company earnings prove that if you lower the bar to the ground, it’s easy to leap over.

Uber UBER, -1.28%  and Lyft LYFT, +1.42%  each reported staggering losses recently, yet the reports were delivered with positive spins.

Lyft released “record second-quarter results” while losing roughly the same amount of money as in previous years. Lyft’s improving loss guidance was meant to look attractive at $850 million to $875 million per year, compared with the $1.15 billion-$1.175 billion previously forecast. But that amount is higher than in both 2016 and 2017.

Uber had an epic $5 billion quarterly loss, which is about $1.3 billion when adjusted for certain items. In what universe does a company with a $58 billion market cap report any losses at all, let alone what’s projected to be $4 billion for a full year.

Below, I look beyond the earnings reports to review a few of the systemic issues that affect Uber and Lyft. It’s important to look for the cause of the losses.

1. Ride subsidies destroy potential profits

The S-1 filings disclosed a risk that overshadows the path to profitability for both companies. An excerpt from Lyft’s S-1 filing says:

“We grow our business by attracting new riders to our platform and increasing their usage of our platform over time. … We also offer incentives for first-time riders to try Lyft, as well as incentives for existing drivers and riders to refer new riders. … We often also provide incentives to existing riders to encourage them to expand their use of our platform. If we fail to continue to attract riders to our platform and grow our rider base, expand riders’ usage of our platform over time or increase our share of riders’ transportation spend, our results of operations would be harmed.”

In 2017, Reuters published that Uber passengers pay only 41% of the actual cost of their trips, citing research from transportation consultant Hubert Horan. At the time, Reuters warned that this creates an “artificial signal about the size of the market” after Uber had released limited financial data as a private company that showed losses of $708 million per quarter. Four years later, with a $1.3 billion quarterly loss, there’s no evidence anything has changed.

The problem with subsidizing rides is that investors aren’t able to determine what would be required for profitability, how much the cost of a ride would have to increase to cover expenses, and if increasing prices would negatively affect demand. Therefore, the real-world revenue is unknown, and the losses reflect the effects of subsidies.

2. Business model under threat in California

Lyft and Uber have scaled their companies, but it comes with the variable cost of human labor. Ideally, you want fixed costs for R&D on platforms, software, hardware and other products to create the margins that technology is known for.

Lyft and Uber are mobile applications, but the business model is more of a large-cap human-resources department with many variables around wages, and now, regulations due to independent contractor classifications.

The systemic issue is that the mobile app holds very little intellectual property, with the primary value of the product resting in the mobilization of a massive workforce of nearly 1.9 million people, per Lyft’s S-1 filing, and 3.9 million drivers with Uber. We know there isn’t intellectual property in ride sharing, as there are many such companies globally: China’s Didi, Singapore’s Grab, India’s Ola, Europe’s Bolt (previously Taxify) and MyTaxiApp, and Dubai’s Careem (which is being bought by Uber).

Therefore, the value of the companies is in the workforce, not the technology. This also happens to be the biggest risk.

Uber and Lyft face legislation in California that may require them to reclassify independent contractors as employees. The ride-share companies maintain they are exempt from the law, which is set to go into effect in January. That could lead to a statewide ballot initiative in 2020.

It’s a stretch to think California taxpayers would side with Uber and Lyft. California is especially burdened by workers who make less than minimum wage in a state with high living costs. The lack of health care, and Social Security and tax withholdings from a workforce the size of Uber’s and Lyft’s means costs must be absorbed by taxpayers. Meanwhile, hundreds of Uber and Lyft drivers have organized protests in the state, which doesn’t help for voter sentiment.

Most importantly, these companies have no profits to absorb a change in the business model, such as being required to pay minimum wage or health care. Uber is offering $21 per hour as a compromise, instead of facing the overhead of becoming an employer, but it’s unclear how much Uber pays per hour now to calculate the impact. This would also set a precedent for workers in other states, who might pursue a similar arrangement.

On the one hand, the companies are subsidizing rides up to 60% to lure customers, and on the other, workers are protesting. That is not a good formula.

3. Autonomous vehicles are farther away than they appear

This leads us to the only hope for ride sharing to become profitable: To remove the human driver through autonomous vehicles (AV). Over a year ago, I wrote that regulation hurdles between levels 2 and 3, and delayed deployments, will put immense pressure on stocks that are overvalued based on AV speculation.

For background, we are at Level 2 for commercial purposes. Audi was set to be the first company to release a Level 3 system, which was denied by regulators in early 2019. To remove the driver, we will need to be at Level 4 or Level 5. (See this article for AV levels.)

ABI Research, an advisory firm that reports on market-foresight trends, predicts 8 million consumer vehicles with Level 3 to Level 5 autonomy will ship in 2025. Compare this to the 94.5 million vehicles sold in 2017, which equates to 8.5% of sales.

This is a small and fairly insignificant percentage of market share to be chasing six years ahead of deployment. Yet, headlines are a continual churn of autonomous vehicle “moments” — every partnership, every mile driven, every make and model that adds another feature. The headlines don’t make it clear we are not able to commercially release Level 3 AV right now — and that includes Tesla TSLA, +1.28%  and Google’s GOOG, +0.51% GOOGL, +0.49%  Waymo.

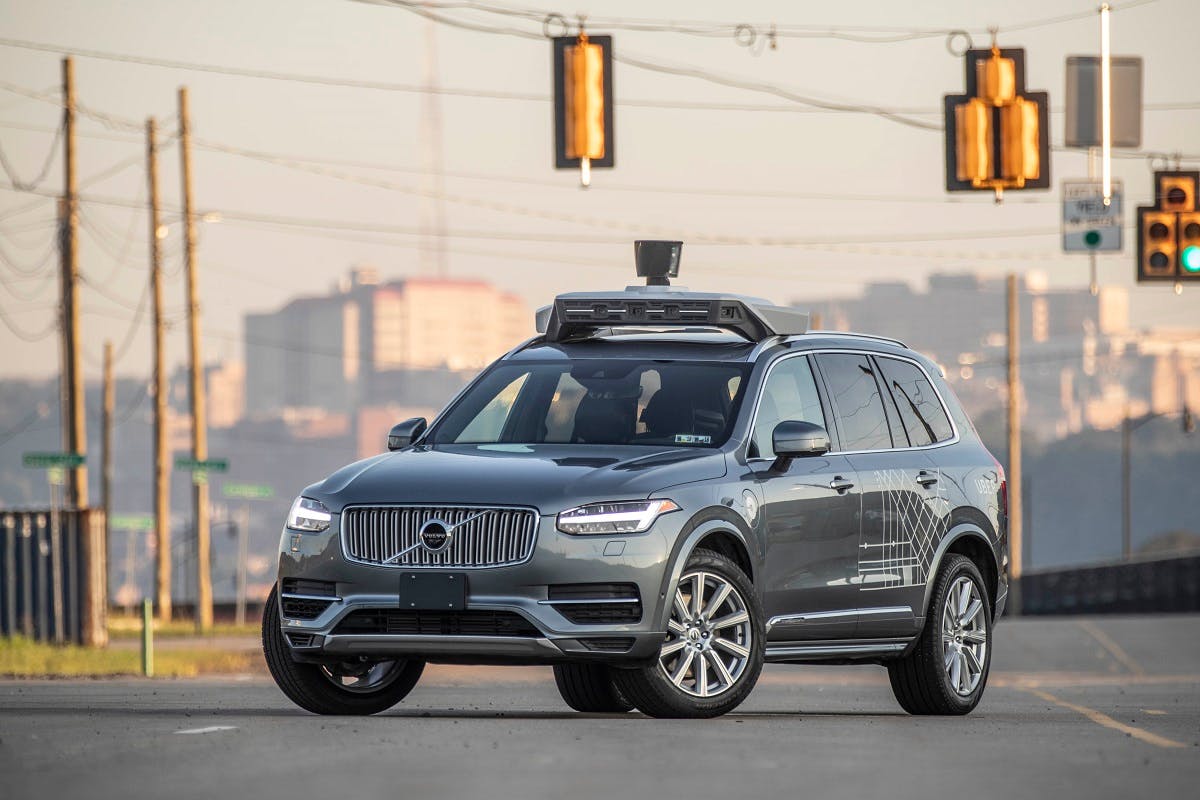
It’s surprising Uber and Lyft would attempt to fund autonomous vehicles. After all, they’re not high-tech companies with robotics and artificial-intelligence experience. They certainly don’t have the reserves to fund R&D, as Google/Waymo do, or the talent to compete with AV specialists that have been working on this problem for over a decade, such as Torc Robotics, which works with industrial systems for companies including Caterpillar CAT, -0.72%  and Daimler Trucks.

Keep in mind, Tim Cook of Apple AAPL, -0.81% has called autonomous systems one of the most difficult AI projects to work on. Ideally, there is a successful, core business funding autonomous R&D — as Google has operated at a loss on its AV projects for a long time. Instead, Uber is losing $1.3 billion from the core business, yet has the resources to  pursue flying taxis.

From an investment perspective, the better bet is a successful core business that can absorb the R&D on other projects.

4. Uber lockup expiration is looming

In July, Lyft’s stock was trading at $67. After the Aug. 19 lockup expiration, in which early investors could sell their shares, it’s now at $48.

Early investors have lost a lot of money on Lyft, whose shares traded at $79 the day the company went public. On March 14, I warned my readers two weeks in advance of the IPO that these weak fundamentals and product-market-fit issues were insurmountable, even when Wall Street analysts predicted the stock would reach $100.

My next warning is the Uber IPO lockup, which expires the first week of November. While I don’t expect an immediate dump on day one of the lockup expiring, there should be a noticeable unwinding in the months that follow. This is a possibility for all IPOs, even ones with solid financials. So one can only imagine what might happen to a large-cap stock that’s losing $4 billion per year while potentially facing deeper losses from California legislation.

This article appeared on MarketWatch September 20th, 2019.MarketWatch September 20th, 2019.
Posted in Consumer Tech, Tech Stocks, TravelLeave a Comment on The path to profitability for Uber and Lyft looks more like a dead end

Uber and Lyft: Unprofitable Powerhouses

Posted on August 9, 2019June 30, 2026 by io-fund
Uber and Lyft: Unprofitable Powerhouses

Ride-share earnings this week proved that if you lower the bar to the ground, any earnings performance can leap over it. Both companies reported staggering losses that were delivered with positive PR spins. 

Lyft reported “record second quarter results” while losing roughly the same amount of money as previous years. Uber had an epic $5 billion loss that is closer to $1.3 billion adjusted. The second number only looks acceptable in the parallel universe where a $65 billion market cap company can report any losses at all, let alone $4 billion per year. 

Likewise, Lyft looks digestible compared to its counterpart at $850M in losses, until you realize these numbers haven’t improved since 2016 when the company reported negative net losses of $692M and net losses of $708M in 2017. There is an improvement from 2018, but again, this depends on how you spin it. To me, it’s cut and dry – Investable companies should have fewer losses as they grow revenue. There may be quarters where a company moves backwards, maybe due to capex or another legitimate reason, but the revenue growth in ridesharing creates losses due to subsidizing, and this is a holistic problem that is not going away. 

The market found it encouraging that Lyft was expected to lose $1.1B but has revised this to $850M for 2019. Profit margins are negative 23%versus negative 37.7%. The price was adjusted for the $200M improvement, which during after-hours resulted in a 11% spike. The spike soon settled when Lyft announced they are moving up the lock-up period from late September to August 19th. 

We see evidence of the holistic problem where Lyft’s losses will marginally improve this year compared to last year. There is no evidence, however, that this is sustainable. If Lyft needs to support R&D on autonomous driving, for instance, then the margins will be deep in the red once again. An important metric to watch is the EBIT margin of -77% compared to -61% a year ago.

Uber’s Q2 resultsare more straight forward to analyze. Adjusted EBITDA was negative 292M in the year-ago period compared to negative 656M in the current period for an increase of 125%. Keep in mind, Uber Eats and Uber Freight help offset the losses. 

As I stated in MarketWatch, I’m not a fan of the price war narrative. Increases in revenue per users is irrelevant if the losses are also accelerating or stagnant. This means the subsidization of rides continues to drive demand, and if both companies raise prices, they will also have more losses. The end of a price war sounds like a PR spin to me and we see no evidence in the financials that this will do anything for profitability.

There are also many other unknowns in how demand will react to higher priced supply. Gross bookings may decrease as people decide to drive to a destination, park at the airport for $8 per day, or hire a regular taxi who is already waiting outside many venues. Also, Uber may pull ahead of Lyft if prices go up as the service has more drivers readily available and is a larger brand. 

I’ve written extensively about these companies and expressed why my readers should steer clear ahead of the IPOs during the exuberant market of April 2019. I highly recommend anyone who wants to invest in the ride-sharing story to consider the liquidity the lock-up expirations will create with more shares flooding the market.  

I won’t repeat everything here, but below are a few bullet points from my previous analysis published March 14th, 2019 – one month before Lyft went public. I’ve also included links to my previous analysis on Uber – both before and after the company went public.

  • Lyft and Uber pay incentives to acquire and retain users. In gaming, a company might spend $8 to acquire a user with a lifetime value of $15 per user for a profit of $7. The problem with ride-sharing apps is that the incentives offered do not cover the costs of the ride, and that is one reason we see strong sales growth mired by substantial net losses.
  • Reuters has some historic information on this dated back to 2015, when Uber passengers paid only 41 percent of the actual cost of their trips. At the time, Reuters reported that this creates an “artificial signal about the size of the market” with Uber releasing limited financial data that showed losses of $708 million per quarter.
  • Lyft and Uber are mobile applications, but the business model is more of a large-cap human resources department with many variables around wages, and potentially regulations due to independent contractor classifications. (There was a recent $20 million settlement due to the misclassification of drivers in California).
  • A paramount risk to both Uber and Lyft is total addressable market. Room for geographic expansion is limited beyond the United States, other than a few outlier countries like Saudi Arabia. Of course, the underlying issue with TAM is a lack of intellectual property with an easy-to-duplicate mobile application that leverages common app features such as GPS location and SMS/voice. For a list of competitors, reference “Lyft: Risky Valuation and No Intellectual Property”

My premium subscribers received a 12-page report on Roku And TTD prior to earnings, Snap prior to earnings and tech trade war plays to hedge their portfolios. Premium researchPremium research members receive updated recommendations and entry/exit scenarios on tech stocks. Learn more hereLearn more here. 

For additional information on Uber: 

Uber IPO: Record-Breaking for All the Wrong ReasonsUber Stock Had Disappointing Q1 Earnings: So Why Did the Price Go Up?

Posted in Consumer Tech, Financial Markets, TravelLeave a Comment on Uber and Lyft: Unprofitable Powerhouses

Lyft and Uber Update: August 7th

Posted on August 7, 2019June 30, 2026 by io-fund

SimilarWeb provided a glimpse into Lyft’s driver daily active users in Q2 2019. The report revealed a decline of 18% in Q2 ahead of earnings today. The data does not account for riders; however, it does require caution as fewer daily drivers is likely to trickle down to less revenue.

Lyft is a native application only and does not operate a website. Native app data from companies like SimilarWeb tends to be accurate in this case. I’ve seen some data not translate if the company also has website traffic, such as Pinterest or Facebook.

Install penetration YoY has also slowed, according to SimilarWeb.

SimilarWeb has access to more data than they publicly disclosed to Yahoo – likely for liability purposes. The company has visibility into app rank and rider daily active users, as well. Therefore, a leak to Yahoo Finance from an unbiased third-party that directly precedes earnings is something I tend to take seriously. SimilarWeb’s business model is to sell data to investors. There is no guarantee Lyft will miss earnings today, however, SimilarWeb will see a material impact either positively or negatively if the data they release is seen as accurate.

Quick Notes on Uber:

  • Arianna Huffington and Matt Cohler stepped down from board positions – not common this soon following an IPO
  • Uber laid off 400 employees in marketing, or about 1/3 of the team, which was announced at the end of July

According to MarketWatch, Uber is expected to report losses of $3 billion this quarter due to stock-based compensation from its IPO. Lyft is expected to report losses of half a billion dollars. Fundamentally, this is unprecedented for a company at the $65 billion market cap level. If either company pulls off earnings this quarter,  I don't think the rebound will last long.

My original analysis on these two companies was during the euphoria of April 2019 when the market was confident Lyft and Uber would perform well. I wrote an analysis that went against the bullish sentiment before Lyft dropped 20% following the IPO and before Uber became the worst IPO performance in history. The issues that I pointed out still remain:

  • Subsidizing of Rides: Venture capital is typically used for product development and for human capital to help the company scale. In a rare twist of startup mechanics, venture capital for these two companies was used to drive market demand by using the capital to lower the price of the ride-share. The result is artificial supply and demand, and it’s uncertain what demand will be when the ride is no longer subsidized with venture money. This should have been solved prior to going public and prior to the companies reaching balloon-sized valuations.
  • The lockup expires in November and I agree with the theory that Uber and Lyft are liquidity events. Look for the true valuation of these companies in the two years following the lock-up period. While I do not expect an immediate dump, there will be a noticeable unwinding as more shares become available, and the stock price undergoes dilution. If you want to bet on these companies long term for autonomous vehicles or another thesis, then you will have much better opportunities for entry after the six-month lock-up period. (I am personally betting against these companies into Q1 and Q2 2020).

You can access my previous analysis on the public blog:

https://beth.technology/lyft-risky-intellectual-property/

https://beth.technology/uber-ipo/

https://beth.technology/uber-stock/


Posted in Consumer Tech, Stock Updates (Blogs), TravelLeave a Comment on Lyft and Uber Update: August 7th

Will Facebook Cryptocurrency Have A Long-Term Impact?

Posted on June 18, 2019June 30, 2026 by io-fund
Will Facebook Cryptocurrency Have A Long-Term Impact?

Facebook has been clobbered by privacy issues for nearly 16 months now. A pivot into cryptocurrency could help save the social media giants market cap while making good use of the platform’s 2.3 billion users. The main issue for investors is the short-term risks with privacy and data may not outweigh the long-term opportunities with crypto this year.

Background on Facebook’s Cryptocurrency:

News has been circulating for some time about Facebook’s cryptocurrency venture with news officially breaking on Friday that Facebook has signed a consortium of firms known as the Libra Association to govern Facebook’s cryptocurrency. The list of names joining is impressive, as reported by the Wall Street Journal to include Paypal, Stripe, Visa and Mastercard. Rumor has it that more names will be revealed today, including venture firms Andreessen Horowitz, Union Square Ventures, cryptocurrency exchange Coinbase, and a few non-profits such as MercyCorp.

Here is the full list set to be announced on June 18th:

Facebook’s-Cryptocurrency-Background

source: The Block

According to an introductory blog post that will be published this week, Libra will be built on the Libra Blockchain, which is a “secure, stable, and reliable blockchain” and backed by Libra Reserve, “a reserve of real assets” that will provide the cryptocurrency with “stability, low inflation, global acceptance and fungibility.”

The coin will be traded on Messenger and Whatsapp, which helps solve the mystery of how Facebook plans to monetize the app that was acquired for $19 billion many years ago. To compete with payment applications, the cryptocurrency transfers will have zero fees and Facebook is currently working with merchants to accept the token. According to The Information, Facebook has plans to roll-out ATMs to exchange traditional assets for cryptocurrency.

To avoid Big Tech anti-trust issues, which is becoming a buzz-phrase this year, Facebook created the independent foundation to oversee the cryptocurrency. Each company paid $10 million to operate a node that validates the transactions, which will help decentralize the global currency.

Facebook Cryptocurrency: More Questions Than Answers

Facebook and Google frequently attempt to pivot from advertising with more failure than success. Google calls these “Other Bets” with “bet” being an appropriate word as user adoption for massive tech companies is always challenging to predict. Psychologically, these companies do not hold as much power as investors may think as acquisitions have always been the better path rather than launching products (Facebook: Instagram and Whatsapp vs. dating, for instance, or Android and YouTube for Google vs. Google Glass, for instance). 

While it may seem the names of the Libra Association are partners, they are more likely to be paying $10 million to remain diversified and to have a stake if Facebook pulls off crypto. As in most things tech related, it will ultimately be up to the user adoption rate of the technology.

Despite the bump in price the stock has seen this past week, there will likely be a lull mid-year for the stock as privacy wears on and crypto is too nascent to have a serious impact on the financials.

Here are some Long-Term Risks to Facebook’s Cryptocurrency:

  1. Bank accounts are not tied to Messenger or Whatsapp, therefore there will be friction in the transfers and setting up crypto wallets.
  2. Messaging apps like Venmo transfer money without fees already and is linked to bank accounts. In other words, payment applications may be a better fit for crypto transfers.
  3. Many thought leaders in tech and those inclined to support disruption are adamantly against the Facebook platform and began the #deleteFacebook campaign. This group uses Signal for messages. Are power Facebook users and Whatsapp users disruptive enough to drive crypto adoption?
  4. Amazon already accepts payments while Apple is moving into financial services. Facebook’s direct leap into crypto could have psychological barriers for users who have not used Facebook for a payment of any kind. Notably, Jack Dorsey of Square is also hiring a crypto team.
  5. Cryptocurrency is heavily regulated by foreign governments, and in some cases is illegal. With Facebook showing signs of saturation domestically in the United States, the company will have to rely on foreign governments legalizing the coin and allowing Facebook to be a crypto player in their country. I see this as a major headwind as currency brings up more regulatory issues than what tech has dealt with previously.
  6. Facebook is known for being used for election tampering and there is bipartisan support to regulate the social network. Globally, Facebook has been used by terrorist groups. Therefore, the platform could be especially prone to fraud and laundering compared to Amazon, Apple or a pure-play crypto option.
  7. Facebook would need to be regulated closely like a financial institution which would change how the company collects and uses data. Gramm-Leach-Bliley Act is a good example of a regulation that tightens the use of data for companies that are involved in financial transactions. 

This month, I will be attending the Bitcoin 2019 Conference in San Francisco. Follow me for updates.


Posted in Consumer Tech, Crypto Investment, Social MediaLeave a Comment on Will Facebook Cryptocurrency Have A Long-Term Impact?

Uber Stock Had Disappointing Q1 Earnings: So Why Did the Price Go Up?

Posted on June 13, 2019June 30, 2026 by io-fund
Uber Stock Had Disappointing Q1 Earnings: So Why Did the Price Go Up?

Uber’s CEO, Dara Khosrowshahi, is blaming timing and the trade war for the stock’s poor performance in its public market debut rather than focusing on the company’s unprofitability. When Uber filed to go public, the S-1 filing showed a massive operating loss of $3 billion per year. The most recent earnings report on May 30th showed the losses are getting worse at $1 billion per quarter for the “deeply unprofitable” company. Revenue is slowing down with growth of 20 percent to $3.1 billion in the most recent quarter compared to 25 percent revenue in the year-prior quarter. This was Uber’s slowest growth since it began disclosing results in 2017.

Meanwhile, Uber stock has received a unanimous buy rating from financial analysts and many positive press headlines. This analysis will look closer as to why the current stock price does not reflect the clear evidence of diminished value as of the Q1 earnings report.

Uber Stock: Prospectus and S-1 Filing

If you’ve read my previous analysis on Uber’s IPO and Lyft’s IPO, then you can skip this section on the prospectus and S-1 filing. Notably, I provided accurate predictions on both of these public offerings before the market knew how the companies would perform – and I was very clear on the risks around these two stocks prior to Lyft dropping 20% from its IPO price and Uber stock becoming the worst IPO performance in history.

My newsletter subscribers get this information first. Sign up My newsletter subscribers get this information first. Sign up here.

In years prior, Uber’s prospectus points towards “an accumulated deficit of $7.8 billion” in the years ending December 31, 2017 and 2018. In 2017, Uber posted $4 billion in operating loss and negative $2.6 billion in adjusted EBITDA with losses of about $3 billion in 2018. This upcoming year of 2019, Uber is on track to reverse backwards on operating losses to the $4 billion mark with no improvement in profitability despite demanding a large cap valuation.

Notably, for anyone glancing over the prospectus, Uber sold some operations in Russia and Asia, which provided one-time income, and caused the company to post $1 billion in net income. This is why net income should be ignored when looking at the financials as it does not reflect the operating income or adjusted EBITDA.

Uber’s Core Platform Contribution Margin also worsened, dropping from negative 3% in Q4 2018 to negative 4.5% in Q1 2019 (most recent quarter not shown on the graph below).

Uber states that the reason the Core Platform Contribution Margin goes through periods of decline is due to competition in ridesharing. As my previous analysis pointed out, Uber has to subsidize rides in order to drive demand. This causes artificial supply and is the primary risk for investors.

Uber Eats is mentioned often in earnings reports and in the press. To be clear, Uber Eats only contributed $165 million in adjusted net revenue in Q4 2018 compared to ride sharing at $2.3 billion in adjusted net revenue; which again, the ridesharing is what places the profitability in question.

Evidence That Uber Stock Price is Too High

The primary risk of the ride-sharing business cannot be offset by new ventures, although the company has attempted to offset these losses by lumping users from Uber Eats and Uber Freight into a “platform.” These native apps are not a platform; this is a loophole to hide the numbers on ride-sharing as Uber Eats likely has a healthy user base, totaling $7 billion in sales annually.

Uber and Lyft subsidize rides which is why revenue grows and losses accelerate. The more business these companies do, the more money they lose. We do not know the true cost of ride-sharing as customers are not paying fair market value, and instead venture capital dollars are providing a cheaper ride than what supply and demand dictates. This is essential to understanding the metrics pictured below.

Mobile applications typically break down a few key metrics for investors to analyze. Uber does not offer monthly active users or daily active users. The company focuses on gross bookings, which is at a staggering $50 billion gross bookings annually, although this does not address why there are also staggering losses.

Data can easily be presented in favorable terms, and therefore, more than one source is recommended when drawing conclusions. In February, Adam Blacker of Apptopia, a provider of app intelligence, wrote a blog on various modes of transportation and estimated “decreases in active usage for Uber and Lyft, while seeing increases in public transportation.” The article goes on to state “From January 2018 to January 2019, Uber and Lyft lost a combined 1.2 million average DAUs in the United States.”

The majority of the DAU loss would have come from Uber due to the relative size of the company compared to Lyft, therefore, we can generously assume Uber lost 600,000 DAU, or about half the amount Apptopia reported. According to other sources, Uber completes about 14 million trips per day, so losing 600,000 DAUs is substantial as it represents a minimum loss of about 5% (this percentage of DAU likely higher as not all 14 million trips come from DAUs).

Former Uber growth marketer, Andrew Chen, has pointed out that DAU and MAU for Uber is not a meaningful number as infrequent airport rides are a strong driver of revenue growth, for instance, and these users are not reflected in DAU or MAU.  However, when looking at past DAU compared to current DAU, this is a very meaningful number as it shows us relative churn and retention.

Uber Stock Lock-up Expires in November – Mark Your Calendar

If the S-1 numbers show massive losses of $3 billion and the Q1 earnings reports even worse losses of $1 billion per quarter, then why is Uber stock trading higher? My theory is that just like bitcoin, Uber has whales keeping the price steady until the lockup period expires. Before either ride-sharing company went public, I emphasized both IPOs would be liquidity events and to be especially cautious of the press, as PR is a cheap expense to protect the $60 billion that has been sunk into this startup. 

When Uber’s lock-up expires in November, the true valuation of Uber will surface in the months that follow. It can take up to two years for a public offering to settle after the lock-up period. While I do not expect an immediate dump on day one of the lock-up expiring in November, I believe there will be a noticeable unwinding in the months that follow. As more shares become available, the stock price will undergo dilution. If you think I’m wrong about the overall fundamentals, and you want to invest in Uber and Lyft, I would urge you to wait beyond the lock-up.

Check out my analysis on Zoom published prior to the IPO, where I called it the Best Silicon Valley IPO of the Year.

Posted in Consumer Tech, Financial Markets, TravelLeave a Comment on Uber Stock Had Disappointing Q1 Earnings: So Why Did the Price Go Up?

Uber IPO: Record-Breaking For All the Wrong Reasons

Posted on May 9, 2019June 30, 2026 by io-fund
Uber IPO: Record-Breaking For All the Wrong Reasons

By now, investors know that Lyft’s ride-sharing IPO didn’t reach $100 per share like many of the media talking heads stated it would, and this will likely weigh on Uber’s IPO. Two weeks prior to Lyft’s IPO, I had warned that the risk listed in the prospectus, which warned Lyft may not become profitable, was more than fine print. Ride-sharing companies use investment money to lower the cost of the ride to create demand, which means the ride you take in a Lyft or Uber is not profitable, and will likely never be profitable.

Not one analyst rated Lyft as a sell going into earnings despite earnings estimates that called for accelerating net losses from negative $3.16 EPS to negative $3.97 EPS. Going into earnings this week, twelve analysts had rated Lyft as a buy compared to eight who rated it as a hold (What is wrong with these analysts?!).

With the most recent earnings, we have confirmation that my analysis, which detailed why Lyft can increase revenue yet cannot stop the losses, was accurate with expectations of an estimated $1.1 billion in losses this year.

Reuters published in 2015 that Uber passengers pay only 41 percent of the actual cost of their trips. At the time, Reuters warned that this creates an “artificial signal about the size of the market” when Uber released limited financial data that showed losses of $708 million per quarter. Four years later, little has changed.

How Uber’s IPO Compares to other IPOs:

Uber is an IPO that has been covered extensively. You may have heard comparisons of Uber’s IPO to Facebook or Alibaba. Uber is raising $9 billion in this week’s IPO, Facebook raised $16 billion in 2012 and Alibaba raised $25 billion in 2014. Facebook and Alibaba are both doing great, seems to be the logic OR many tech companies are not profitable at the time of IPO is another costly mistake when comparing Uber to other IPOs.

Of course, these “big tech” comparisons don’t tell the whole story. Facebook had $1.75 billion in operating income, and $1 billion in net income in the year prior to the 2012 IPO. Alibaba had $1.7 billion in operating income, $1.3 billion in net income, and $2.6 billion in adjusted EBITDA in 2013, the year prior to its IPO. To compare, Uber has a $3 billion operating loss, and negative $1.8 billion adjusted EBITDA.

Notably, for anyone glancing over the prospectus, Uber sold some operations in Russia and Asia, which provided one-time income, and caused the company to post $1 billion in net income. This is why net income should be ignored as it does not reflect the operating income or adjusted EBITDA. To summarize, Uber’s prospectus points towards “an accumulated deficit of $7.8 billion” in the years ending December 31, 2017 and 2018. The year prior (2017), Uber posted $4 billion in operating loss and negative $2.6 billion in adjusted EBITDA.

Chicken and the Egg – Both Broken:

Most investors know there have been numerous lawsuits against Uber with many examples listed on page 28 of the prospectus. Here is a sample of what it says:

“We are involved in numerous legal proceedings globally, including putative class and collective class action lawsuits, demands for arbitration, charges and claims before administrative agencies, and investigations or audits by labor, social security, and tax authorities that claim that Drivers should be treated as our employees (or as workers or quasi-employees where those statuses exist), rather than as independent contractors.”

This paragraph is followed by a list of class action lawsuits and state-level Supreme Court rulings that Uber has been involved with and the various legislation or judicial decisions that could have an adverse effect on the business and financial condition of the company.

Although being sued often comes with the territory for disruptive startups, this is unique as the work force is going on strike during the IPO (this is not a competitor suing over intellectual property, etc). The drivers and customers are a chicken-and-egg scenario and Uber struggles to pacify both to successfully operate. On one hand, Uber is subsidizing rides at up to 60% to lure the customers, and on the other hand, the workers are retaliating. This is not a good formula. Most importantly, Uber has no profit to absorb a change in business model, such as being required to pay minimum wages or health care.

Here are some charts:

If you need some charts, to prove what I’m saying, there is an overabundance of charts that show the issues Uber has with subsidizing rides “to create artificial signals about the market” (Reuters words, not mine).

Core platform is the margin Uber generates after direct expenses. As the prospectus states, “Core Platform Contribution Margin is a useful indicator of the economics of our Core Platform, as it does not include unallocated research and development and general and administrative expenses.” Here is what the margins look like:

uber core platform contribution margin

The reasons Uber states the Core Platform Contribution Margin goes through periods of decline is due to competition in ridesharing (translation: Uber has to subsidize rides to remain competitive) and they also state it’s due to planned investments in Uber Eats. The problem is that Uber Eats only contributed $165 million in adjusted net revenue last quarter compared to ride sharing at $2.3 billion in adjusted net revenue, and therefore, the majority of the decline is likely due to the issues I stated above (rides are priced too low for profits but price of rides must remain low for demand).

Here’s another chart that shows you what it looks like when a company subsidizes purchases with the capital it has raised.

relationship between demand and profits - Uber

And here’s another one – perhaps the most critical as it shows the relationship between sales and profits:

ridesharing profits

As sales go up, gross bookings per trip goes down. This is a good indication that the business model requires the price of the ride to remain below fair value in order to drive demand. Although some reporters and analysts like to talk about Uber Eats, the issue is that Uber is valued at $90 billion+ and Uber Eats is a very small percentage of revenue. You can’t conclude that Uber Eats is a good investment opportunity as it makes up about 5% of Uber’s revenue and this won’t absorb the ride-sharing losses.

Notably, the chart which shows the unprofitable relationship between ridesharing trips and ridesharing gross bookings per trip is on page 106 of the Prospectus. On page one, we are presented with a sky-rocketing hockey stick chart based off the number of rides Uber has booked from 1 billion in March 2016 to 10 billion rides today. This 10x chart doesn’t tell the whole story like the charts above.

AVs – Long Ways Off:

This is where the story gets even more risky as the solution to the upset drivers is that these drivers will not be needed soon due to autonomous driving. Any company who is publicizing autonomous driving right now as a near-term way of driving profits is a good company to run from – and quickly.

We saw Lyft use this tactic to distract from their disappointing earnings this week with PR timed to the earnings report that “Waymo and Lyft partner to scale self-driving robotaxi service in Phoenix.” On closer look, Waymo will only add 10 vehicles to the Lyft app in their Arizona testing sites in Phoenix.

That aside, let’s go into the time machine for a minute to revisit stock prices relative to important product releases. Apple was priced at $11 in 2009, two years after the iPhone came out, and was priced at $35 in 2010, when the economy was doing a little better. Facebook was priced in the $25 range for years after they pivoted to a native mobile app and launched Messenger, both of which greatly contributed to the data collection and ad targeting that drives ad revenue today. Amazon was priced under $100 for nearly three years after the company launched AWS.

Point being, not only are autonomous vehicles a long way off from being commercially deployed to the public and able to generate profits, (and there is a ton of competition), but to invest in tech before it hits the market is high-stakes speculation. There is not one example where it made sense to invest in the company years before a tech product was released. Meanwhile, there are many examples where the stock price and valuations were low even after profitable products had gained traction. I’m not saying you want to be late to the market for AVs, rather I’m saying it can be just as costly to be this early – especially with companies that have ten digit losses.

Note: If you’ve read any of my previous analysis, you’ll know that I’ve been writing about the realities for autonomous vehicles for awhile now and how this does not match investors’ expectations. I won’t repeat my AV bubble thesis here but you can read quite a bit of this under my profile.

Don’t Get Duped on Uber IPO:

Sometimes investors get it wrong. We see this on the public markets frequently when a legendary investor goes all-in at the wrong time or a darling stock has a sudden drop. Well, guess what? Private investors get it wrong too sometimes. And the venture capitalists who invested in Uber and Lyft really got it wrong with ride-sharing. Their eyes lit up with the promise of a serviceable available market (SAM) and total addressable market (TAM) that would replace personal car ownership around the world. User growth is phenomenal and the brand is ubiquitous. VCs kept fueling more and more capital into the leaky ride-sharing business model and something prevented these VCs from using discipline to require proof of the following:

Question: will charging below a fair market price and subsidizing rides at up to 60% create a profit margin? Answer: No

Question: if we charge a fair market price to stop the losses, will there be enough demand? Answer: No.

The ride-sharing business model as we know it today will never be profitable. Meanwhile, the venture capitalists who bought into the world’s most valuable startup want their money back. Do you want to donate to the “pay VCs their $90-$120 billion” charity cause? If so, shares will be available Friday.

Posted in Consumer Tech, Financial Markets, TravelLeave a Comment on Uber IPO: Record-Breaking For All the Wrong Reasons

Apple Stock: A New Era of Mobile Saturation

Posted on March 22, 2019June 30, 2026 by io-fund
Apple Stock: A New Era of Mobile Saturation

Debuting in 1980, Apple is nearing its 40th anniversary on the stock market. The company has undergone many pivots successfully from computers to improved operating systems, to iPods, iPhones, app stores and music services. Many of these pivots were executed beautifully, with the most recent one being Apple Music, which took a majority of market share in music streaming within 4 years in the United States.

Of course, the iPhone is Apple’s force extender. One quick glimpse at the stock chart history and it’s easy to see something important happened in 2008. The invention has sold over 2.2 billion units with an average price tag of $793. The iPhone altered the United States economy, creating a thriving developer ecosystem while 87 percent of smartphone profits despite selling 18 percent of all smartphone units. With the iPhone’s release, Apple not only became one of the biggest companies in the world, but it also has more cash reserves than most countries’ GDP at $285 billion.

There are many positives to Apple’s story beyond the iPhone, with a wearables business up over 50%, cloud services up 40%, and Apple News readership at 85 million active monthly users. Apple Music is also now the number one streaming service in the United States over Spotify and closing the gap globally with 53M subscribers vs 83M subscribers. Most importantly, Apple has a media announcement planned for March 25th, which will add to the growing services revenue.

Earnings reported on January 29th, 2019 were more encouraging than anticipated following the lowered guidance. Apple beat earnings at $4.17 compared to last years $3.89. Total revenue was lower at $84 billion, down by 4.51% and beat guidance by $312 million. Future guidance expects revenue between $55 billion and $59 billion for this quarter to be reported at the end of April. Gross margins are expected between 37 percent and 38 percent. The company has a hoard of cash and the stock pays an increasing dividend.

Investors should exercise caution, however, as the broader mobile market is slowing down and is at the point of saturation. Mobile has been the de facto leader for tech growth during this historical bull market, and has provided consistent YoY returns that the dot-com bubble would be envious of. Investors should recognize mobile has reached its top as a primary driver across tech growth stocks, and I do not believe the mobile slowdown is over yet, or that the full effects have been completely reflected in earnings.

Apple can (and will) pivot. One day, the company will be known for health services, vehicle software, as a media titan, and more. However, But to expect one quarter of decreasing iPhone sales before the stock resumes previous heights would defy the laws of the tech hype cycle. Apple simply has not hit the iPhone bottom, and the effects of mobile saturation are not fully reflected yet in the company’s earnings.

The Fifth Factor: Mobile Saturation

Apple noted four factors that impacted results when the company provided guidance in November: “different iPhone launch timing from a year ago, FX headwinds, supply constraints on certain products and macroeconomic conditions in emerging markets.” I would call this the 1,000 foot-view while the 30,000 foot-view tells us the fifth factor is mobile saturation.  Eventually, everyone has a television set and a laptop – and now, a smartphone. This will continue to be the reality that Apple contends with.source: https://www.statista.com/statistics/263441/global-smartphone-shipments-forecast/

The smartphone market contracted in 2017 to 1.462 billion units and in 2018 to 1.42 billion units, and is expected to return to minimal yet positive growth percentages at a CAGR of 2.5%. While 1.5 billion smartphones per year is substantial, the law of saturation is likely to drive prices down, with Android owning 85% of the market today, and we see decreasing iPhone penetration in China where lower-priced competitors gain market share.

IDC estimated Apple will sell 242 million smartphones by 2022 up from 221 million in 2018. The issue with these estimates is that IDC does not break down the percentage of potential decline between 2018 to 2022. The most up to date number available from IDC is an anticipated decline of 0.8% in worldwide smartphone sales in 2019, published on March 6th.

We saw China decline 10% last year in global shipments of smartphones. Taiwanese company, TSMC, is the sole supplier of iPhone core processor chips and told Nikkei Asian Review that the company is cautious about demand for high-end smart phones, which is a nod toward Apple from a main supplier. Samsung Electronic’s Vice President Lee Myung-jin told investors in late January that “demand for memory chips has declined in the fourth quarter as external circumstances worsened and customers adjusted their orders” and he believes the decline “will continue in the first quarter, as key customers keep adjusting their orders.”

Huawei eats market share in Asia and is currently the world’s fastest-growing smartphone seller. The company sold 200-million units in 2018, posting 30% growth from the 153 million units sold in 2017 and has seen a 66x increase from the 3 million units sold in 2010.

Huawei edged out Apple with 14.6% of the global smartphone market compared to Apple’s 13.2% share in Q3 2018. China’s Xiaomi also posted 21.2% growth. Therefore, a resolution to the trade war or other macro conditions may not actually revive iPhone sales as Chinese smartphone makers appear determined to gain domestic ground. In 2018, the iPhone had an average sales price (ASP) of $793 while Huawei’s ASP is $269 in China and about $380 in Europe. The ASP for Xiaomi is $138. Politics and trade war aside, one indication of saturation and post-euphoria consumer behavior is when consumers seek lower prices as a trend becomes more commonplace. Longer replacement cycles and lack of innovation on the device, such as new applications, also point towards a market at its peak.

China represents roughly 1/3rd of smartphone penetration compared to the United States at 1/12th. We can see over the last few years that the United States had the lowest CAGR of any region globally. According to Pew Research, 77% of Americans own smartphones, a jump from 35% in 2011. If Apple is losing market share in China, this leaves Latin America, where the average sales price of the iPhone is prohibitive.

Apple’s Pivot to Services

There is no reason for investors to not be hopeful about the upcoming media announcement, although as Apple Music has shown, it may take up to 3 years before it adds significantly to the top line. Many investors may ignore the mobile saturation issues or believe the bulk of the iPhone decline is priced into the stock. If Apple is a core holding, the arrival of a new direction is likely to be welcomed. Today, services account for 18% of Apple’s overall quarterly revenue at $9.9 billion or $37 billion annually with handsome margins of 62.8%. Apple has executed Apple Music beautifully since 2015 and is now the top music streaming service in the United States, much to Spotify’s chagrin. To give you a comparison and a glimpse into the media services possibilities, it took Spotify twelve years to gain 80+ million subscribers while Apple reported over 50 million in three (brief) years. OTT media endeavors require a note of caution, however, especially for those companies creating original content. Historically speaking, Amazon had a content budget of $4.5 billion in 2017 for an audience of 27 million viewers. As Jeff Bezos told Hollywood Reporter at that time, “When people join Prime, they buy more of everything” and the losses on original content are recovered. Apple will also need to recover the losses on original content. Some anticipate that Apple will recoup the costs of original content with a 30% revenue split from the other channels they plan to aggregate on the platform.

While Apple may be able to pull off migrating users from their trusted favorites, such as Hulu, Prime, Netflix, Showtime and HBO, it will be interesting to see how quickly Apple can make back the investment of paying the likes of Oprah Winfrey, Jennifer Aniston and more big names for the original content they plan to offer. There’s also speculation Apple may bundle services like Spotify and Hulu do today, where the two services are offered for about a $3 discount at $17.99. Regardless the monetization strategy, Apple’s media announcement is likely to help the stock, despite the many warning signs of a distressed mobile market.

Takeaway:

Apple has a history of successful pivots, and services will add a projected $100 billion in revenue by 2023. However, I believe we haven’t found a bottom yet on mobile saturation. In 2017, Apple sold 19 percent of the smartphones purchased globally, yet captured 87 percent of the profits. My prediction is that those days of the peak mobile market are over. Even if earnings see-saw for a few quarters, there will be a downward trendline from this peak. Apple will make a better investment once mobile saturation has run its course. I believe the stock price we see today is overly optimistic in regards to the eventual slow down across the mobile industry.

Image credit: Apple

Posted in Consumer Tech, Financial Analysis, MobileLeave a Comment on Apple Stock: A New Era of Mobile Saturation

Lyft: Risky Valuation and No Intellectual Property

Posted on March 14, 2019June 30, 2026 by io-fund
Lyft: Risky Valuation and No Intellectual Property

Who doesn’t love the ease of using a mobile application to order a ride rather than stand awkwardly on a street corner hailing a taxi? Once I downloaded Lyft and Uber, I said goodbye to the rejection of occupied taxis forever. Lyft and Uber represent free market evolution by offering a better service than the outdated competition. The apps shave off valuable time with door-side pickup, and the overall cost is cheaper than taxis too. In San Francisco, these apps have become ubiquitous, but these biases have to take a backseat to investment discipline.

There is a tinge of glam to the upcoming Lyft IPO road show, and the anticipated IPO from Uber in 2019. Silicon Valley produces a lot of winners; however, I believe investors should be careful with both of these IPOs due to exuberant valuations, accelerating net losses, and a lack of geographic expansion opportunities. Yet, another concern is the liquidity event the large cap IPO provides, and the level of PR that can be bought leading up to the IPO, which will likely focus on the growing sales. There is evidence the growing revenue has been subsidized, therefore, revenue is not a safe bet when evaluating these particular stocks, and the prospectus fails to outline a clear path to profitability.

1. Risky Valuation with Accelerating Net Losses

Lyft went from a $7 billion valuation in 2017 to a $15 billion valuation in 2018 and is now seeking a $20-$25 billion valuation on the public markets. The problem with this rising valuation is that losses are progressive with $2.6 billion in revenue in 2018 but a $911.3 million loss. Due to these losses, Lyft may need to borrow or raise more equity after its first year on the public market, which means debt or dilutive stock offerings.

Lyft’s sales, on the other hand, appear positive on the surface with incredible growth year-over-year from $343M in 2016 to $1.05 billion in 2017 and 100%+ growth in 2018 at $2.15 billion. The problem is that the losses are also accelerating.

Lyft’s filing also points to an important issue with growth marketing tactics for user acquisition (UA) and user retention. I’ll copy the paragraph here verbatim from the S-1 Filing and translate my understanding of how ridesharing apps subsidize UA.

“Ability to Cost-Effectively Attract and Retain Riders and Increase Our Share of Their Transportation Spend “Ability to Cost-Effectively Attract and Retain Riders and Increase Our Share of Their Transportation Spend 

We grow our business by attracting new riders to our platform and increasing their usage of our platform over time. To effectively attract riders, we focus on driving organic adoption in our rider base, and do so with investments in brand and growth marketing to increase consumer awareness. We also offer incentives for first time riders to try Lyft, as well as incentives for existing drivers and riders to refer new riders. Once riders start using Lyft, we provide a quality experience and a diverse offering of products to accommodate different transportation use cases, retain riders and encourage repeat usage. We often also provide incentives to existing riders to encourage them to expand their use of our platform. If we fail to continue to attract riders to our platform and grow our rider base, expand riders’ usage of our platform over time or increase our share of riders’ transportation spend, our results of operations would be harmed.”

The translation here is that Lyft and Uber pay incentives to acquire and retain users. In gaming, a company might spend $8 to acquire a user with a lifetime value of $15 per user for a profit of $7. The problem with ride-sharing apps is that the incentives offered do not cover the costs of the ride, and that is one reason we see strong sales growth mired by accelerating losses.

Reuters has some historic information on this dated back to 2015, when Uber passengers paid only 41 percent of the actual cost of their trips. At the time, Reuters reported that this creates an “artificial signal about the size of the market” with Uber releasing limited financial data that showed losses of $708 million per quarter.

Going back to Lyft, the takeaway is that these incentives are creating an artificial signal about revenue, which is ultimately overshadowed by net losses. The problem with subsidizing rides is that public market investors aren’t able to determine what will be required for profitability, how much the cost of the ride will have to increase, and if that will impede the demand to ride share.

2. “Human Resources” Business Model is Not Profitable

Lyft and Uber have scaled their companies but it comes with the variable cost of human labor. Ideally, you want fixed costs for R&D on platforms, software, hardware and other products to create the margins that technology is known for. Lyft and Uber are mobile applications, but the business model is more of a large-cap human resources department with many variables around wages, and potentially regulations due to independent contractor classifications. (There was a recent $20 million settlement due to the misclassification of drivers in California).

As you’ll see below, the mobile app holds very little intellectual property, with the primary value of the product resting in the mobilization of a massive work force of nearly 2 million people, per Lyft’s S-1 Filing. To some regard, Lyft and Uber are not technology companies, rather they are very large human resource departments run through an application.  Whenever you are involved with labor at this level, regulations and wages eat at profits.

3. Autonomous Vehicles 5-10 Years Out

This leads us to the only hope for ride-sharing to become profitable, which would be to remove the human driver through autonomous vehicles. Here’s some information from my autonomous vehicle analysis published in October on AV delays as it pertains to the timeline of when Lyft or Uber could potentially deploy driverless and how investors should exercise caution here:

“The regulation hurdles between Level 2 and Level 3 and delayed deployments will put immense pressure on stocks that are overvalued based on AV speculation. ABI Research, an advisory firm that reports on market-foresight trends, predicts 8 million consumer vehicles with Level 3 to Level 5 autonomy will ship in 2025. Compare this to the 94.5 million vehicles sold in 2017 which equates to 8.5% of sales. This is a small and fairly insignificant percentage of market share to be chasing 7-years ahead of deployment. Yet, investors are pouring cash into hyped up stocks- and the press plays a large role in this. Headlines are a continual churn of autonomous vehicle “moments” – every partnership, every mile driven, every make and model that adds another feature. To be clear, we’ve only gone from a Level 1 to Level 2. We are not able to release Level 3 AV right now – and yes, that includes Tesla.

Note: I was the first to write about the issues around autonomous vehicle deployment and how this will affect stocks (this prediction was before GM announced layoffs and before Tesla reported AV deployment issues, as well).

4. Total Addressable Market & Lack of Intellectual Property

I saved some of the best for last, as a paramount risk to both Uber and Lyft is total addressable market. Room for geographic expansion is limited beyond the United States, other than a few outlier countries like Saudi Arabia. Of course, the underlying issue with TAM is a lack of intellectual property with an easy-to-duplicate mobile application that leverages common app features such as GPS location and SMS/voice. Although it is common to discuss the ridesharing ecosystem as “Lyft Vs. Uber,” the fact is the global competitors in their respective geographies are a serious deterrent to future growth.

Here is a summary of the global ride-sharing market:

Asia: China’s Didi surpassed Uber as the world’s most valuable startup. Both Uber and Didi have something in common too; their investor is SoftBank. Grab is Singapore’s ridesharing service and bought Uber out of the market in Southeast Asia. (Uber was losing money here). India has a domestic ridesharing company named Ola, who can operate for as cheap as 8 cents per kilometer.

Europe: Taxify and MyTaxiApp: I went to MWC in Barcelona about two weeks ago and hailed about thirty rides in one week through a ride-sharing app called MyTaxi. One interesting feature behind the MyTaxiApp is that it leverages unionized cab drivers through the app rather than mobilizing independent contractors. The fares are cheaper than Uber, too, which is why Uber wasn’t able to capture Europe.

Middle East:  The Dubai-based ride-hailing app Careem serves the Middle East and Africa with 33 million users.

Latin America: Uber is doing well in Latin America with 25 million monthly active users, a presence in 200 million metro areas and is in 15 countries. Lyft is unlikely to compete with Uber here. China’s Didi is moving forward on competing in Latin America.

Japan: Japan could be a potential market although the overall sentiment is that Japan has major regulatory hurdles and the high-quality taxi system does not need much improvement.

Takeaway: Due to the reasons I’ve outlined, my concern is that the valuations and late-stage IPO is better for private market liquidity and not a sustained growth story for the public markets. The accelerating losses tell a different story than the 100%+ revenue, and if investors are subsidizing rides, then buying PR focused on sales is cheap. There is also no clear path to geographic expansion for near-term growth. Will Uber and Lyft be around in 5 years? Sure. Yelp, Snap and Zynga are still around …

Posted in Consumer Tech, Tech Stocks, TravelLeave a Comment on Lyft: Risky Valuation and No Intellectual Property

Autonomous Vehicles: Fact vs. Fiction at CES 2019

Posted on January 17, 2019June 30, 2026 by io-fund
Autonomous Vehicles: Fact vs. Fiction at CES 2019

Robot dogs from Continental prove that autonomous vehicle hype has gone too far. At CES 2019, Continental announced a way to automate last mile-delivery without requiring a human. This is where the robot dogs come in. The company’s official statement was, “With the help of robot delivery, Continental’s vision for seamless mobility can extend right to your doorstep. Our vision of cascaded robot delivery leverages a driverless vehicle to carry delivery robots, creating an efficient transport team.”

Virtual Representation of Autonomous Vehicles with AI Robots. Source: Continental

The problem with robot dogs, and many other AV gimmicks, is that the industry is not talking truthfully about what where we are with AV and what it will take to put an advanced AVs on the road. This is harmful to consumers who mistakenly believe autonomous vehicles are available for purchase and already on the road today. In fact, 71% of respondents around the world believe they can buy an AV – yet there is not one AV on the market. The top three brands that consumers mistakenly believe distribute self-driving cars include Tesla (40%), BMW (27%), and Audi (21%). It’s also harmful to investors who expect AV technologies to be profitable in the near term of two to three years.

CES is one of the world’s major marketing events where autonomous vehicles were first hyped. The main stage, the keynotes, the sessions, the booths, the competition between rival companies – all of it pushed for bigger and better car demos. Which is why CES is the perfect platform for the announcement of PAVE, which stands for The Partners for Automated Vehicle Education. PAVE is a new coalition that will help educate the public and policymakers about the potential of automated vehicles. Audi, Aurora, Cruise, GM, Mobileye, Nvidia, Toyota, Waymo and Zoox have joined the coalition, which has a central focus on education and safety – and also a focus on more credible information. As stated by Mark Del Rosso, President of Audi America, “Traditional automakers and newcomers are investing billions of dollars in the technology that will make automated vehicles possible. PAVE recognizes the need to invest in public information – in making sure consumers and policymakers understand what’s real, what’s possible, and what is rumor or speculation.”

Just the Facts: Level 2 Automation at CES 2019

Level 2 automation is a reference to the six levels of autonomous vehicles published by SAE International, and adopted as the industry standard for discussing the various stages and evolution of autonomous vehicles. Level 0 is no automation and Level 5 is full automation without a human driver and does not have brakes or a steering wheel. We are at Level 2 right now and the industry is experiencing notable delays in deploying Level 3.

(NOTE:NOTE:  I’ve published extensively on an autonomous vehicle bubble due to investors pouring money into AV technologies that won’t commercially deploy for many years. You can access the analysis on GM here, the analysis on Tesla here and the analysis on how autonomous vehicles are creating a bubble here).

Below are a couple of the more important (and realistic) announcements from CES that will deploy in the very near future.

Nvidia

Nvidia placed emphasis on gaming this year at its Sunday CES press conference with the announcement of the RTX 2060, whereas it has been Nvidia’s tradition to focus on autonomous vehicles (and data center technologies) at the CES press conference. One day later, on Monday at CES, Nvidia launched DRIVE AutoPilot, which will improve advanced driver assistance features, such as enabling lane changes, pedestrian and cyclist detection, parking assist, and personal mapping. This improved automation strengthens the Level 2 vehicles we see on the road today.

Intel

Intel had a showy display that included a Gotham City themed BMW X5 equipped with large screen TVs, projectors, sensors and haptic feedback. Visual distractions aside, the real news from Intel at CES is the company’s ongoing focus on China. Intel did not officially state they are redirecting their efforts from the United States to China, however, the announcements speak for themselves:

  • Mobileye, Beijing Public Transport Corp. and Beijing Beytai Collaborate to Bring Autonomy to China’s Public Transportation
  • 2019 CES: Great Wall Motors, Mobileye Join Forces to Deliver ADAS and Autonomous Driving Solutions in China and Beyond
  • Intel and Alibaba Team on New AI-Powered 3D Athlete Tracking Technology Aimed at the Olympic Games Tokyo 2020

My newsletter subscribers get this information first. Sign up here.My newsletter subscribers get this information first. Sign up here.here.

This is in addition to a hard-to-miss announcement back in July that Baidu was partnering with Mobileye on their Apollo vehicle. At CES 2019, Baidu had on display the successful implementation of Mobileye’s Responsibility Sensitivity Safety (RSS) in the simulation engine of Apollo (I personally tried out the simulator).

Baidu Spokesperson at CES discussing Data-Centric Innovation

It’s important to note that China is not immune to the issues the industry faces in advancing from Level 2 automation to Level 3 automation. China, too, is idling at Level 2 (apologies for the pun). For instance, Great Wall Motors released a statement at CES 2019 that “GWM hope to integrate Mobileye’s solutions into its vehicles. Starting with L0-L2+ within the next three to five years, the companies are also exploring opportunities for Mobileye’s Level 3 products.”

Baidu and Mobileye have both made promises to deliver Level 3 by 2019 and Level 4 autonomy by 2021. These dates were announced in 2017 but there has been no recent updates as to the estimated delivery for L3 – including at CES this year.

Mercedes Benz

The best AV investments over the next three to five years will come from companies who are taking baby steps towards a better and safer driving experience. Mercedes-Benz is one company making the most of Level 2 partial automation by announcing a new CLA class. The CLA class is a more tech-driven option with augmented reality for navigation, and an Interior Assistant that understands indirect voice commands and operational gestures. (Read my analysis on how we have reached a tipping point for AI-powered assistants here). An example of this is when a driver reaches over in the seat, and lights automatically illuminate the area. You can also set a command such as “navigate me home” or ask the voice assistant something complicated like “find child-friendly Asian restaurants nearby with 4-star rating which are neither Chinese nor Japanese,” which was one example given in the demo.

New Autonomous Vehicle Mercedes Benz CLA class. Source: TechCrunch

Takeaway:

Nvidia and Intel had a different tone at CES this year in regards to autonomous vehicles. Nvidia’s launch of DRIVE AutoPilot is a smart strategy to boost sales in the short term while the AV future of Level 3 or Level 4 sorts itself out. The Mercedes CLA class is another great example of a strong Level 2 automation strategy. Intel is clearly betting on China, especially Baidu, although China is not immune to the difficulties of how to get a machine to react like a human. Notably, there was no Level 3 follow up from Baidu at this year’s CES despite promises for arrival in 2019 (although the year is young).

Regardless of make or model, AVs are stuck at Level 2, and there are too high of expectations as to when advanced AV will turn a profit. Therefore, the AV market will struggle as the delivery of reliable and safe automation continues to see delays. Nvidia, Intel and Mercedes are a few companies preparing for the slow down, and I’m betting we will see others do the same this year.

Posted in Autonomous Vehicles, Autonomous Vehicles, Broad Market Today, Consumer Tech, Market Updates, Tech StocksLeave a Comment on Autonomous Vehicles: Fact vs. Fiction at CES 2019

GM Stock Risky Due to Autonomous Vehicle Bubble

Posted on November 29, 2018June 30, 2026 by io-fund
GM Stock Risky Due to Autonomous Vehicle Bubble

This week, General Motors Company cut more than 14,000 salaried staff and factory workers with plans to close seven factories worldwide in what Bloomberg calls a “sweeping realignment to prepare for a future of electric and self-driving vehicles.” Unfortunately for GM, and their employees, the future of autonomous vehicles is much farther off than what the company represents. Investors in GM stock should be cautious, and realistic, as to when new revenue streams will occur, as cutting costs, even to the tune of a net savings of $4.5 billion, might not be enough to wait out the innovation cycle.

In light of the recent layouts, there is $1.5 billion of reduced capex that the company will be saving by cutting the low-demand production lines and the anticipated plant closures (a drop in the bucket compared to the annual capex of $27.5 billion), however, the $1.5 billion capex is not being reinvested into electric vehicles or autonomous vehicle production at this time. The lack of reallocation conflicts with statements from the company CEO, Mary Barra, who promised the company would double investment in electric vehicles and self-driving technology during this week’s announcement.

The bottom line is that GM is correct to prepare for tough times, but they are not disclosing the true timeline for long-range electric vehicle and autonomous vehicle deployment and investors will have to wait years before they see any real profit from new production lines.

Three Words to Heed for GM Stock: Gartner’s “Trough of Disillusionment”

In September, Autonomous Vehicles fell into the “trough of disillusionment,” which is the downward slope published by the analyst firm, Gartner, to show the hype cycle for certain technologies. You can think of this as “winter is coming” for tech products – a time when all of the buzz and excitement finally meets reality (note: artificial intelligence winter is a well-documented thing).

ABI Research, an advisory firm that reports on market-foresight trends, predicts 8 million consumer vehicles with Level 3 to Level 5 autonomy will ship in 2025. Compare this to the 94.5 million vehicles sold in 2017 – which equates to 8.5% of sales. This is a small and fairly insignificant percentage of market share to be chasing 7-years ahead of deployment. Yet, investors have poured cash into auto manufacturers due to marketing campaigns that provide false hope for the near future.

Twitter post

The reality for autonomous vehicles includes regulations, production cycles, and delays in implementation for what is an extraordinarily difficult problem to solve – how to get machines to respond like humans at crucial moments. This gap between investor expectations (perception) and commercial deployments (reality) has created an autonomous vehicle bubble.

Per statements from GM, long-range electric vehicles are a minimum of 8 years before they represent a slim 10% of GM’s current production. In 2017, the company committed to a volume production goal of “1 million units globally by 2026,” with the majority of EVs being sold in China. GM’s overall production was about 10 million units globally in 2016.

Brief Background on the 6 Levels of Autonomy

You can skip this section if you know the six levels of autonomous vehicles as published by SAE International. If not, this background is important to understand why the autonomous vehicle bubble formed, and why and when it will burst.

Level 0: No Automation. The driver performs all of the tasks.

Level 1: Driver Assistance. The driver handles all of the accelerating, braking, and monitoring of surrounding environment. An example of this level is when a car brakes for you in a critical moment.

Level 2: Partial Automation. The vehicle assists with steering and acceleration functions and allows the driver to disengage. Bubble formed here with investments pouring in, fueled by high hopes of Level 4 or Level 5 commercial deployment by 2020.

Level 3: Conditional Automation. The vehicle controls all monitoring of the environment using sensors. The driver’s attention is critical but the AV system runs the safety critical functions. This level does not require human attention under 37 miles per hour. Bubble will burst at this level as commercial deployments are delayed and reality sets in that AV investments will not see returns for many years.

Level 4: High Automation. Vehicle is capable of steering, braking, and accelerating, as well as responding to events and changing lanes. The system is switched into the mode under safe conditions, but the vehicle cannot determine dynamic instances like traffic jams or merging onto the highway. Most likely ETA 7-10 years.

Level 5: Complete Automation. No human attention required. No need for pedals, brakes, or a steering wheel. The AV controls all critical tasks, monitoring of the environment and identification of unique driving conditions like traffic jams. Most likely ETA 10-15 years.

Autonomous Vehicles – Stuck in Second Gear

Hurricane auto sales from last September helped GM stock, which rose 11.9% from the previous years, however the stock has retraced and is now trading at $35 per share. GM is no stranger to pushing the autonomous vehicle hype with executives commenting that Cruise Automation was making “rapid progress” back in October 2017, and in a blog post, the CEO stated, “in the coming months, we’ll take the next bold steps in testing our autonomous technology as we lead the way to fully self-driving vehicles without any human driver as a backup.” Those months have come and gone, of course.

Tesla is another example of a company that has made unfulfilled AV promises. In 2017, Tesla missed the deadline for a full rollout for self-driving cars. Since 2015, the company had been promising that every car made going forward would have the hardware necessary to facilitate full self-driving capabilities. In line with inflated expectations, Tesla announced it would officially stop promoting the “Full Self-Driving” option for its cars.

My newsletter subscribers get this information first. Sign up here.My newsletter subscribers get this information first. Sign up here.here.

Waymo has been in testing since 2009 and has racked up more than 8 million miles on public roads and more than 5 billion miles in simulation. There are 600 self-driving Chrysler Pacifica Hybrid minivans on the road with goals of launching a commercial driverless transportation system later this year. This, and many other “near deployment” announcements have created massive expectations for the AV market, which is forecast to grow 10x from $54 billion in 2019 to $556 billion in 2026 at a growth rate of 39.47%.

The primary risk today for GM stock is that these forecasts assume commercial deployments will occur on time. As Mike Ramsey, a lead author on the Gartner report points out, even if GM and Waymo continue to debut driverless minivans or launch ride-hailing fleets, commercial deployments won’t be ready anytime soon. For example, the 2019 Audi A8 with Traffic Jam Assist with Level 3 partial automation, which has been anticipated for some time, has extended its release date another year due to foggy federal regulatory framework, infrastructural differences, and a lack of consumer understanding of self-driving technology.

More Evidence of the Autonomous Vehicle Bubble

In two side-by-side headlines we see Mary Barra of GM propagating a very different perception than what company insiders have reported. On November 1st, at the New Times conference moderated by Andrew Ross Sorkin, Barra stated the company is “on track” to roll out a ride sharing service in 2019 that would rely on autonomous vehicles, with the New York Times reporting Barra “added the company had a strategy to show how its vehicles are safer than human drivers.”

Dealbook

Meanwhile, on October 23rd, GM insiders told Reuters, “Nothing is on schedule,” citing unexpected technical challenges, such as Cruise cars not correctly identifying whether objects are in motion. Current employees and former employees also reported that Cruise software struggled to identify whether objects on the road are stationary or moving, failed to recognize pedestrians, and has mistakenly seen phantom bicycles.

Reuters

The regulation hurdles between Level 2 and Level 3, and delayed deployments, will put immense pressure on stocks, like GM, that are overvalued based on AV speculation. Press plays a large role in this. Headlines are a continual churn of autonomous vehicle “moments” – every partnership, every mile driven, every make and model that adds another feature. To be clear, we’ve only gone from a Level 1 to Level 2. We are not able to release Level 3 AV right now –that includes Waymo, GM, Audi, Mercedes, BMW, and yes – even Tesla.

Research studies have proven that consumers are very confused by the high profile promises, which Thatcham Research calls “dangerously confusing.” In a recent study, 71 percent of respondents around the world believe they can buy an autonomous vehicle today – yet there is not one autonomous vehicle on the market. The top three brands that consumers mistakenly believe distribute self-driving cars include Tesla (40%), BMW (27%), and Audi (21%). Of these, 11 percent say they would take a brief nap while using assist systems (hopefully, you’re not the person in the crosswalk when this happens).

GM Stock Investors Must Define “Future”

The company’s decision to lay off a sizeable work force seems sensible enough from a shareholders’ perspective (however unfortunate for the Midwest laborers). However, what is not sensible is having high expectations of when the future will deliver new revenue streams.

For value investors looking to buy GM’s high yield at depressed prices, don’t base the decision on GM’s PR push around electric vehicles and autonomous vehicles unless you’re comfortable not seeing profits in these production lines for many years to come.

Posted in AI Stocks, Autonomous Vehicles, Consumer Tech, Electric Vehicles, Tech StocksLeave a Comment on GM Stock Risky Due to Autonomous Vehicle Bubble

Posts navigation

Older posts
Newer posts

Recent Posts

  • The IPO Glut of 2020: Why Valuations Have Gone Too Far
  • Zoom Discusses Two Important Catalysts In Q1 Earnings
  • Three Risk Management Tools the I/O Fund Offers
  • Micron Is Up 900%. Here’s Why the AI Memory Trade May Still Have Room to Run
  • Credo: Reliability Leader Aggressively Moves into Optics

Recent Comments

No comments to show.

Archives

  • June 2026
  • May 2026
  • April 2026
  • March 2026
  • February 2026
  • January 2026
  • December 2025
  • November 2025
  • October 2025
  • September 2025
  • August 2025
  • July 2025
  • June 2025
  • May 2025
  • April 2025
  • March 2025
  • February 2025
  • January 2025
  • December 2024
  • November 2024
  • October 2024
  • September 2024
  • August 2024
  • July 2024
  • June 2024
  • May 2024
  • April 2024
  • March 2024
  • February 2024
  • January 2024
  • December 2023
  • November 2023
  • October 2023
  • September 2023
  • August 2023
  • July 2023
  • June 2023
  • May 2023
  • April 2023
  • March 2023
  • February 2023
  • January 2023
  • December 2022
  • November 2022
  • October 2022
  • September 2022
  • August 2022
  • July 2022
  • June 2022
  • May 2022
  • April 2022
  • March 2022
  • February 2022
  • January 2022
  • December 2021
  • November 2021
  • October 2021
  • September 2021
  • August 2021
  • July 2021
  • June 2021
  • May 2021
  • April 2021
  • March 2021
  • February 2021
  • January 2021
  • December 2020
  • November 2020
  • October 2020
  • September 2020
  • August 2020
  • July 2020
  • June 2020
  • May 2020
  • April 2020
  • March 2020
  • February 2020
  • January 2020
  • December 2019
  • November 2019
  • October 2019
  • September 2019
  • August 2019
  • July 2019
  • June 2019
  • May 2019
  • April 2019
  • March 2019
  • February 2019
  • January 2019
  • December 2018
  • November 2018
  • October 2018
  • September 2018
  • August 2018
  • July 2018
  • June 2018
  • May 2018
  • April 2018
  • February 2018
  • January 2018

Categories

  • 5G
  • About
  • Accounting Tips
  • AdTech
  • Ai Platforms
  • Ai Platforms
  • Ai Platforms
  • Ai Platforms
  • Ai Platforms
  • Ai Platforms
  • Ai Platforms
  • Ai Platforms
  • Ai Platforms
  • Ai Platforms
  • Ai Platforms
  • Ai Platforms
  • Ai Platforms
  • Ai Platforms
  • Ai Platforms
  • Ai Platforms
  • AI Stocks
  • AI Stocks
  • Analysts
  • Application Monitoring
  • Application Monitoring
  • Applications
  • Applications
  • Applications
  • Applications
  • Applications
  • Applications
  • Applications
  • AR
  • Audit Reports
  • Autonomous Vehicles
  • Autonomous Vehicles
  • Autonomous Vehicles
  • Autonomous Vehicles
  • Autonomous Vehicles
  • Autonomous Vehicles
  • Autonomous Vehicles
  • Avod
  • Avod
  • Battery Charging
  • Bear Market
  • Bitcoin
  • Bitcoin
  • Bitcoin
  • Bitcoin
  • Bitcoin
  • Bitcoin
  • Bitcoin
  • Blockchain
  • Blockchain
  • Blockchain
  • Blockchain
  • Blockchain
  • Blockchain
  • Blockchain
  • Broad Market Today
  • Bull Market
  • Bull Market
  • Chainlink
  • Chainlink
  • Chainlink
  • Chainlink
  • China Stocks
  • Cloud
  • Cloud Infrastructure
  • Cloud Infrastructure
  • Cloud Infrastructure
  • Cloud Infrastructure
  • Cloud Infrastructure
  • Cloud Infrastructure
  • Cloud Infrastructure
  • Cloud Platforms
  • Cloud Platforms
  • Cloud Software
  • Cloud Software
  • Cloud Software
  • Cloud Software
  • Cloud Software
  • Cloud Software
  • Cloud Technology
  • Company
  • Company
  • Console Gaming
  • Console Gaming
  • Console Gaming
  • Consumer
  • Consumer
  • Consumer
  • Consumer
  • Consumer
  • Consumer
  • Consumer
  • Consumer
  • Consumer
  • Consumer
  • Consumer
  • Consumer
  • Consumer
  • Consumer
  • Consumer Tech
  • Corrections
  • Crypto Investment
  • Ctv
  • Ctv
  • Ctv
  • Ctv
  • Ctv
  • Ctv
  • Ctv
  • Ctv
  • Ctv
  • Ctv
  • Cybersecurity
  • Cybersecurity
  • Cybersecurity
  • Cybersecurity
  • Cybersecurity
  • Cybersecurity
  • Cybersecurity
  • Cybersecurity
  • Cybersecurity
  • Cybersecurity
  • Cybersecurity
  • Cybersecurity
  • Data
  • Data Analytics
  • Data Analytics
  • Data Analytics
  • Data Center
  • Data Center
  • Data Center
  • Data Center
  • Data Center
  • Data Center
  • Data Center
  • Data Center
  • Data Center
  • Data Center
  • Data Center
  • Data Center
  • Data Center
  • Data Center
  • Data Center
  • Data Center and Processing
  • Data Warehousing
  • Data Warehousing
  • Data Warehousing
  • Data Warehousing
  • Databases
  • Databases
  • Databases
  • Databases
  • Dating
  • Defi
  • Digital Ads
  • Digital Ads
  • Digital Ads
  • Digital Ads
  • Digital Ads
  • Digital Ads
  • Digital Ads
  • Digital Ads
  • Digital Ads
  • Digital Ads
  • Digital Ads
  • Digital Ads
  • Digital Ads
  • Digital Ads
  • E-Commerce
  • Earning Updates
  • Earning Updates
  • Earning Updates
  • Earning Updates
  • Earning Updates
  • Earnings Report
  • Earnings Report
  • Earnings Report
  • Earnings Report
  • Earnings Report
  • Earnings Report
  • Earnings Report
  • Earnings Report
  • ECommerce
  • Electric Vehicles
  • Electric Vehicles
  • Electric Vehicles
  • Electric Vehicles
  • Electric Vehicles
  • Electric Vehicles
  • Electric Vehicles
  • Energy Stocks
  • Enterprise
  • Enterprise
  • Enterprise
  • Enterprise
  • Enterprise
  • Enterprise
  • Enterprise
  • Enterprise
  • Enterprise
  • Ethereum
  • Events1
  • Events1
  • Exchange
  • Faq
  • Finance
  • Financial Analysis
  • Financial Analysis
  • Financial Analysis
  • Financial Analysis
  • Financial Analysis
  • Financial Analysis
  • Financial Analysis
  • Financial Analysis
  • Financial Analysis
  • Financial Analysis
  • Financial Analysis
  • Financial Analysis
  • Financial Markets
  • FinTech
  • Fundamental Analysis
  • Gambling
  • Gaming
  • Genomics
  • Glossary
  • Green Energy
  • Growth Stocks
  • Growth Stocks
  • Growth Stocks
  • Headsets
  • Headsets
  • Health Tech
  • Hydrogen
  • Identity
  • Identity
  • Identity
  • Inflation
  • Inflation
  • Inflation
  • Internet of Things
  • Interviews
  • Interviews
  • Interviews
  • Interviews
  • Investing
  • Investing
  • Ltbh
  • Ltbh
  • Ltbh
  • Ltbh
  • Ltbh
  • Macro Trends
  • Macro Trends
  • Market Trends
  • Market Trends
  • Market Trends
  • Market Trends
  • Market Trends
  • Market Trends
  • Market Trends
  • Market Updates
  • Market Updates
  • Market Updates
  • Market Updates
  • Market Updates
  • Market Updates
  • Market Updates
  • Market Updates
  • Market Updates
  • Market Updates
  • Media
  • Membership
  • Mining
  • Mobile
  • Mobile
  • Mobile
  • Mobile
  • Mobile Gaming
  • Mobile Gaming
  • Mobile Gaming
  • Multimedia
  • Music Streaming
  • NVDA | NVIDIA Corporation
  • Performance Updates
  • Pin Content
  • Podcasts
  • Podcasts
  • Podcasts
  • Portfolio
  • Premium Research
  • Press Releases
  • Press Releases
  • Productivity
  • Productivity
  • Productivity
  • Productivity
  • Productivity
  • Productivity
  • Productivity
  • Reports and Whitepapers
  • Research Services Preview
  • Resources
  • Resources
  • Semiconductor Stocks
  • Semiconductors
  • Semiconductors
  • Semiconductors
  • Semiconductors
  • Semiconductors
  • Semiconductors
  • Semiconductors
  • Semiconductors
  • Semiconductors
  • Semiconductors
  • Semiconductors
  • Semiconductors
  • Semiconductors
  • Social Media
  • Social Media
  • Social Media
  • Social Media
  • Social Media
  • Social Media
  • Social Media
  • Software
  • Software
  • Software
  • Software
  • Software
  • Software
  • Software
  • Software
  • Software
  • Software
  • Software
  • Software
  • Software
  • Software
  • Software
  • Solar
  • Solar
  • Stock Analysis PDFs
  • Stock Updates
  • Stock Updates (Blogs)
  • Supplychain
  • Supplychain
  • Supplychain
  • Supplychain
  • Supplychain
  • Supplychain
  • Svod
  • Svod
  • Svod
  • Svod
  • Svod
  • Svod
  • Tech Podcast
  • Tech Stock News
  • Tech Stock News
  • Tech Stock News
  • Tech Stock News
  • Tech Stock News
  • Tech Stocks
  • Tech Stocks
  • Tech Stocks
  • Tech Stocks
  • Tech Stocks
  • Tech Stocks
  • Tech Stocks
  • Tech Stocks
  • Tech Stocks
  • Tech Stocks
  • Tech Stocks
  • Tech Stocks
  • Tech Stocks
  • Tech Stocks
  • Technical Analysis
  • Telehealth
  • Telehealth
  • Telehealth
  • Telehealth
  • Testing Equipment
  • Testing Equipment
  • Top Tech Stock News
  • Travel
  • Trends Report
  • Tutorials
  • Uncategorized
  • Updates
  • Updates
  • Updates
  • Video
  • Video
  • Video
  • Video
  • Video Footage
  • VR
  • Webinar Alerts
  • Webinar Alerts
  • Webinars
Proudly powered by WordPress | Theme: iofund by iofund.co.uk.