Skip to content
Logo-main-white.860316a8

I/O Fund

  • Home
  • Free Stock Analysis
  • AI Stocks
  • BEST OF 2025
  • Analysts
  • Nvidia Hub
  • About
    • Case Studies
    • About Us
    • Premium Services
    • Pricing
    • Notable Wins
    • I/O Fund Reviews
    • Media
  • Contact Us

Category: Broad Market Today

Ad Tech Stock Earnings – What to Expect for Q3 2021 Earnings

Posted on October 15, 2021June 30, 2026 by io-fund
Ad Tech Stock Earnings – What to Expect for Q3 2021 Earnings

In this earnings preview, we review key companies in ad-tech to gauge what to look for in the upcoming Q3 earnings reports. Last quarter, ad-tech saw a rebound in ad spend from Covid yet it’s likely we saw the high-water mark for many companies as the ad industry faced extraordinarily low comps coming out of the historic lows of Q2 2020 when Covid led to reduced spend.

Snapchat will be the first among the ad-tech companies to kick-off the Q3 earnings when it reports on October 21st. In the analysis that follows, we give a brief overview of the ad-tech sector and discuss key trends that investors should be aware of heading into Q3 earnings.

Below is a table of ad-tech stocks ranked by their EV/Fwd sales multiples, along with their most recent YoY growth rate, gross and free-cashflow (FCF) margins. Many Ad-tech names are growing strongly, but M&A activity has inflated some growth rates such as APPS and MGNI. Adjusting for acquisitions, APPS and MGNI reported pro-forma sales growth rates of 104% and 79%, respectively. PINS had the strongest organic topline growth at 125%, as international sales at the company surged 227% YoY during Q2.

Top 10 EV / Fwd Revenue Multiples

However, we can see the high-water mark starts to kick in with the upcoming quarter. Looking forward, Digital Turbine is forecast to grow the strongest in Q3, but this is skewed due to the company’s recent acquisitions. FUBO has high expectations heading into Q3 as subscriber growth from the NFL season which started in Q3 should help fuel sales growth at the company.

Top 10 Three-month Forward YoY Growth Rates

The below table ranks the ad-tech stocks that saw the largest one week change in their share price. With Ad-tech earnings on the horizon, the market may be pricing in which stocks it anticipates to perform strongest. Notably, Digital Turbine and HubSpot have been strong all year and have been some of the strongest Ad-tech stocks recovering from the recent sell off in tech stocks. 

Sign up for I/O Fund's free newsletter with gains of up to 1100% – Click here
Click here

We can also see the market continues to question Fubo per the YTD price action below. We’ve written in detail as to why we think the company is stronger than the market realizes due to tailwinds from OTT live sports specifically and the monetization potential from sports betting. We’ve also recently commented on Twitter that Roku is likely to do even better globally than domestically as ad-supported streaming will be preferred over subscriptions in countries with lower GDPs. Considering that the Roku team created the leading operating system in 2008 and has led in the United States for 13 years over Amazon and Google, we think the team is capable of entering new geographies.

Top 10 Weekly Share Price Movement

In the table below, ad-tech stocks are ranked by percentage of change in their forward sales growth estimates over the last 90 days. A rise in growth estimates can lead to a higher multiple, however the market remains in a “wait and see” stage for names such as FUBO and PUBM, as their stocks have declined despite an increase in forward expectations. FUBO has high expectations as sports streaming from the NFL should boost revenues, while PUBM is a relative newcomer to the Ad-tech market and the Street may be waiting for the company to prove it can compete. In general, PubMatic is in a tough place to compete in the tech stack due to the number of competitors on the supply side.

Top 10 Changes in sales growth estimates – last 90 days

Although ad-tech has seen some double-digit declines over the past three months, we do not think this will last for long. Ad-tech is a robust industry that is cash efficient and tends to outperform other sectors in tech. For instance, two of the FAANGs are ad-tech related and there could be more tailwinds for those who hold first-party data as Facebook and Apple duel over third-party ad tracking and measurement. We covered this here.

At the I/O Fund, we have plenty of exposure to ad-tech and are not concerned with any temporary pullbacks.

Update on multiples

Below, I give an overview of topline multiples for the Ad-tech sector. The multiples shown below are calculated by scaling Enterprise Value (market cap + debt – cash) to forward sales. A higher multiple means the company has a premium valuation.

Overall Ad-tech stats:

  • Overall Ad-tech forward median 7x
  • Top 5 Ad-tech forward median 24x
  • Overall Ad-tech forward average 10x

EV/FWD SALES:

Ad-tech valuations peaked during the beginning of the year and have trended down since. The multiple compression has driven the median Ad-tech EV/Fwd sales multiple to 7x, which is below the median 10x multiple that Ad-tech received heading into Q3 earnings last year (2020). If Ad-tech performs strongly in Q3 2021, then the Street may award Ad-tech a higher multiple.  

Sign up for I/O Fund's free newsletter with gains of up to 1100% – Click here
Click here

The I/O Fund has stated that we see the current market as a buying opportunity with an in-depth macro analysis from Portfolio Manager, Knox Ridley. The valuations illustrate that we are nearing the 6 Median EV to Forward Revenue and the 10 Average EV to Fwd Revenue, which barring a black swan event like March of 2020, is low for ad-tech valuations. We to tend not hunt for bottoms, rather we prefer to trim near tops and add to key positions near bottoms. Therefore, for the style of the I/O Fund, the current valuations are a buying opportunity and we sent a recent Roku buy notification to our I/O Fund Members at $309.30.

By bifurcating the data for the top 5 in the chart below, we see the valuations in some names have largely recovered their multiple compressions since the beginning of the year. Snap, The Trade Desk, Hubspot, Roku and Pinterest have the highest valuations. The recovery in these premium valued names suggests that the market believes that these five stocks will likely outperform the rest of the group going forward.

TOP 5 EV/FWD SALES:

Below, we break the valuations into the following buckets:

  • Ad-tech High Growth Median EV to Fwd Revenue 10x
  • Ad-tech Mid Growth Median EV to Fwd Revenue 4x
  • Ad-tech Low Growth Median EV to Fwd Revenue 4x

We can further dissect the change in ad-tech valuations by breaking up the group into high growth (>30%), mid growth (>15% and <30%) and low growth (<15%). The above chart shows that the high-growth Ad-tech stocks were valued higher earlier in the year, as the market may be anticipating a slowdown in ad spend in the near term.

EV/FWD SALES IN GROWTH BUCKETS:


The chart below highlights the large gap in valuations for ad-tech leaders such as TTD and SNAP and the rest of the sector. SNAP and TTD are valued ~400% higher than the median multiple of 7x, while relatively new entrants PUBM and TRMR are valued below the Ad-tech median, at 6x and 4x, respectively.

EV TO FWD SALES Ad-tech UNIVERSE:

We also include a chart based on EV to Fwd sales but this takes into account forward growth expectations. By scaling valuation relative to forward growth, we can more clearly see which companies are cheapest relative to forward growth. Stocks on the right side of the chart below have the cheapest growth, meaning that they are trading at a bargain. Some standouts are SNAP, which fell from being valued 4x the median to just 2x the median once growth was accounted for. Moreover, FUBO is one of the cheapest Ad-tech stocks when considering their forward growth rates. TTD remains the most expensive and APPS and MGNI are skewed by recent acquisitions, meaning that they appear cheaper because of acquired sales.

Growth adjusted EV/Fwd Revenue (EV/Fwd Rev/Fwd Growth)

Finally, the last table we will be discussing are ad-tech operating metrics. The above table shows that the group as a whole is performing well, as the average median growth in the most recent quarter was a strong 81%, however this should be discounted due to the low base period in the prior year due to Covid (discussed above). Looking forward, the market expects ad-tech to continue to grow strongly as the median growth estimate is 38%.

The ad-tech market appears well positioned to continue to do well going forward. Find out which stocks the I/O Fund will be watching heading into Q3 earnings in our Q3 Stock Earnings Preview – What to Expect for 7 Ad Tech Stocks.

Bradley Cipriano and Royston Roche contributed to this article.

Disclaimer: This is not financial advice. Please consult with your financial advisor in regards to any stocks you buy.
Posted in Broad Market Today, Digital Ads, Financial Analysis, Tech StocksLeave a Comment on Ad Tech Stock Earnings – What to Expect for Q3 2021 Earnings

Sentiment Puts a Floor Under this Dip

Posted on October 8, 2021June 30, 2026 by io-fund
Sentiment Puts a Floor Under this Dip

For passive investors, this has been an easy year to be a bull. The market is up over 17% YTD in what is one of the lowest volatility years since 2017.

In 2017, we were in the first year of the Presidential Cycle, the market finished the year up over 19.4% without showing a single 5% dip. For comparison, the S&P 500, on average will experience a 10% or more correction almost every year, and has shown an average annual return over the last 30 years of 10.9%.

Similar to 2017, the S&P 500 is currently up just over 17% and has yet to provide a drawdown greater than 5%. However, unlike 2017, this year is not a broad market uptrend. In fact, the divergence we are seeing with a high number of stocks not participating in this year’s uptrend is important to note.

Big Tech Holds up a Weak Market (Again)

Please reference Knox’s previous analysis here: Upcoming Correction but Still a Bull MarketUpcoming Correction but Still a Bull Market

The above chart shows the price returns of the S&P 500 next to the percentage of stocks in the index that are above their Simple 200-Day Moving Average.

In a healthy market, the two graphs should be trending upward together, which would indicate more stocks across a wider variety of sectors are participating in the bull market. In an unhealthy market, we tend to see the majority of stocks in a downtrend, while the broad market keeps moving higher with narrower leadership. Note the pattern in 2020 – as the indexes makes a new high, the % of stocks above their 200-Day MA makes a lower high. This was a warning that the markets were weakening under the hood. Starting in March of this year the same divergence began, and is still playing out right now.

Sign up for I/O Fund's free newsletter with gains of up to 1100% – Click hereSign up for I/O Fund's free newsletter with gains of up to 1100% – Click hereClick here

Because the weighting of the Index is market cap weighted, which is just price times float, it allows for narrow leadership to hold the market up while the underlying stocks move into a correction. As of now, nine of the top 10 names in the S&P500 are Big Tech. Collectively, they account for 25.18% of the entire index weighting. Some may view this concentration as a negative; however, this concentration in Big Tech is what has allowed for the underlying index to complete a covert and deep correction in 2021, without bringing the market down with it.

The above graph compares some of the most important companies in the US Economy since December of 2020 to now. The red area indicates when these names topped and began their corrections. Many names topped in Dec/Jan of last year while a number of names topped in May/June of this year.

The top row, Microsoft and Apple, collectively account for 11.8% of the S&P 500. The combined weighting of Exxon, Caterpillar, JP Morgan, Walmart, Home Depot and Johnson & Johnson is only 4.97%. This shows how major stocks, as well as multiple sectors, can be in a correction while just a handful of key names remain strong.

2021 Has Tested Even Seasoned Investors

The eye-opening consumer price index (CPI) numbers in February/March announced that inflation was potentially here. This led to the indiscriminate selling of risk-on assets, focused specifically in your high beta names that are priced with future cash flows in mind. 

We saw this as a buying opportunity within a much larger uptrend, which we expressed both publicly and within our premium service. For one, the renewed uptrend within the bond market as well as a collapse in many commodity names was suggesting that inflation fears may be over blown. Also, the technical analysis work that we do on broad markets was further suggesting that we still had higher to go.

Over seven months after the growth sell-off, we still hold true to our original thesis.

We spoke in length about the M2 money supply and why it is key to measuring actual inflation in the economy here. In short, it is the layer of the money supply that filters into liquid assets like money market funds, savings accounts, CDs etc. This is the layer that the FED does not directly control, and it measures actual credit/money entering the economy.

Even with a 34% increase in the M2 money supply, we believe that the two one-time events of excessive global stimulus as well as the re-opening of global economies will likely outweigh the increase in M2 on a meaningful level.  These are two extraordinary events that are not being factored into current CPI numbers. Inflation is likely here, as suggested by the increase in M2, however we do not believe that it will have a meaningful and immediate impact on the current bull market that is underway.

Last year was arguably one of the more extreme anomalies in market history, while this year is forcing investors to address the consequences of global policy decisions. Rising rates and commodity prices, coupled with an unexpected dovish FED, has affected growth in different ways.

Many popular high fliers from last year, are negative for the year, as we see a rotation out of Covid names and primarily into tech stocks that surprise to the upside with strong fundamentals.

At I/O Fund, we raised cash going into the end of August due to the technical analysis that we perform on various broad market indexes. Our Elliott Wave work was suggesting that we were approaching a big top or minor top as the NASDAQ100 approached the 16000 level.

The above scenarios are what we based our broad risk management on in August. The red path had us topping in what would likely be a relatively deep correction, while the blue count had us only in a minor dip, which would be relatively brief. Keep in mind, both scenarios still had us in a much larger uptrend, which we see moving into 2022.

Through our cycle work, we had identified that Aug. 30 – Sept. 7 would likely mark an inflection point. This information coupled with fading momentum and a complete 5-wave pattern (in red), had us raise cash going into the inflection point.

In our August 19th report I stated that It’s my belief that the market is marching towards a large degree correction within a much larger uptrend. Whether that large degree correction has started or not will depend on what supports hold. Below is a visual of what I generally believe is playing out.” In other words, I was leaning towards the red count playing out, and so we prepared accordingly.

However, as we progressed in the initial dip, what had shift in real-time towards the more bullish blue count was a few data points. The primary one being sentiment, followed by seasonality trends and relative strength in key economically sensitive sectors. All of these data points were suggesting that a low was in, or at most, one more minor low was possible.

Sentiment

Implied Volatility vs. Realized Volatility

Prior to big unwinds in the market, we will typically see decelerating implied volatility while realized volatility starts ticking up. In short, sentiment is characterized by a belief that the bull market has much more room to go, which causes an increase in leveraged bullish bets.

On September 9th, with the S&P 500 down just 1.1% from its high, we were seeing an unusually large separation from actual volatility over a 30-day period, and what investors were expecting within the next 30 days.

The S&P 500 had a low realized volatility of just 7.5% while the implied volatility was well over double at 18.12%. What this means is that investors were willing to pay high fees for downside protection before at the very beginning of this drawdown.

On Sept 20th, with the S&P 500 down just over 4% from its high, this trend intensified to an extreme we usually see at major bottoms.

The S&P 500 had over 200% gap between its 30-day realized volatility and the implied volatility going forward. In other words, the premium between what investors were expecting and what was going on had investors willing to pay anything for downside protection.

Put/Call Ratio vs Realized Volatility

Another way to view the unusual level of fear in the market surrounding the recent drawdown is in the Put/Call Ratio vs. Realized Volatility.

The above chart takes the 30-day moving average of the Put/Call Ratio (green) and compares it to the 30 realized volatility of the S&P 500 (Blue). Note the pattern going into the February bear market. As realized volatility was actually increasing, investors couldn’t buy enough calls compared to puts. This is the type of sentiment that usually results in overleveraged long bets, and the unwinding of this leverage is usually what fuels large drawdowns.

Sign up for I/O Fund's free newsletter with gains of up to 1100% – Click hereSign up for I/O Fund's free newsletter with gains of up to 1100% – Click hereClick here

Compare that pattern to today. We are seeing the opposite unfold – as realized volatility continues to trend down, investors are buying more puts. This is signaling that sentiment is rather bearish to cautious as the market continues to climb higher in a low volatility environment.

The Importance of October

From our estimation, October should be strong. September is known as a seasonally weak period in the markets, while October is historically a strong month. This becomes evident when you look at the average monthly returns for the S&P 500 going back in time.

According to the same data, October has historically been a seasonally strong month. However, there is a caveat to how October tends to play out, and it is determined by how the market is trending into this month.

October has historically been a pivotal month in market history. We have seen an outsized number of major lows, and some major tops in the month of October.

The above chart shows the history on major turning points within the month of October. We’ve had 8 bear market/deep corrections bottom in October with only two major tops occurring in the month of October. In other words, how a market is trending into October is a key factor to the year-end trend.

This pattern also seems to play out on smaller scales. In 2019 and in 2020, September proved to also be weak months. We then saw the market find a bottom in October, which led to a year-end rally.

Conclusion:

When you note seasonal trends and historic patterns, coupled with an unusual amount of negative sentiment and the recent relative strength in economically sensitive sectors, we believe a similar trend will unfold into year-end. For this reason, we have been accumulating high conviction names that are showing excellent relative strength. Many of these names are embedded in strong tech microtrends that we anticipate to continue into the foreseeable future.

Disclaimer: This is not financial advice. Please consult with your financial advisor in regards to any stocks you buy.

Posted in Broad Market Today, Market UpdatesLeave a Comment on Sentiment Puts a Floor Under this Dip

Market Update – Webinar Invitation | 09/24/21 @ 1:30 PM PST

Posted on September 23, 2021June 30, 2026 by io-fund

Webinar Invitation: September 24th at 1:30 PM PST (US Time zone)

In this market update webinar, we will discuss the price action and setups for ZM, DOCU, SE, BTC, ZI, SHOP, ROKU

When: Sep 24, 2021 01:30 PM Pacific Time (US and Canada)

Topic: Market Update – Broad Market, ZM, DOCU, SE, BTC, ZI, SHOP, ROKU

Please click the link below to join the webinar:

https://us02web.zoom.us/j/84450009933

Passcode: 13245

Or One tap mobile : US: +12532158782,,84450009933# or +13462487799,,84450009933#

Or Telephone: Dial(for higher quality, dial a number based on your current location):
US: +1 253 215 8782 or +1 346 248 7799 or +1 669 900 6833 or +1 301 715 8592 or +1 312 626 6799 or +1 929 205 6099


Webinar ID:
844 5000 9933

International numbers available: https://us02web.zoom.us/u/keb315YvaK

Posted in Broad Market Today, Stock Updates (Blogs), Webinar Alerts, WebinarsLeave a Comment on Market Update – Webinar Invitation | 09/24/21 @ 1:30 PM PST

Market Update – Webinar Invitation | 09/17/21 @ 2:00 PM PST

Posted on September 16, 2021June 30, 2026 by io-fund

Webinar Invitation: September 17th at 2:00 PM PST (US Time zone)

In this market update webinar, we will discuss the price action and setups for AMD, DDOG, SNAP, LRCX, NVDA, XPEV, ESTC, MDB

When: Sep 17, 2021 2:00 PM Pacific Time (US and Canada)

Topic: Market Update – Broad Market, AMD, DDOG, SNAP, LRCX, NVDA, XPEV, ESTC, MDB

Please click the link below to join the webinar:
https://us02web.zoom.us/j/89678367685
Passcode: 1324

Or One tap mobile :
US:+16699006833,,89678367685#  or+13462487799,,89678367685#

Or Telephone:
Dial(for higher quality, dial a number based on your current location):
US:+1 669 900 6833  or+1 346 248 7799  or+1 253 215 8782  or+1 929 205 6099  or+1 301 715 8592  or+1 312 626 6799

Webinar ID: 896 7836 7685

Posted in Broad Market Today, Stock Updates (Blogs), Webinar Alerts, WebinarsLeave a Comment on Market Update – Webinar Invitation | 09/17/21 @ 2:00 PM PST

Will Dividend Stocks Become the Inflation Trade?

Posted on July 30, 2021June 30, 2026 by io-fund
Will Dividend Stocks Become the Inflation Trade?

Investors were taken by surprise last week when the US consumer price index rose 5.4% year-over-year in June, the fastest pace seen since August 2008. On a monthly basis, it rose 0.9%. Excluding the volatile food and energy prices, while the Core Consumer Price Index rose 4.5% in June, this was the fastest pace since 1991.

Source: YCharts

There is an argument that the recent rise in inflation is temporary. One prime reason is attributed to the supply constraints due to the pandemic. The sudden rise in used cars and trucks accounted for a major portion of the inflation number, and this was mainly due to the global chip shortage, which reduced the supply of new cars. Used cars and trucks rose 10.5% in June from the previous month, when you compare on a yearly basis, prices rose about 45%.

Last week, we discussed in detail technical signals that suggest the market is not currently concerned with inflation. We see this in the new uptrend in bonds and the collapse of certain economically sensitive commodities. The market is shrugging off inflation fears, for now.

You can read our Portfolio Manager’s July Market Update that discusses this in detail here.

We are prepared to shift our investing thesis if the narrative changes. If inflation is not transitory, this reality will show up in price relations first. For example, if bonds continue down while commodities continue up, this could lead to the FED increasing the Fed Fund rate sooner than expected.

Historically, the rise in interest rates has been negative for equities, which ultimately stops the bull market. Some of the possible reasons are when the discount rate increases the present value of future cash flows will be lower. Another reason is that debt servicing costs for companies with high debt will be higher. The exception will be banking stocks which benefit from rising interest rates.

Even if this happens, history tells us that the time to worry is not when the first rate hike happens, but up to 18 months on average after the yield curve inverts. So, even if rates increase ahead of schedule, history tells us that we still have time for the bull market to run.

It’s important to remember that what causes the cascade of events that leads to a bear market, is the FED reacting to rising inflation. So, the sky-high data regarding inflation is nothing to shrug off completely. If inflation numbers do not subside, the FED will have no choice but to raise rates, and we could be looking to invest in an inflationary environment.

Stocks can make solid investments precisely because they beat inflation in the long-term. On a more granular level, the more traditional thinking here is that dividend stocks are ideal during periods of inflation because of the periodic dividend payouts. Dividends also help to fund your increased expenses due to inflation. While growth appreciation stocks are good in the long term, many institutions will see dividend stocks that have reasonable growth as an important hedge. They will also typically view low debt companies with low debt servicing costs as favorable.

Please note: the I/O Fund is a tech growth portfolio that places an emphasis on growth over profits, and for this reason, the I/O Fund does not currently hold stocks for their dividends. Below, we discuss what inflation trades can look like for a more forward-looking discussion.

Dividend Stocks that Institutions Could Favor for an Inflation Trade

Broadcom Inc. (NASDAQ: AVGO) shares rose 50% in the past year. The company’s revenue growth has been strong as it grew at a compound annual growth rate (CAGR) of 16% in the past five years. It also has a very good profit margin which also plays an important role in the long-term stability of dividend payouts.

The company has a dividend yield of 3.00%. It is comfortably above the US 10-year treasury rate of 1.19%. The company has steadily increased its dividends. The free cash flow from which the dividends are paid is also increasing. In the recent earnings call, the company’s CFO, Kirsten Spears mentioned “Relative to capital allocation, first and foremost, we're dedicated to paying 50% of our free cash flows to our shareholders.” In the recent quarter, it had a free cash flow of $3.4 billion and dividends paid were $1.6 billion.

Intel Corp (NASDAQ: INTC) has a dividend yield of 2.45%. The company raised its dividend in January this year. They increased their quarterly dividend by 5.3% to $0.3475/share. The company had a free cash flow of $1.6 billion in the first quarter of the fiscal year 2022. It also had repurchased $2.4 billion of shares and completed the $20 billion repurchase plan announced in October 2019. The management also assured that they are committed to growing its dividend.

Source: YCharts

Will the rise in interest rates be a concern for the ad-tech industry?

Ad-tech stocks typically have low or no debt. One exception is Magnite, which has a debt-to-equity ratio of 1.13. Magnite accumulated debt when it acquired companies in the past year. More recently it acquired SpotX, a deal that will help to double its CTV business. In the words of Michael Barrett, President and Chief Executive Officer, “We believe the combination is transformative because it immediately gives us critical mass and scale in CTV and more than doubles the size of our CTV business”.

Roku has a debt-to-equity ratio of 0.36. The company’s debt is small and it’s coming down. Interest costs were only $742,000 in the recent quarter when compared to $863,000 in the same period last year. Roku’s revenue in the first quarter grew by 79% year-on-year to $574.2 million. It also added 2.4 million incremental active accounts in the quarter to reach 53.6 million. The company had a net profit of $76.3 million when compared to a net loss of $54.6 million in the same period last year.

Source: YCharts

Looking into the stock returns of the ad tech industry, Roku has been outperforming other companies in the past six months. Recently listed companies like PubMatic and Viant Technology had successful initial trading gains but they have not sustained in the recent months.

Secondary Offerings to Raise Cash

After tech’s historic run last year, many companies have benefited from rising stock prices by tapping secondary offerings. Zoom raised $1.75 billion in January this year by pricing 5.15 million shares at $340 per share. It was able to benefit from the strong share price gains due to the remote working boom. The recent offering was about 10 times its IPO price. Previously the company had issued its shares in the IPO at $36 per share in April 2019. Zoom is a debt-free company.

Shopify raised $1.5 billion by offering 1.18 million shares at $1,315 per share in February this year. The company’s share price grew about 175% during the one-year period before the secondary offering. It had benefitted from the shift to online business during the pandemic.

MongoDB recently raised about $889 million by offering 2.5 million shares at $365 per share. The company has a negative debt-to-equity ratio. Its interest expenses are also high, at $3.7 million in the quarter ending April 30 although down from $13.8 million in the previous year. The stock has a three-year return of 510%. 

Source: Ycharts

Conclusion

Many tech companies have low debt right now with many sitting on decent amounts of cash due to raising cash from secondary offerings. The I/O Fund doesn’t own dividend paying stocks as a strategy, per se, yet it’s good to know what kinds of stocks could be favored by institutions should we see inflation haunt the market and consumer spending environment. Specifically, semiconductor companies like Broadcom which continue to have excellent growth and a dividend yield of 3.00% stand out from the list.


Last week, the Portfolio Manager from the I/O Fund spelled out his thoughts regarding inflation fears. In summary, the market’s quiet rotation back into growth stocks and bonds, coupled with the new downtrend in commodities and defensive names, seems to suggest that the market isn’t as concerned with inflation as retail is. You can read this article here.here.

Posted in Broad Market Today, Inflation, Market Trends, Tech StocksLeave a Comment on Will Dividend Stocks Become the Inflation Trade?

July Market Update: Is Inflation Overblown?

Posted on July 23, 2021June 30, 2026 by io-fund
July Market Update: Is Inflation Overblown?

On February 16th, the dynamics of the market shifted as we saw the beginning of a large rotation away from the growth stocks that led us out of the 2020 bear market.  Around the same time, the price of copper rose to levels that we haven’t seen since March of 2013, while the yield on the 10-year treasury moved above a key resistance level that has held since February of 2020. In other words, inflation was officially here.

Pictured Above: Copper and Yields broke out on the same day that growth equities topped

Historically, inflation pressures build towards the end of a cycle, resulting in the bond market selling off. The reason for this is because as the FED raises rates to fight inflation, bonds get priced down. Bonds don’t perform well in a rising rate environment; hence a downtrend in bonds usually begins in anticipation of a rate hike. As bonds get sold, rates go up, making the cost for companies to refinance debts more difficult while at the same time harming future projected cash flows for high growth companies. Eventually, stocks catch up to bonds and a bear market begins.

Ultimately, inflation begins the cascade of reactions that leads to a recession, hence the steep selloff in richly valued growth stocks. The real question today is whether the inflation is transitory, as the FED and many economists are claiming, or is it here to stay? If it is truly here to stay, the FED will have no choice but to raise rates, cutting off the bull market. On the other hand, if inflation is transitory, then the recent drawdown in high growth names may have presented a buying opportunity if the bull market resumes.

The popular narrative tends to side with “inflation is here” and “the FED will have no choice but to raise rates soon.” This is backed not only with countless anecdotal claims, but real data. For example, June’s CPI came in at 5.4% YoY which exceeded expectations. This has caused analysts and pundits to point out that the last time we saw a rise this high was in 2007. Just as alarming, housing prices are now exceeding 2007 levels.

Source: Bloomberg

This is compelling evidence to support the popular narrative that inflation is here, and likely signals the end of the bull market. However, I believe the markets are a much greater predictor of future economic outcomes. If we monitor the price relations with intermarket analysis (see below), the market is telling us that inflation fears are likely overblown. Even if the trend in inflation continues, we could still see an environment like 1999 where inflation, yields, commodities and equities all advance together.

Intermarket Analysis

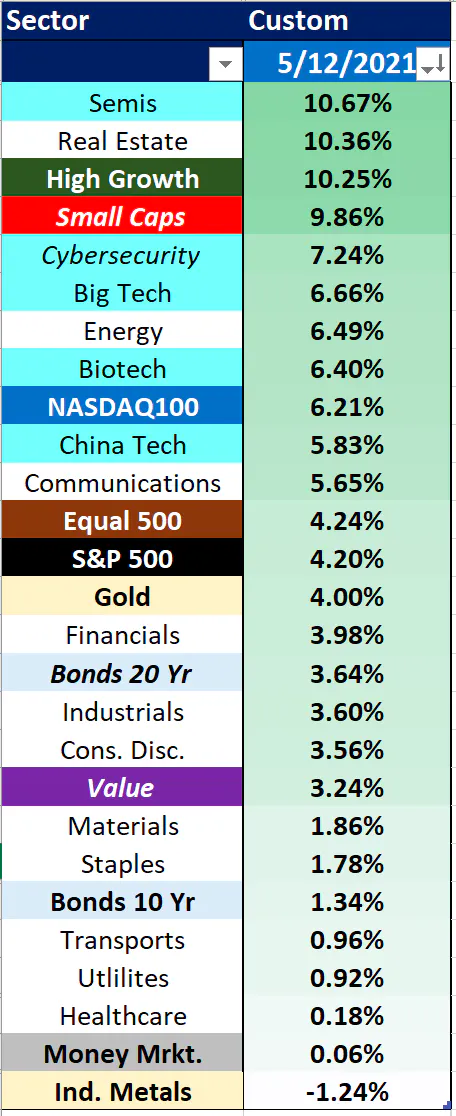
On May 12th, the equity markets appear to have hit a significant bottom. Following this low, what we have seen is a quiet rotation out of commodities and value stocks, and back into risk-on assets. Across key sectors, high growth and green tech is up 20% while big tech and cloud is up 15%. Meanwhile, value is up just over 1% while commodities are in negative territory.

 Since the May 12th bottom, we have seen beaten down growth stocks take back their leadership role in the market – this is a thesis that we held, positioned for and stated publicly.  The I/O Fund has initiated numerous buys since the May 12th bottom, after building a reasonable cash position going into the selloff in February.

 Joining growth in a renewed leadership role is bonds. We are seeing bonds in a new uptrend, specifically longer duration treasury (+20 years), which are outperforming the S&P 500 since the May 12th bottom.

 If we look a little deeper, copper topped on May 12th, the same day that growth stocks bottomed.  Also, on May 12th bonds were confirming their first higher low, which was starting a new uptrend. In short, the bond market was signaling that inflation fears were either overblown, or that they may not be significant enough to force rate hikes.

Pictured Above: The intermarket relationship between copper, bonds and growth stocks from the May 12th bottom

Further evidence that inflation fears may be overblown are found in the recent behavior in lumber. The price of lumber has been the rally cry for investors concerned about inflation. Historically, not a speculative commodity, lumber saw a roughly 180% increase YTD before peaking on May 10th. Since the peak, prices have collapsed by roughly 65%.

This puts the growth in lumber prices at negative for the year, which is rare for a commodity because it’s not speculative. This is further backed by the price of copper. After a roughly 35% rise in prices, from its May 10th peak, the price of copper has decreased by 10%.

 The collapse in economically-sensitive commodities is also not typically what you’d expect in an inflationary environment. Also, it’s worth pointing out that the 10-year yield is testing the very breakout zone that triggered the growth sell-off.

Pictured Above: bonds, copper and the 10 year yield are almost back where they were before the February 16th rotation began.

As of now, Bonds have broken out above the February 16th resistance with the 10 year yield only 7% away from reclaiming the February 16th region and copper 11% away. If yields and copper follow bonds, and reset the dynamics that lead to the growth rotation, it would suggest that growth stocks could continue their uptrend. As of now, high growth stocks are about 31% below their high.

Correlations and History

I’d also like to suggest that even if the 10-year yield and copper does hold the February 16th breakout zone, and continues to move up, it doesn’t necessarily mean that growth will continue its downtrend. In today’s market, it is now believed that growth stocks simply cannot go up with yields and commodities with inflation on the rise. However, if we look through history, this is simply not the case.

 The chart above compares the NASDAQ100 with copper and the yield on the 10 and 20-year government bonds between 1998 through 2000. Red indicates a downtrend and green indicates an uptrend. Note how all four assets participated in an uptrend in unison from February 1999 – December 1999. These assets remained correlated, and this was during a rising rate environment with elevated inflation.

It’s also worth noting that in 1999 copper topped first, then yields, followed by equities. The drop in copper and yields would be considered a boon to equities today, but this was actually a warning in 1999/early 2000. When assets correlate, it’s good to take notice as history tends to rhyme.

Levels to Watch for the NASDAQ100 and S&P500

In our last market report, we identified the 14080 region as a likely breakout zone for the NASDAQ100.

On June 22nd, the breakout was confirmed and we have seen a move up roughly 5%. We’ve also publicly identified that we believe the NASDAQ100 is targeting the 16000 before we’d potentially see a deeper correction.

With the breakdown in the S&P500 on Monday, July 19th, this threatened to end this target earlier than expected. The recovery since has halted the early correction in the broader markets, and setup some clear levels for us to monitor.

The above chart outlines the levels that we are watching. These are the potential outcomes I see playing out:

  • Even with the strong bounce off the recent lows, we are not out of the woods yet. Until we can reclaim all-time highs, the current bounce could be a corrective bounce in a deeper correction. If we do see another leg lower, I’m expecting the 14200 level to hold, setting up a short correction in a much larger uptrend.
  • If the bounce continues and we can move past the 14985-14900 region, we can resume our move to the 16000 region before a larger correction unfolds.
  • The lowest probability scenario is that the current correction breaks down below 14080. If this support breaks, it will signal that we are in the larger correction earlier than expected.

We believe that any correction is part of a much larger uptrend. We expect much higher prices before the secular bull market that started in March of 2009 end, and that the current selloff in growth has provided a remarkable opportunity to buy some of most innovative, and fastest growing companies at a relative bargain.

Regardless of what scenario, or variation of a scenario plays out, the above information provides context so that emotions do not dictate our investments.

Posted in Broad Market Today, Inflation, Tech StocksLeave a Comment on July Market Update: Is Inflation Overblown?

Nasdaq100 Levels to Watch for the Next Leg Higher

Posted on June 11, 2021June 30, 2026 by io-fund
Nasdaq100 Levels to Watch for the Next Leg Higher

Being a contrarian in tech investing has been a rewarding strategy over the last 5 years. Believe it or not, as far back as 2016, the contrarian position in tech was to remain a bull. Each year since, floods of articles presented the popular thesis that the “tech bubble” was about to burst (2016, 2017, 2018, 2019, 2020, 2021).

For those that remained a contrarian, the cumulative returns of the NASDAQ100 since 2016 has been ~ 207% returns. Meanwhile, the average drawdown per year since 2016 was an eye popping 17%, while the average annual return for the year was about 21%.

Only those who ignored the talk of a bubble participated in the epic run that has resulted in the Nasdaq100 driving forward some of the world’s most valuable companies. Which leads to another point: analysts continually and consistently misunderstand tech in the early days of a company’s rise. Using value metrics to build the case for a bubble, these same analysts have gone silent when that bubble refuses to cooperate with soothsayer predictions.

Once again, this year is witnessing a rotation out of tech growth, as more articles claim that this is the actual popping of the tech bubble – for real, this time. Although I do believe the market will experience a true secular bear market at some point in the future, more importantly, I believe the market is setting up first for what appears to be the next leg higher.

I also believe that tech, as well as growth, will resume its lead in the next leg higher. I outline my reasons below.

1) Understanding Tech and What it is Telling us Now

From September of 2019 through January of 2020, the market narrative was that cloud computing was over stretched, resulting in a severe value rotation. At that time, we were hearing that the stocks in this sector had price/sales ratios greater than many of the tech stocks during the dot.com bubble.

A fair representation of these companies can be found in the ETF with the ticker symbol CLOU. This is a pure play on the cloud microtrend and was overweight many of the richly valued tech darlings of the time, such as Zoom, Shopify, Crowdstrike – just to name a few.

Despite cloud being “overstretched” with “dot-com like valuations,” from the February peak to the March low, CLOU saw a 32.94% drawdown, compared with the S&P500 that saw a 35.63%. Also, worth noting, CLOU finished the year up 77.9% while the S&P500 finished the year up 18.4%.

In other words, stocks with little to no earnings, and a price/sales ratio ranging between 20 – 40, provided more protection to investors during the March ’20 bear market than the value oriented broad markets. The reason behind this phenomenon is either ignored or shrugged off as an anomaly; however, understanding why this occurred is the type of information that would help one to identify companies like Amazon and Google in early stages, despite their rich valuations.

Beneath the negative earnings, and price/sales ratios well into the double digits, are powerful microtrends that can scale globally. Beth Kindig of the I/O Fund presciently wrote an article in 2019 stating that Cloud Computing would be a good safe haven in an economic contraction, even with bubble-like valuations.

“My prediction is this may be one of the last cycles when tech is considered less safe than value stocks. As the market will find out (the hard way), cloud software is actually very safe. It is insulated from trade wars and overseas manufacturing issues. It reduces costs for enterprises, which is ideal for a recession.”

Her thesis was simply that the cloud microtrend was still in the middle of its expansion, and the very nature of migrating to the cloud makes enterprises more efficient as well as reduces costly IT overhead, which can help them survive slowing GDP.

Furthermore, we are seeing companies within cloud grow YoY revenues at rates that are historical records. For example, in recent reports: Shopify grew YoY revenue by 110.4%, Zoom by 191.4% (this is after 3 consecutive quarters of greater than 350% growth), Snowflake grew by 110% and Crowdstrike grew by 70%.

All of these companies came in above consensus in the most recent quarter while most raised forward guidance. We are now lapping the most critical quarter for tougher comps from Covid and we think in the next couple of months, the words “tougher comps” will fade from memory as the better term will be “sustained growth.”

2) Technical Signals

Where is the money from growth flowing?

Since the February top in 2021, we have seen a large rotation from growth names into value. Some have posited that the growth trend is over, and the era of value is set to lead. To get a clue as to whether this thesis is correct, I think analyzing the flow of money from tech is key.

On a simple 3-month relative return, which takes us back to the start of the correction, we can see money flowing from high growth sectors and into value sectors.

However, if we dig down a little deeper, the money seems to be flowing into early-mid cycle sectors, such transportation, financials, industrials, materials. The standard late-cycle sectors, such as utilities and consumers staples, appear to be lagging, which suggests that the market is more likely positioning for a move higher than preparing for a protracted drawdown.

I further believe that the market put in an important bottom on May 12th. Below is a chart showing that since the May 12th bottom, quietly, we’re starting to see a rotation back to high growth names, and the selling of value as well as commodities. 

It appears that underneath the moderate price movements in the broad market, we’re beginning to see a rotation back into growth names. We will need to see this trend continue, but so far, if the bottom is in, the up days in the market are suggesting a continuation of growth outperformance.

Breakouts Around the World

Just like in late 2016, we are seeing an abundance of analysts suggesting that the major top is in or we are close. This would be followed by a major and protracted bear market. Also, just like in late 2016, this thesis is not being supported by the price action in major markets around the world.

The above chart illustrates the breakouts we are seeing across the board: Global Blue Chips, Emerging Markets, Europe, India, even Small Caps are showing strength, as is China. These are typically not the intermarket signals we see just prior to a major bear market.

Strong Market Breadth

Market breadth is a technical measurement that measures the number of companies participating in a trend. In other words, if the number of companies that are participating in a broad market uptrend is growing with the market, then this is a healthy uptrend.

On the other hand, leading into most corrections, we see market breadth decreasing while the broad market continues higher. If fewer stocks are holding the markets up, this is typically a bad sign for an uptrend.

We use many methods to measure market breadth, but the simplest and oldest way is the advance decline line. Simply put, this indicator plots the difference between the number of stocks in the market that are increasing in price vs. the ones that are decreasing.

If we compare this indicator to the S&P 500, we can see an instance leading up to the September selloff in 2020 where the advance/decline line was signaling weakness, while the market continued higher. Today, we are not seeing this. In fact, the advance/decline line is breaking out to new highs before the market. This is indicating that more stocks in the market are moving up vs. down, and when we see this indicator breaking out ahead of price, more time than not, price follows.

The NASDAQ100

Most importantly, the NASDAQ100 (NDX) appears to be setting up for a large breakout move.

NDX is approaching a major resistance zone in blue on the chart (between 3800-4080). The upward-trending, zig-zag pattern into this resistance is typically a bullish pattern. Also, note how the price has respected the upward sloping trendline, which is highlighted with the dashed green line. This is also a promising sign, and gives us a clear level to work with regarding any coming weakness.

The Counter Argument

With as many bullish signals as we are getting, the NASDAQ100 must confirm the next leg higher with a breakout above 14080. Tech is simply too important of a sector both in the economy as well as being a large percentage of the broad market. If NDX fails to break out, and instead breaks below major support at 13200, we could see another correction before we can get another shot at a breakout setup.

Also, the transportation index is flashing a potential warning that this breakout could be premature.

 Historically, the transportation index tends to lead the market. Because global commerce relies on transportation, a slowing down in this sector tends to signal a slow-down in the economy. Also, because equities are usually looking ~6 months out, the price of the transportation index can be a strong leading indicator.

As of today, the Dow Jones Transportation Index (DJT) is trending down while the rest of the major indexes are trending up. Because of the tight consolidation, this trend could change in an instant; however, I would not get too concerned unless supports break across the board in the U.S markets.

Supports to watch

Dow Jones Transportation Index – 15250

Dow Jones Industrial Index – 34300

NASDAQ100 – 13200

Regardless of the bullish signals and global breakouts we identified, if the above supports breakdown, we will likely look to hedge our portfolio over the short to intermediate-term time frame. We believe the outlook, as of now, is signaling a higher probability of another leg higher. However, until price agrees with our thesis, the I/O Fund remains cautiously bullish.

Posted in Broad Market Today, Bull Market, Market Trends, Stock Updates (Blogs)Leave a Comment on Nasdaq100 Levels to Watch for the Next Leg Higher

Q1 Earnings Analysis for Etsy, Square, and Palantir

Posted on May 27, 2021June 30, 2026 by io-fund
Q1 Earnings Analysis for Etsy, Square, and Palantir

As earnings season winds down, we review earnings reports for popular growth tech stocks Etsy, Square, and Palantir. 

Regarding Etsy, e-commerce valuations have come down as a result of the correction in growth tech, and when compared with other e-commerce stocks that are facing tougher comps, Etsy is showing slowing projected growth of 32% this year.

We also discuss Square, a fintech stock whose topline beat was driven by a surge in Bitcoin revenue. Excluding Bitcoin revenue, the company still reports decent growth of 44%. We look at Square from both perspectives below.

Palantir is guiding for Q2 revenue growth of 43%, but to prove product-market fit, the company needs to show higher growth in commercial revenue. Beth Kindig previously wrote about this in Forbes when she analyzed the product at its IPO.

Etsy: 

Like many beneficiaries of Covid-19, e-commerce benefitted from the economic shutdown through an acceleration in revenue. In 2020, consumers spent approximately $861B online with U.S. retailers, up 44% YoY, nearly three times the growth in 2019 at 15.1%, according to estimates from Digital Commerce 360. 

E-commerce valuations peaked for the industry in early 2021 as investors worried about more difficult comps. As you can see from the chart below, Etsy’s valuation peaked at 15x forward revenues, based on data from YCharts. As of May 25, Etsy was trading at 9x forward revenues.

e-commerce companies ev to revenues (forward) chart

Etsy is projected to show slower revenue growth of 32% this year than popular e-commerce stocks like Sea Limited, 89%, Mercado Libre, 89%, and Shopify, 51%. Etsy is facing noticeable deceleration from its 111% YoY revenue growth in 2020.

Revenue growth for Etsy is on par with BigCommerce, which is valued at 16x revenue versus 9x revenue for Etsy. Meanwhile, Etsy is already profitable with 74% gross margins and projected EPS growth in 2021 of 12%. The company also beat on its top and bottom lines with 141% YoY revenue and EPS of $1.

e-commerce stocks metrics

GMS represents total sales and is an important metric for e-commerce stocks. In Q1, consolidated gross merchandise sales (GMS) for Etsy was up 132.3% YoY to $3.1B, while Etsy marketplace GMS was up 144.1% YoY to $2.9B. Etsy estimates that stimulus payments drove approximately 8% of GMS growth in Q1. In its guidance for Q2, Etsy is estimating consolidated GMS growth of 5% to 15% YoY.   

In Q1, the Etsy marketplace reported the highest growth rates for active buyers, repeat buyers, and habitual buyers since becoming a public company, acquiring 16.3M new and reactivated buyers. Active buyers grew 91% YoY; repeat buyers who made two or more purchases in the last year grew 114%; while habitual buyers, the company’s most loyal consumers, grew more than 205%. 

Conclusion

Like many e-commerce stocks, in 2020 Etsy benefited from Covid-19 through an acceleration in revenue. The company is now facing tougher comps and is guiding for decelerating growth. E-commerce valuations have contracted, and Etsy is not the cheapest e-commerce growth stock we analyzed above. 

As of May 25, Etsy was trading at 9x forward revenue versus 6.36x for Farfetch and 7.78x for Poshmark, which we previously covered. Unlike other popular e-commerce stocks, Etsy is profitable with a gross margin of 74%, and projected revenue and EPS growth in 2021 of 32% and 12% respectively.


Square:

Covid-19 accelerated the trend towards digital payments, with more than 70 million transactions being processed globally in 2020, representing growth of 41% YoY, according to a recent report from ACI Worldwide and GlobalData. 

The value of those transactions rose 32.8% YoY to $69T, while the share of digital transactions was 9.8%, up from 7.6% in 2019. 

Digital payments are nascent with plenty of room for growth, according to the report. 

top 10 countries by number of digital transactions in 2020

Digital transactions have a projected CAGR of 12% by 2025, with the fastest growth of digital payments from 2020 to 2025 in Croatia, 374.4%, Columbia, 112.7%, Malaysia 83.9%, Peru, 74.4%, and Finland 71.4%. 

North America is expected to be the fastest growing region, with a CAGR from 2020 to 2025 of 36.5%.

Square, a popular fintech stock, allows users to trade Bitcoin via its mobile application. Square’s Cash App has outpaced PayPal’s Venmo in quarterly downloads every quarter since launching Bitcoin trading in Q4 2017, based on data from Sensor Tower. 

cash app & venmo app quarterly downloads

Square reported Q1 earnings May 6, beating on the top and bottom lines, driven by a surge in Bitcoin revenue. Revenue of $5.06B, up 266% YoY, beat by $1.73B. Excluding bitcoin, total net revenue was up 44% YoY to $1.55B. 

 Cash App revenue was $4.04B, up over 650% YoY, with gross profit of $495M, up 171% YoY. Cash App generated Bitcoin revenue of $3.51B with gross profit of $75 million. Excluding Bitcoin, Cash App generated revenue of $529M, up 139% YoY.

Gross profit grew 79% YoY to $964M. Seller generated revenue of $1.02 billion, up 19% YoY, and $468 million of gross profit, up 32% YoY. 

To bring in new customers, last March, Square began offering Cash App users the ability to send Bitcoin for free. During the quarter, Square also integrated Square Loyalty into Cash App, which it says is “a flywheel for seller and buyer discovery, engagement, and retention.” 

Square officially launched its industrial bank, Square Financial Services, last March. It is expected to launch business checking and savings accounts, according to a recent report. 

Excluding Bitcoin revenue, Square trades at a premium compared to peers PayPal, Fiserv, and Shift4. However, for 2021, Square is projected to grow revenue 115% YoY and EPS 80% YoY, which is higher than other fintech stocks. Gross margins for Square are lower than its competitors, as Bitcoin boosts revenue but reduces gross margins. 

fintech companies metrics

Conclusion 

Moving forward, Square faces increasingly difficult comps and trades at nearly 16x forward revenue, which is a premium compared to peers and related to its higher revenue growth.


Palantir:

Total commercial revenue grew 19% YoY to $133M, while US commercial revenue grew 72% YoY. Commercial growth was more muted due to the ongoing impacts of Covid-19, including in Europe, according to the report.

Palantir is continuing to make progress on commercial customer growth, according to the report. CEO Shyam Sankar struck a bullish tone, reporting a substantial increase in new leads: 

“We see strength and forward looking indicators and customer interest,” he said. “Since the beginning of February, qualified commercial opportunities in the US and the UK are up 2.5 times. Active commercial pilots across the business have more than doubled and opportunities across the US and UK government continue to develop at pace.” 

Right now, the closest competitor to Palantir is Semantic AI, a private company headquartered in San Diego, but more competitors are likely being developed in the startup ecosystem. We cover this and more in a previous write-up by Beth Kindig here.

Last April, Palantir demonstrated Apollo for Edge AI. The product is now live and takes a “pioneering approach” to AI using micro models, Sankar said: 

“Apollo for Edge AI is the next evolution to transform AI into alpha, enabling customers to train, manage and deploy multiple independently versioned chained models to the Edge with ease,” he said. 

Below we compare Palantir with other high growth tech stocks. While Palantir has healthy gross margins of 78%, projected 2021 revenue growth is lower than growth tech stocks like DDOG, SHOP, and ZS, which also trade at valuations under 30x. 


palantir compared to other high growth tech stocks

Conclusion

Although Palantir is guiding for revenue growth of 30% or more through 2025, we believe the company will needs to do a lot to execute in the Commercial market against the thriving AI startup ecosystem. However, it may take a few years before AI startups can effectively compete against Palantir. The number to watch will be commercial revenue growth, which was low at 19% this past quarter. Without more growth here, the product may not show signs of product-market fit in the commercial sector.   

Disclaimer: The author, Jessica Ablamsky, owns shares of Etsy and Square. The content in this article is intended to be used for informational purposes only. The author has not received any compensation from any third party or company discussed in this article. The content is the expressed opinions of the author and is intended for educational and research purposes. Any thesis presented is not a guarantee of any particular stock’s future prices, so please factor this risk into your own analysis. It is very important that you do your own analysis before making any investments based on your personal circumstances. The author is not a licensed professional advisor. Please seek counsel form a licensed professional before acting on any analysis expressed in this article, to see if it is appropriate for your personal situation.

Posted in Broad Market Today, Earning UpdatesLeave a Comment on Q1 Earnings Analysis for Etsy, Square, and Palantir

The importance of the NASDAQ100, and Levels to Watch

Posted on March 25, 2021June 30, 2026 by io-fund
The importance of the NASDAQ100, and Levels to Watch

 Long term technical signals suggest the current selloff is a buying opportunityLong term technical signals suggest the current selloff is a buying opportunity

Coming out of the 2008 Financial Crisis, we saw a shift from value to growth for the first time since the 90s. Growth stocks took the lead and have been the general theme of the current secular bull market that we are in. With a multitude of tech focused microtrends like the internet, mobile, social media, e-commerce, now cloud and soon to be 5G and AI, the tech sector has led growth stocks. 

From a broad market perspective, the NASDAQ100 (NDX), and index of predominantly large cap stocks, has been the most important index to track within the current cycle. It has led the broad market into and out of almost every major correction since this bull market began.  

This pattern has even continued since the quick bear market in March of 2020. From peak to trough, while the S&P 500 saw a 35.40% drawdown, the richly valued NDX only saw a 30.50% drawdown. Since the March 23rd low, we have seen a consistent trend where the NASDAQ100 has led us into each correction and also bottomed before the S&P 500. 

However, since the recent correction began on February 16th, we have seen a meaningful shift from growth to value. Where the DOW is at new highs, the S&P 500 and DOW Transports are down less than 2%, while the NASDAQ100 is still about 7% away from new highs.  

This is a meaningful rotation, which we see as healthy. The microtrends in tech are not over or at the end of their cycle, regardless of stock prices. Also, we want to see as many sectors and stocks participating in this bull market, which is happening. 

Considering the importance of tech’s leadership, as well as the overall weight of tech within the S&P 500, which currently sits at about 24%, without the NASDAQ 100 participating in new highs, I would consider any bottom to be suspect. For this reason, we believe tracking the NASDAQ100 to be crucial right now in order to glean broad market cues. 

I/O Fund has been preparing for a correction since late February. We built up a nice cash position, which we were vocal about with our readers as well as on Twitter (here here here). We also added a series of hedges prior to the selloff, and have recently added them back due to the possibility of a lower low.  As of now, the long-term technical signals, and trend is still up. This suggests the current selloff is a buying opportunity, which we have been taking advantage of. 

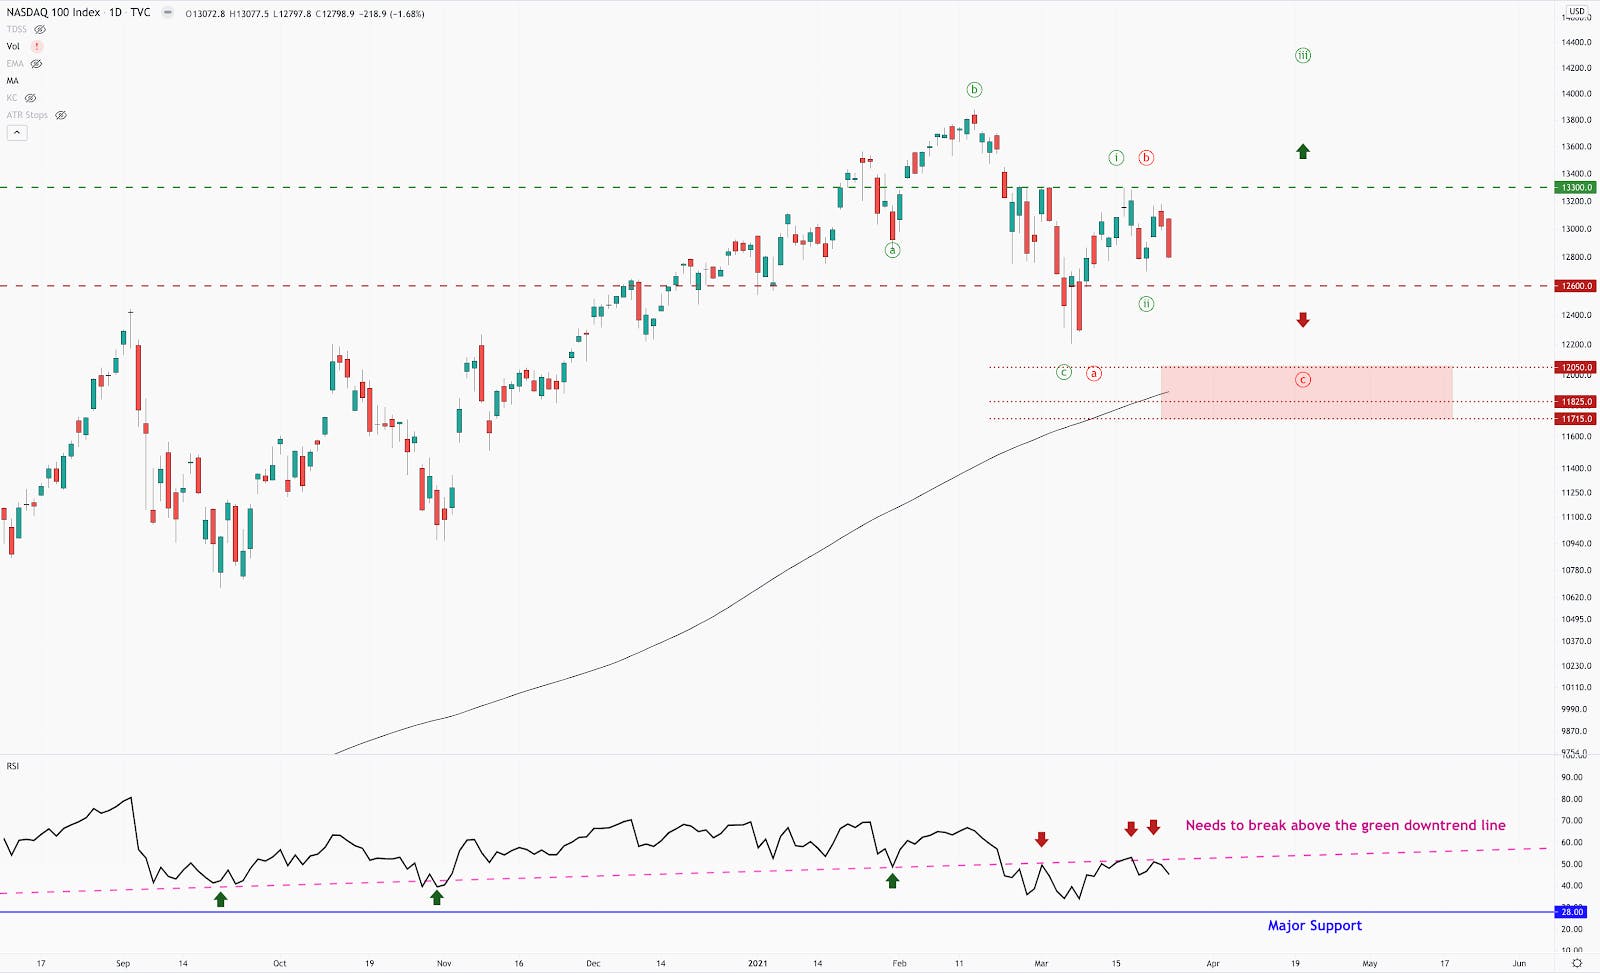
NDX: Levels to Watch 

From a technical perspective, there are two scenarios we are tracking:

  1. The correction is over. For the green count in the chart above, we finished the final leg in the March 5th correction. If NDX holds 12,600 and we see a breakout above 13,300, the low is likely in for this correction. To confirm this scenario, we need NDX to breakout above 13,300, at which point our small hedge will come off.
  2. NDX makes a new low. If NDX breaks 12,600, that would put us in the red count. This count has us in the final leg of the correction, with a potential bottom at 11,715 to 12,050. 

Regardless of what path NDX takes, we view this pullback as a buying opportunity and when the correction is complete we expect the uptrend to resume. We have been building key positions as we feel you can’t time the market and you most certainly can’t time a bottom.

There are many tools we use to guide our entries as well as risk management. One is the RSI, which I believe will be a key technical indicator to focus on based on the pattern in the daily chart. The trendline that was acting as support has become strong resistance. NDX needs to break back above the trendline before we can call this correction over. Furthermore, NDX has major support at the blue line. This was the final capitulation point for the March 2020 lows. If NDX reaches that level, we will take it as a strong buy signal. 

Disclaimer: Beth Kindig and the I/O Fund currently owns shares of TSLA. The content in this article is intended to be used for informational purposes only. The author has not received any compensation from any third party or company discussed in this article. The content is the expressed opinions of the author and is intended for educational and research purposes. Any thesis presented is not a guarantee of any particular stock’s future prices, so please factor this risk into your own analysis. It is very important that you do your own analysis before making any investments based on your personal circumstances. The author is not a licensed professional advisor. Please seek counsel form a licensed professional before acting on any analysis expressed in this article, to see if it is appropriate for your personal situation.


Posted in Broad Market Today, Market Trends, Tech StocksLeave a Comment on The importance of the NASDAQ100, and Levels to Watch

Q4 Earnings Analysis for Shopify, Roku, Fiverr And Palantir

Posted on March 4, 2021June 30, 2026 by io-fund
Q4 Earnings Analysis for Shopify, Roku, Fiverr And Palantir

In my latest Forbes article, I cover the 2020 Q4 earnings for Shopify, Roku, Fiverr and Palantir. More importantly, we explain why tech stocks have been selling off recently despite some healthy earnings reports.

We discuss key points in the earnings reports from leading e-commerce software company Shopify (NYSE:SHOP), a company that’s not sitting stagnant by any means. We review Shopify’s product road map and how the company continually innovates to maintain its lead. The company grew revenue 94% YoY to $978M, topping consensus estimates by $64M (7%). Adjusted EPS of $1.58 beat estimates by $0.37.

We also discuss Roku (NASDAQ:ROKU) and why CEO Anthony Wood does not believe his industry has seen a pull forward from COVID-19 but rather a structural shift that benefits AVOD and programmatic CTV ads long term. In my previous analysis on Forbes, I had pointed out that Roku’s true market is pay-TV advertisers (rather than cord cutters). This was echoed on the recent call (nearly verbatim). Management also explained why Peacock and HBO are not truly competitors but rather increase the pool of customers for Roku.

Moreover, driven by strong advertiser demand, Roku beat on revenue and earnings when it announced Q4 results Feb. 18 with 58% growth year-over-year and guided for 51% growth for Q1 2021.

Fiverr (NYSE:FVRR) is a stock that has seen phenomenal gains of more than 800%. We review this company’s growth potential as a gig economy leader with the recent launch of its subscription service. The online freelance marketplace platform beat on revenue and earnings as it closed out a breakthrough quarter in the company’s history.

Lastly, we talk about Palantir (NYSE:PLTR). The company is guiding for 30% growth over the next five years which didn’t match its valuation going into earnings. Under the hood, the commercial accounts growth was a paltry 4% although perhaps the recent partnership with IBM (NYSE:IBM) will help strengthen the commercial customer base.

Palantir also announced Q4 results Feb. 16. Revenue grew 40% YoY to $322M, beating consensus estimates by $21.02M. Net loss of ($0.08) per share missed estimates of ($0.02), according to Bloomberg, despite the net loss improving from ($0.29) per share for the same period last year.

Read the Full Article at Forbes

Posted in Broad Market Today, Earning Updates, Tech StocksLeave a Comment on Q4 Earnings Analysis for Shopify, Roku, Fiverr And Palantir

Posts navigation

Older posts
Newer posts

Recent Posts

  • The IPO Glut of 2020: Why Valuations Have Gone Too Far
  • Zoom Discusses Two Important Catalysts In Q1 Earnings
  • Three Risk Management Tools the I/O Fund Offers
  • Micron Is Up 900%. Here’s Why the AI Memory Trade May Still Have Room to Run
  • Credo: Reliability Leader Aggressively Moves into Optics

Recent Comments

No comments to show.

Archives

  • June 2026
  • May 2026
  • April 2026
  • March 2026
  • February 2026
  • January 2026
  • December 2025
  • November 2025
  • October 2025
  • September 2025
  • August 2025
  • July 2025
  • June 2025
  • May 2025
  • April 2025
  • March 2025
  • February 2025
  • January 2025
  • December 2024
  • November 2024
  • October 2024
  • September 2024
  • August 2024
  • July 2024
  • June 2024
  • May 2024
  • April 2024
  • March 2024
  • February 2024
  • January 2024
  • December 2023
  • November 2023
  • October 2023
  • September 2023
  • August 2023
  • July 2023
  • June 2023
  • May 2023
  • April 2023
  • March 2023
  • February 2023
  • January 2023
  • December 2022
  • November 2022
  • October 2022
  • September 2022
  • August 2022
  • July 2022
  • June 2022
  • May 2022
  • April 2022
  • March 2022
  • February 2022
  • January 2022
  • December 2021
  • November 2021
  • October 2021
  • September 2021
  • August 2021
  • July 2021
  • June 2021
  • May 2021
  • April 2021
  • March 2021
  • February 2021
  • January 2021
  • December 2020
  • November 2020
  • October 2020
  • September 2020
  • August 2020
  • July 2020
  • June 2020
  • May 2020
  • April 2020
  • March 2020
  • February 2020
  • January 2020
  • December 2019
  • November 2019
  • October 2019
  • September 2019
  • August 2019
  • July 2019
  • June 2019
  • May 2019
  • April 2019
  • March 2019
  • February 2019
  • January 2019
  • December 2018
  • November 2018
  • October 2018
  • September 2018
  • August 2018
  • July 2018
  • June 2018
  • May 2018
  • April 2018
  • February 2018
  • January 2018

Categories

  • 5G
  • About
  • Accounting Tips
  • AdTech
  • Ai Platforms
  • Ai Platforms
  • Ai Platforms
  • Ai Platforms
  • Ai Platforms
  • Ai Platforms
  • Ai Platforms
  • Ai Platforms
  • Ai Platforms
  • Ai Platforms
  • Ai Platforms
  • Ai Platforms
  • Ai Platforms
  • Ai Platforms
  • Ai Platforms
  • Ai Platforms
  • AI Stocks
  • AI Stocks
  • Analysts
  • Application Monitoring
  • Application Monitoring
  • Applications
  • Applications
  • Applications
  • Applications
  • Applications
  • Applications
  • Applications
  • AR
  • Audit Reports
  • Autonomous Vehicles
  • Autonomous Vehicles
  • Autonomous Vehicles
  • Autonomous Vehicles
  • Autonomous Vehicles
  • Autonomous Vehicles
  • Autonomous Vehicles
  • Avod
  • Avod
  • Battery Charging
  • Bear Market
  • Bitcoin
  • Bitcoin
  • Bitcoin
  • Bitcoin
  • Bitcoin
  • Bitcoin
  • Bitcoin
  • Blockchain
  • Blockchain
  • Blockchain
  • Blockchain
  • Blockchain
  • Blockchain
  • Blockchain
  • Broad Market Today
  • Bull Market
  • Bull Market
  • Chainlink
  • Chainlink
  • Chainlink
  • Chainlink
  • China Stocks
  • Cloud
  • Cloud Infrastructure
  • Cloud Infrastructure
  • Cloud Infrastructure
  • Cloud Infrastructure
  • Cloud Infrastructure
  • Cloud Infrastructure
  • Cloud Infrastructure
  • Cloud Platforms
  • Cloud Platforms
  • Cloud Software
  • Cloud Software
  • Cloud Software
  • Cloud Software
  • Cloud Software
  • Cloud Software
  • Cloud Technology
  • Company
  • Company
  • Console Gaming
  • Console Gaming
  • Console Gaming
  • Consumer
  • Consumer
  • Consumer
  • Consumer
  • Consumer
  • Consumer
  • Consumer
  • Consumer
  • Consumer
  • Consumer
  • Consumer
  • Consumer
  • Consumer
  • Consumer
  • Consumer Tech
  • Corrections
  • Crypto Investment
  • Ctv
  • Ctv
  • Ctv
  • Ctv
  • Ctv
  • Ctv
  • Ctv
  • Ctv
  • Ctv
  • Ctv
  • Cybersecurity
  • Cybersecurity
  • Cybersecurity
  • Cybersecurity
  • Cybersecurity
  • Cybersecurity
  • Cybersecurity
  • Cybersecurity
  • Cybersecurity
  • Cybersecurity
  • Cybersecurity
  • Cybersecurity
  • Data
  • Data Analytics
  • Data Analytics
  • Data Analytics
  • Data Center
  • Data Center
  • Data Center
  • Data Center
  • Data Center
  • Data Center
  • Data Center
  • Data Center
  • Data Center
  • Data Center
  • Data Center
  • Data Center
  • Data Center
  • Data Center
  • Data Center
  • Data Center and Processing
  • Data Warehousing
  • Data Warehousing
  • Data Warehousing
  • Data Warehousing
  • Databases
  • Databases
  • Databases
  • Databases
  • Dating
  • Defi
  • Digital Ads
  • Digital Ads
  • Digital Ads
  • Digital Ads
  • Digital Ads
  • Digital Ads
  • Digital Ads
  • Digital Ads
  • Digital Ads
  • Digital Ads
  • Digital Ads
  • Digital Ads
  • Digital Ads
  • Digital Ads
  • E-Commerce
  • Earning Updates
  • Earning Updates
  • Earning Updates
  • Earning Updates
  • Earning Updates
  • Earnings Report
  • Earnings Report
  • Earnings Report
  • Earnings Report
  • Earnings Report
  • Earnings Report
  • Earnings Report
  • Earnings Report
  • ECommerce
  • Electric Vehicles
  • Electric Vehicles
  • Electric Vehicles
  • Electric Vehicles
  • Electric Vehicles
  • Electric Vehicles
  • Electric Vehicles
  • Energy Stocks
  • Enterprise
  • Enterprise
  • Enterprise
  • Enterprise
  • Enterprise
  • Enterprise
  • Enterprise
  • Enterprise
  • Enterprise
  • Ethereum
  • Events1
  • Events1
  • Exchange
  • Faq
  • Finance
  • Financial Analysis
  • Financial Analysis
  • Financial Analysis
  • Financial Analysis
  • Financial Analysis
  • Financial Analysis
  • Financial Analysis
  • Financial Analysis
  • Financial Analysis
  • Financial Analysis
  • Financial Analysis
  • Financial Analysis
  • Financial Markets
  • FinTech
  • Fundamental Analysis
  • Gambling
  • Gaming
  • Genomics
  • Glossary
  • Green Energy
  • Growth Stocks
  • Growth Stocks
  • Growth Stocks
  • Headsets
  • Headsets
  • Health Tech
  • Hydrogen
  • Identity
  • Identity
  • Identity
  • Inflation
  • Inflation
  • Inflation
  • Internet of Things
  • Interviews
  • Interviews
  • Interviews
  • Interviews
  • Investing
  • Investing
  • Ltbh
  • Ltbh
  • Ltbh
  • Ltbh
  • Ltbh
  • Macro Trends
  • Macro Trends
  • Market Trends
  • Market Trends
  • Market Trends
  • Market Trends
  • Market Trends
  • Market Trends
  • Market Trends
  • Market Updates
  • Market Updates
  • Market Updates
  • Market Updates
  • Market Updates
  • Market Updates
  • Market Updates
  • Market Updates
  • Market Updates
  • Market Updates
  • Media
  • Membership
  • Mining
  • Mobile
  • Mobile
  • Mobile
  • Mobile
  • Mobile Gaming
  • Mobile Gaming
  • Mobile Gaming
  • Multimedia
  • Music Streaming
  • NVDA | NVIDIA Corporation
  • Performance Updates
  • Pin Content
  • Podcasts
  • Podcasts
  • Podcasts
  • Portfolio
  • Premium Research
  • Press Releases
  • Press Releases
  • Productivity
  • Productivity
  • Productivity
  • Productivity
  • Productivity
  • Productivity
  • Productivity
  • Reports and Whitepapers
  • Research Services Preview
  • Resources
  • Resources
  • Semiconductor Stocks
  • Semiconductors
  • Semiconductors
  • Semiconductors
  • Semiconductors
  • Semiconductors
  • Semiconductors
  • Semiconductors
  • Semiconductors
  • Semiconductors
  • Semiconductors
  • Semiconductors
  • Semiconductors
  • Semiconductors
  • Social Media
  • Social Media
  • Social Media
  • Social Media
  • Social Media
  • Social Media
  • Social Media
  • Software
  • Software
  • Software
  • Software
  • Software
  • Software
  • Software
  • Software
  • Software
  • Software
  • Software
  • Software
  • Software
  • Software
  • Software
  • Solar
  • Solar
  • Stock Analysis PDFs
  • Stock Updates
  • Stock Updates (Blogs)
  • Supplychain
  • Supplychain
  • Supplychain
  • Supplychain
  • Supplychain
  • Supplychain
  • Svod
  • Svod
  • Svod
  • Svod
  • Svod
  • Svod
  • Tech Podcast
  • Tech Stock News
  • Tech Stock News
  • Tech Stock News
  • Tech Stock News
  • Tech Stock News
  • Tech Stocks
  • Tech Stocks
  • Tech Stocks
  • Tech Stocks
  • Tech Stocks
  • Tech Stocks
  • Tech Stocks
  • Tech Stocks
  • Tech Stocks
  • Tech Stocks
  • Tech Stocks
  • Tech Stocks
  • Tech Stocks
  • Tech Stocks
  • Technical Analysis
  • Telehealth
  • Telehealth
  • Telehealth
  • Telehealth
  • Testing Equipment
  • Testing Equipment
  • Top Tech Stock News
  • Travel
  • Trends Report
  • Tutorials
  • Uncategorized
  • Updates
  • Updates
  • Updates
  • Video
  • Video
  • Video
  • Video
  • Video Footage
  • VR
  • Webinar Alerts
  • Webinar Alerts
  • Webinars
Proudly powered by WordPress | Theme: iofund by iofund.co.uk.