This article was originally published on Forbes on ForbesForbes on May 30, 2024,03:26pm EDT
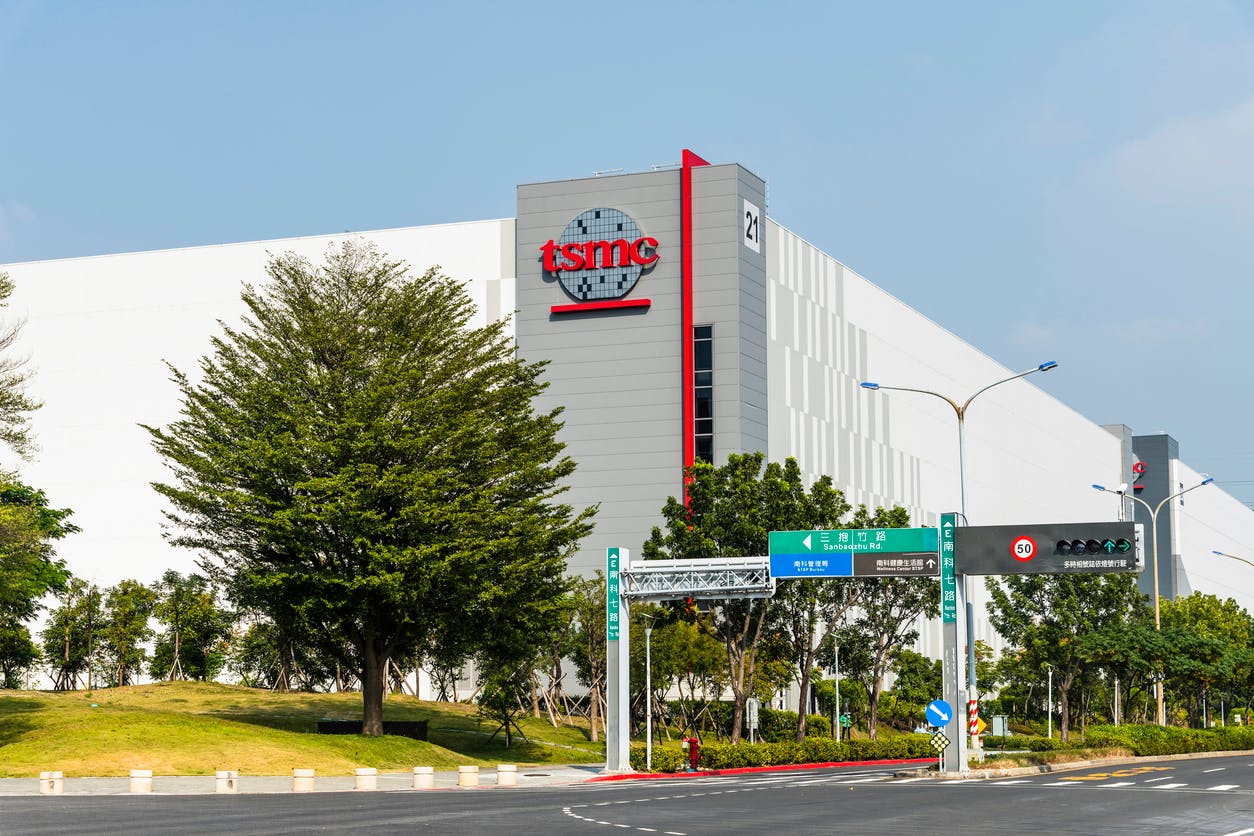
Taiwan Semiconductor (TSMC) is the supplier for major design companies, such as Apple, Nvidia, AMD, Arm, Qualcomm, Broadcom, MediaTek and Marvell. TSMC is a foundry that manufactures the world’s most advanced chips, designated by node size. The most advanced node in production today is the 3nm and is primarily used by Apple in iPhones and MacBooks. The 5nm/4nm is used by Nvidia and others for AI accelerators, with high-performance computing quickly moving to 3nm and even 2nm.
Taiwan Semiconductor reported earnings on April 18th. The company topped analyst estimates and its internal guide with revenue growth of 12.9% YoY growth for US$18.9 billion. EPS beat by 4.5% at $1.38 reported compared to $1.32 expected.
Advanced node revenue continues to remain strong, though 3nm revenue dipped sequentially. Per the opening remarks: “3-nanometer process technology contributed 9% of wafer revenue in the first quarter.” This is down from 15% last quarter. The decline is temporary with Trend Force expecting 3nm production capacity utilization to be up 80% by year end. This quarter, revenue from 5nm and 7nm both expanded 2 points.
Despite warning of a slowdown in the broader semiconductor industry this year, TSMC’s April sales surged 60% YoY and 21% MoM. This marks a positive start to the 20-percentage point acceleration to 33% revenue growth that analysts expect as soon as the September quarter.
Sign up for I/O Fund's free newsletter with gains of up to 485% – Click hereClick here
Background on Advanced Nodes: 5nm, 3nm and upcoming 2nm
Currently, AI accelerators use TSMC’s 5nm process. Nvidia’s Hopper and Blackwell are built with a N4X process that is tailored for high-performance computer applications. This is a customized variant called “4N” that Nvidia uses, yet TSMC recognizes this as 5nm revenue in their earnings report. AI accelerators are expected to quickly move to smaller nodes to help lower power consumption. TSMC’s 3nm process is more energy efficient, and energy efficiency will improve further with the 2nm process.
3nm (N3) and 2nm (N2) technology:
The 3nm process is currently the most advanced semiconductor technology, representing a full node advance from the 5nm generation. At the foundry level, the 3nm process offers 15% better performance than the 5nm process when power level and transistors are equal. TSMC also states the 3nm process can lower power consumption by as much as 30%. The die sizes are also an estimated 42% smaller than the 5nm.
In 2023, TSMC made 3nm chips for Apple’s iPhone 15 Pro, iPhone 15 Pro Max and MacBook’s M3 chips. In 2024, TSMC will expand its 3nm customers to include AMD and Intel. What is interesting is that Nvidia is not using the 3nm node in 2024, despite industry-wide expectations Blackwell would feature the most advanced node. Instead, Blackwell is relying on architecture for its advancement leap from the Hopper architecture.
TSMC offers enhanced 3nm processes, such as the N3E, N3P and N3X, which allows a company like Apple to customize the 3nm chips differently than those for hyperscalers. N3E is the baseline for IP design with 18% increased performance and 34% power reduction, N3P has higher performance and lower power consumption, whereas the N3X will offer high-performance computing very high performance but with up to 250% power leakage.
The 3nm marks the end of FinFET transistors, which stands for field-effect transistor. With FinFET, the gate is wrapped on three sides, whereas with gate-all-around (GAA), as the name implies, the gate is wrapped around on all sides. FinFET is used in 14nm, 10nm and 7nm nodes. TSMC uses FinFETs in the 5nm, yet will phase out FinFET after the 3nm. As TSMC moves toward GAA for the 2nm, having the gate wrap “all-around” will create a greater surface area for better electrostatic control and to also reduce leakage.
Regarding FinFET, the FinFlex technology unique to TSMC allows for chip designers to customize the number of fins per transistor. There are three configurations that balance performance with power consumption. Hybrid CPUs use FinFlex where high-performance cores are matched with power efficient cores, with the ability to activate whichever cores are needed most depending on the workload. The end result is that chip designers can have control over the configuration.
2nm: Nanosheet Transistors and Backside Power Delivery
The 2nm will be the first node to use gate-all-around field-effect transistors (GAAFETs), which will increase chip density. The GAA nanosheet transistors have channels surrounded by gates on all sides to reduce leakage, yet will also uniquely widen the channels to provide a performance boost. There will be another option to narrow the channels to optimize power cost. The goal is to increase the performance-per-watt to enable higher levels of output and efficiency. The N2 node is expected to be faster while requiring less power with an increase of performance by 10%-15% and lower power consumption of 25%-30%.
For TSMC, the 2nm will feature NanoFlex technology, which is similar to FinFlex to where designers can use cells from different libraries. However, due to the new gate-all-around (GAA) nanosheet transistors, there are additional benefits, such as customizing the width and height of cells.
Intel’s 20A will be the first to feature backside power delivery for faster switching and to alleviate routing congestion. With this release, Intel is introducing the “angstrom” era” which translates to future process generations where the process nodes are not smaller necessarily, rather the transistors they’re built with will be improved upon. For Intel, instead of the GAAFET, the company is introducing RibbonFET transistors where multiple flat nanosheets are stacked to enable better current flow.
In the future, we will dive deeper for our free newsletter subscribers into the fierce competition that is heating up between TSMC and Intel at the foundry level. For now, the main points are that TSMC’s N3 will rely on FinFET with GAAFET being introduced for N2. The expectations is that N2 will be available by the second half of 2025. Intel is emerging as a more capable competitor to TSMC with the 20A featuring RibbonFET gate-all-around and backside power delivery, due late 2024-early 2025.
Here is what TSMC’s management has stated about the competition, which communicates that TSMC is not sweating Intel right now:
"In fact, let me repeat again, our 2nm technology without backside power (N2) is more advanced than both N3P and 18A, and will be the semiconductor industry's most advanced technology when it is introduced in 2025."
In terms of timing, management recently offered the following: “Randy, the N2's ramp profile we say is very similar to N3 because of, look at the cycle time, we start the N2 production in the second half of 2025, actually in the last quarter of 2025. And because of the cycle time and all the kind of back-end process, and so we expect the meaningful revenue will start from the end of the first quarter or beginning of the second quarter of 2026.”so we expect the meaningful revenue will start from the end of the first quarter or beginning of the second quarter of 2026.”
Advanced Nodes Contribute 65% of Revenue in Q1
TSMC’s advanced nodes (3nm to 7nm) contributed 65% of revenue in Q1, up from 51% last year. This was driven primarily by the 5nm node, at 37% of revenue, as well as the continual ramp of the 3nm node, although 3nm revenues dipped quite heavily QoQ.
Source: I/O Fund
Revenue contribution from TSMC’s most advanced 3nm node dropped QoQ from 15% to 9% in Q1. Revenues fell nearly 40% QoQ from $2.9B to $1.7B in the most recent quarter. This is not necessarily unusual in the early ramp stages, given that the 5nm node saw a similar pattern in Q4 2020 and Q1 2021, where revenue contribution dipped before accelerating for multiple quarters. There is indication that TSMC will have to allocate more resources to 3nm, and this will come from 5nm fabrication equipment. Therefore, it may be in 2025 that we see 3nm exceed 20% percentage of revenue, which was forecast by management in a previous earnings call.
“We can convert one technology node capacity to the next one is because of our GI's physical advantage, meaning, let me give you one example, our 3-nanometer and 5-nanometer are adjacent to each other, the fabs, and they are all connected. So it's much easier for TSMC to convert from 5 to 3. And that doesn't mean that every node can do the same.”“We can convert one technology node capacity to the next one is because of our GI's physical advantage, meaning, let me give you one example, our 3-nanometer and 5-nanometer are adjacent to each other, the fabs, and they are all connected. So it's much easier for TSMC to convert from 5 to 3. And that doesn't mean that every node can do the same.”
In dollar terms, advanced nodes notched their two best quarters in Q4 and Q1, generating $13.2 billion and $12.3 billion, respectively. Q1’s soft 3nm sales were offset by sequential dollar gains in 5nm and 7nm, with advanced node revenue falling just 6.8% QoQ.
CEO C.C. Wei clarified in the earnings call that most of the current AI accelerators on the market “are in the 5- or 4-nanometer technology,” hence why we’re seeing strong 5nm sales and sequential growth in a seasonally slower quarter.
Source: I/O Fund
Despite most AI accelerators currently being produced on a 5nm node or 4NP node, including Nvidia’s upcoming Blackwell lineup, TSMC sees a clear path to increasing the 3nm node’s revenue contribution through the rest of the year. This will include converting 5nm node tools to support 3nm capacity and demand. Some of the capacity constraints are coming from HBM3e and the surge in CoWoS advanced packaging, which we’ve covered in more detail in our analysis: “Nvidia Q1 Earnings Preview: Blackwell and the $200 Billion Data Center.”
While 3nm’s ramp so far has been strong, management has been dropping hints that customer adoption on its upcoming 2nm node, set for production by year end 2025, will be even strongerwill be even stronger.
On the most recent earnings call, it was stated: “observing a high level of customer interest and engagement at N2 and expect the number of the new tape-outs from 2-nanometer technology in its first 2 years to be higher than both 3-nanometer and 5-nanometer in their first 2 years.”
Margins Guided Sequentially Weaker
Despite strong HPC growth, bucking what’s normally a seasonal decline in Q1 to report sequential growth, margins face some headwinds through the rest of the year.
TSMC reported a 53.1% gross margin in Q1 and a 42% operating margin. For Q2, TSMC guided for a lower gross margin of 51% to 53%, primarily impacted by the recent 25% electricity price hike in Taiwan, some impacts from the earthquake, and 3nm’s ramp with the 3nm not at corporate gross margins yet. Operating margin was guided to be 40% to 42%, pointing to a slight 1-point QoQ decline, at midpoint.
Here’s what management said about Q2’s guide and some lasting headwinds through the rest of the year:
“After last year's 17% electricity price increase from April 1, TSMC's electricity price in Taiwan [has] increased by another 25% starting April 1 this year. This is expected to take out 70 to 80 basis points from our second quarter gross margin. Looking ahead to the second half of the year, we expect the impact from higher electricity costs continue and dilute our gross margin by 60 to 70 basis points […]
In addition, we expect our overall business in the second half of the year to be stronger than the first half. And revenue contribution from 3-nanometer technologies is expected to increase as well, which will dilute our gross margin by 3 to 4 percentage points in second half '24 as compared to 2 to 3 percentage points in first half of '24.
Finally, as we have said before, we have a strategy to convert some 5-nanometer tools to support 3-nanometer capacity given the strong multiyear demand. We expect this conversion to dilute our gross margin by about 1 to 2 percentage points in the second half of 2024.”
Overall, the largest headwinds to gross margin stem from ramping the 3nm node, which is to be expected, given TSMC has historically seen 3 to 5 percentage point headwinds in the initial (3-4 quarters) ramp phase before ultimately realizing higher margins once the node has scaled. This has occurred with both the 7nm and 5nm node.
AI-Related Revenue Reaches Fresh Record, Driving Strong Outlook
As the leading foundry for AI accelerators, TSMC is riding the enormous wave of demand from Big Tech. The chipmaker’s high-performance computing (HPC) revenues rose 3% QoQ to ~$8.68 billion, a fresh record despite the first quarter typically being seasonally weaker. HPC revenues (which are AI-related) increased 18% YoY as well.
Source: I/O Fund
Q2 is already off to a strong start. TSMC’s April sales rose nearly 60% YoY and 21% MoM to NT$236.02 billion, or US$7.28 to 7.30 billion.
TSMC had guided revenue for Q2 between $19.6 billion and $20.4 billion, and April’s surge puts it on track to land in the upper half of or above the guided range.
Much of this surge is likely attributed to HPC applications, given that we saw Big Tech discuss increased capex spending this year, predominantly for AI infrastructure. Our firm has been especially strong on correlating capex to AI investments for our paid research members, where we held a 1-hour webinar in April discussing our expectations that capex would increase in Q1 in support of AI stocks. We followed this up with free analysis in our newsletter that tracked a 35% YoY increase to $200 billion across Big Tech companies. A disproportionate amount of this will go to Nvidia.
We’re closely tracking Big Tech’s capex plans for 2024 and how this will flow downstream to AI hardware companies. The I/O Fund had a 45% allocation to AI going into 2023, one of the highest on record. Today, the AI allocation is higher with many lesser-known names. Learn more here.here.
There are also reports of Nvidia and AMD fully booking out TSMC’s advanced packaging capacity through the end of 2025, signaling strong demand from some of TSMC’s primary HPC customers. This lends to a strong AI-driven outlook.
Notably, TSMC’s management was much more cautious on the broader semiconductor industry. CEO C.C. Wei explained that for 2024, “We lowered our forecast for the 2024 overall semiconductor market, excluding memory, to increase by approximately 10% year-over-year.”We lowered our forecast for the 2024 overall semiconductor market, excluding memory, to increase by approximately 10% year-over-year.”
That caution does not translate through to AI, with TSMC seeing a “strong AI-related demand outlook.” Wei noted that the “continued surge in AI-related demand supports our already strong conviction that structural demand for energy-efficient computing is accelerating.”
TSMC’s positioning and value to the AI supply chain is expected to increase in the age of AI and high-performance computing. Wei added that TSMC forecasts “revenue contribution from several AI processors to more than double this year and account for low-teens percent of our total revenue in 2024. For the next 5 years, we forecast it to grow at 50% CAGR and increase to higher than 20% of our revenue by 2028.” This will include more than just data center GPUs, but will also include on-device AI.
The I/O Fund has been covering on-device AI on our research site to prepare for the next leg up in AI with many lesser-known names.
Every Thursday at 4:30 pm Eastern, the I/O Fund team holds a webinar for premium members to discuss how to navigate the broad market, as well as various stock entries and exits. We offer trade alerts plus an automated hedging signal. The I/O Fund team is one of the only audited portfolios available to individual investors. Learn more here.Learn more here.
Analyst Estimates Falling Slightly
What’s interesting to see is that consensus revenue estimates have not only failed to move higher, but have actually been revised lower despite a top and bottom line beat in Q1 and strong guide above consensus for Q2.
Analysts are expecting revenue growth of 29.1% YoY to $19.94 billion in Q2, before accelerating to 32.1% YoY to $22.32 billion in Q3. This is expected to be ‘peak’ growth, with revenue growth rates decelerating back into the low 20% range heading into 2025.
Source: I/O Fund
Now compare this to analyst estimates from late January – while Q2’s estimate has moved higher, we’ve actually seen Q3’s revenue estimate revised $110 million lower, even with a $50 million increase to Q4’s estimate. Here’s January’s figures below for reference:
Source: I/O Fund
It’s not unusual to see EPS estimates come down slightly given the quantified gross margin headwinds TSMC is expecting to see in Q2 with 3nm’s ramp headwind persisting through the rest of the year.
Regarding the Q3 revenue estimates softening by $110 million, it may be linked to management not raising full year guidance, which was addressed in the Q&A from the recent earnings call:
Mehdi Hosseini (SIG):
You had a very nice upside to revenue expectation for the first half of '24, but has kept the year-end unchanged. Is that a reflection of that slow recovery that you were highlighting? Or would you prefer to wait to have more visibility before updating 2024 target?
[…]
Wendell Huang (CFO, TSMC):
Yes. Mehdi, our guidance for the quarterly profile did not change. We always said that quarter-over-quarter, there will be growth. And also, the full year guidance will stay the same. So I don't think there is a so-called upside, as you just said.
—End Quote
Conclusion:
As we’ve emphasized in this analysis and many others on AI stocks, the weakness is coming from non-AI segments. TSMC is a bellwether for semiconductors and can offer unparalleled visibility. In other commentary, this is what management stated in terms of where a lack of upside is coming from, which matches our understanding.
“Yes, smartphone end-market demand is seeing gradual recovery and not a steep recovery, of course. PC has been bottomed out and the recovery is slower. However, AI-related data center demand is very, very strong. And the traditional server demand is slow, lukewarm. IoT and consumer remain sluggish. Automotive inventory continues to weaken.” -TSMC
Our firm closed our TSMC position late last year for a 22% gain, when it was at $92. We decided to instead focus on stocks with heavier AI concentration with less geo-political risk. The stock has risen an impressive 62% since then. Around that time, we re-allocated and built an AI position that is up 51% in a similar time frame. We continue to be focused on stocks with high AI concentration and TSMC will remain on our watchlist as we build out our AI portfolio with many lesser-known names.
Please note: The I/O Fund conducts research and draws conclusions for the Fund’s positions. We then share that information with our readers. This is not a guarantee of a stock’s performance. Please consult your personal financial advisor before buying any stock in the companies mentioned in this analysis.
Alpha and Omega Semiconductor manufactures power IC semiconductors, MOSFETs, intelligent power modules, high voltage gate drivers, and other power management module products. AOSL’s primary end market is PCs and graphic cards, with around 40% or more of quarterly revenue stemming from this end market, on average. The company is low-growth and is not GAAP profitable. There are indications it will become profitable on an adjusted basis soon. In the most recent quarter, the company turned cash flow positive. Inventory corrections in the consumer and industrial markets have created headwinds to revenue, yet management expects both segments to see strong sequential growth as inventory corrections are expected to end soon.
Where AOSL could become a promising stock is that it has been shipping on Intel’s Raptor Lake and Meteor Lake, alongside AMD’s FP8 platform. AOSL is in development and sampling for AMD’s FP11 platform, which is expected to underpin its next-generation high-end Ryzen Strix Halo APUs offering 70 TOPS of AI performance, up to a 75% increase to current chips from AMD’s rivals Qualcomm and Apple currently on the market. AOSL is also sampling to Intel’s Panther Lake platform, which is expected to be released in mid-2025, rumored to bring a 5x increase in AI performance versus Meteor Lake.
Despite the promising tie-ins to Intel and AMD, we are putting AOSL in the high-risk bucket due to it being a small-cap, and because it requires speculation that there will be a shift in the fundamentals. The stock will be reserved for the Advanced tier’s momentum portfolio for now, until we see more fundamental strength. This means technical analysis plays a primary role. We will close the position quickly (as soon as one day) if the setup fails. Or, we will hold for many months and increase its allocation if we see the stock shift to meet more of our criteria.
Overview of AI PCs and AI Mobile:
Given its high contribution to revenue combined with a strong outlook in AI PCs over the next six to eight quarters, we’re watching the Computing segment closely to drive growth through the September quarter and through 2025.
Management has been quite transparent throughout the inventory corrections in the PC space in 2022 as well as the growth opportunities it sees in the computing segment, not just in PCs but also extending to graphics and AI accelerators.
In May 2022, management pointed out that they were beginning to “see early signs that the PC market is beginning to soften,” and then later in December 2022, management said that “demand dropped off rapidly in December quarter as our customers aggressively reduced inventories,” though customers were anticipating order resumption in the June 2023 quarter. Not only was management fairly open throughout the downturn, it also was a testament to AOSL’s strength in the market — despite that sharp 20% YoY decline in PC shipments in 2022, AOSL’s full year PC revenue increased 3% YoY due to share gains, increasing bill of materials (BOM) content and product mix shift towards premium products.
Overall, the PC downturn significantly impacted Computing revenue, going from a near peak $89 million to $38 million in just two quarters, from fiscal Q1 2023 (Sept 2022) to fiscal Q3 2023 (Mar 2023). Prior to this macro-induced demand slowdown and subsequent inventory correction in PCs, computing revenue approached $360 million in TTM revenue.
Management had noted in February this year that the “inventory correction in graphic cards is coming to an end,” resolving one headwind to Computing growth.
In fiscal Q3 2024, computing revenue was ~$68.7 million, and management’s guide for mid- to high-single digit QoQ growth implies AOSL exits fiscal 2024 with computing revenue in the mid-$280 million range, or just over 20% below peak. AOSL saw “an increase in demand for newer applications such as graphics cards and AI applications,” and for fiscal Q4, management is forecasting “a rebound in gaming and continued strength from tablets, graphics cards, and AI,” and anticipates PC strength through the September quarter on new product launches.
Moving through the rest of 2024 and into 2025, Computing segment’s growth is likely to be driven by two primary factors – AI PC growth aided by Intel’s Meteor Lake platforms and AMD’s FP8 and FP11 next-gen chips, as well as a rather robust server and AI accelerator point-of-load (POL) roadmap.
For example, AOSL’s power delivery content is increasing significantly on Intel’s Meteor Lake chips, compared to the Arrow Lake predecessor, which should translate into a healthy BOM increase. Intel is targeting a significant 8x increase in Core Ultra AI PC chip shipments (across its Arrow Lake, Meteor Lake and Lunar Lake platforms) — from 5 million since December 2023 to at least 40 million by year-end 2024. This is estimated to grow 50% in 2025 to 60 million Core Ultra chip shipments.
Source: Intel
For Meteor Lake specifically, Intel is rumored to be targeting 20 million unit shipments in 2024, with 300 million units for Meteor Lake’s life-cycle; if correct, this provides a large long-term runway for AOSL on a single chip generation.
Analysts pressed management about this opportunity, though management was vague in terms of specificities stemming from Intel and cautious about how the PC rebound will unfold:
Q, Craig Ellis: “if Intel is on track to ship 40 million Meteor Lake units this year in the back half for their target. And then I think its 60 million next year. Is that where you are getting some content gain and are we seeing some of that in the guidance for fiscal 4Q? And then the broader question beyond just compute, I think three months ago when you talked about mid-year and the second-half of the year, you saw the potential for there to be a seasonal rise in the business that looks like we are starting to see that. Can you just talk about how your expectation for the back half of the year, or the fiscal first half of ‘25 has changed in the last three months. What’s gotten better and is anything tick lower?
A, CEO Stephen Chang: “Sure, regarding PCs in the first half calendar versus second half calendar year, we do think that the second half will be stronger than the first half. But it’s hard to see how strong it will be going beyond the peak season in September. We do believe that the seasonal patterns are already coming back. But we are hesitating to call a full recovery and then we will know better once we are into that second half in terms of how, whether it will persist going into this December quarter. Overall, I think – we think it will probably take a little longer to get to the full recovery for PCs. I think an Intel transition to Meteor Lake will help. We are hoping that some of these new platforms in general from the OEMs will also start to trigger more end demand for PCs. But overall, yes, we are expecting that to see PCs be stronger going into the September quarter. But we are going to be careful watching out for that.”we do think that the second half will be stronger than the first half.But it’s hard to see how strong it will be going beyond the peak season in September. We do believe that the seasonal patterns are already coming back. But we are hesitating to call a full recovery and then we will know better once we are into that second half in terms of how, whether it will persist going into this December quarter. Overall, I think – we think it will probably take a little longer to get to the full recovery for PCs. I think an Intel transition to Meteor Lake will help. We are hoping that some of these new platforms in general from the OEMs will also start to trigger more end demand for PCs. But overall, yes, we are expecting that to see PCs be stronger going into the September quarter. But we are going to be careful watching out for that.”
Bill of Materials (BOM) Increasing from $2 to $3
Management also shared a rather positive long-term outlook in terms of how it will work towards increasing BOM ($ content per product) and enter new markets:
“So, with that, we are seeing BOM content grow. It used to be in the $2 range is going into the $3range. And depending upon the configuration can push harder than that. But that’s helping us in general because with the latest power maps being used that the CPUs are being used, we are seeing more driver mass is lowered, more phases, which basically means more content for us and going into powering the CPU. Now – and so that’s what’s going on the client side. The other thing that we are seeing in general is that we are expanding more not only from the client PC side, but also going into advanced computing. And you guys and we have been sharing about our success in general into the graphics market, we are seeing in a return into growth for the graphics side. So, we feel a little more confident that the inventory correction there is behind us and we are seeing growth is specifically for the graphics side.” which basically means more content for us and going into powering the CPU. Now – and so that’s what’s going on the client side. The other thing that we are seeing in general is that we are expanding more not only from the client PC side, but also going into advanced computing. And you guys and we have been sharing about our success in general into the graphics market, we are seeing in a return into growth for the graphics side. So, we feel a little more confident that the inventory correction there is behind us and we are seeing growth is specifically for the graphics side.”
The company is also sampling or in development for a handful of upcoming next-generation platforms from AMD and Intel.
AOSL has been shipping on Intel’s Raptor Lake and Meteor Lake, alongside AMD’s FP8 platform. AOSL is in development and sampling for AMD’s FP11 platform, which is expected to underpin its next-generation high-end Ryzen Strix Halo APUs offering 70 TOPS of AI performance, up to a 75% increase to current chips from AMD’s rivals Qualcomm and Apple currently on the market. AOSL is also sampling to Intel’s Panther Lake platform, which is expected to be released in mid-2025, rumored to bring a 5x increase in AI performance versus Meteor Lake.
AOSL’s server and HPC/AI accelerator product portfolio is expected to increase significantly, with more than half a dozen new products planned for development through 2025 and beyond. The following was stated on the call: “And the other new area that I would say that’s in the computing space is AI. And over there we are starting to get some business because of our success in graphics cards. One of our customers is basically using a similar solution in their AI accelerators. So, we are still seeing some contribution coming there, going into AI accelerators.”
Fiscal Q3 Financials Recap
AOSL reported fiscal Q3 earnings (quarter ending March 2024) in early May, reporting revenue in line with estimates and EPS above estimates. As you can see below, AOSL is coming off a deep trough. There is commentary that suggests the fundamentals are bottoming, which aligns with our understanding of PCs and mobile rebounding in H2 of this year. However, as stated in the introduction, until fundamentals are actually reported, a rebound requires speculation.
Revenue and EPS:
Revenue in the quarter was $150.1 million, an increase of 13.2% YoY but a decrease of (9.2%) QoQ. This was in-line with analyst estimates. Management expanded on seasonality, saying that while the “March quarter is historically our seasonally lowest revenue quarter due to the technicality of consumer spending, the year-over-year growth indicated the strength of our recovery from the inventory corrections.”
Days sales outstanding was 15 days for Q1 compared to 18 days for the prior quarter, and 30 days for the year ago quarter.
Adjusted EPS was ($0.04), beating the consensus estimate for ($0.14). GAAP EPS was ($0.39), beating estimates for ($0.48). The goal is to see this company become profitable on an adjusted basis next quarter.
Fiscal Q4 revenue was guided to be $160 million, +/- $10 million, for a (1%) YoY decline and a 6.6% QoQ increase at midpoint. Management said that “starting from the June quarter, we forecast a rebound in gaming and continued strength from tablets, graphics cards and AI. Looking beyond, we anticipate the second half of this year will be stronger than the first half as customers gear up for new product launches in smartphones as well as PCs.” Management also added that “inventory corrections across the majority of our end markets are now approaching their conclusion, positioning us for a gradual rebound as we move forward into the rest of calendar year 2024.”
Based on management’s guidance for margins and operating expenses, adjusted EPS is expected to be approximately $0.04 in Q4. GAAP EPS is expected to be approximately ($0.30), as GAAP operating expenses are expected to be around 20% higher than non-GAAP. Moving forward, adjusted EPS is expected to increase sequentially in fiscal Q1 and remain flat QoQ in Q2; however, there are only three analyst estimates for revenue and EPS, which opens the door to large EPS beats or misses.
Margins:
GAAP gross margin was 23.7% in Q3, a 50 bp YoY improvement but a sequential decline of 290 bp. Adjusted gross margin was 25.2%, a 10 bp YoY improvement but a sequential decline of 280 bp. Management explained that the sequential decline in margins were “mainly driven by lower utilization and ASP erosion, partially offset by better mix.”
GAAP operating margin was (7.0%) in Q3, a 390 bp YoY improvement from (10.9%) in the year ago quarter, but a 630 bp sequential decline from (0.7%) last quarter. Adjusted operating margin was (0.7%), a 480 bp YoY improvement from (5.5%) in the year ago quarter but a 290 bp sequential decline from 2.2% last quarter.
GAAP net margin was (7.5%) in Q3, a 680 bp YoY improvement. Adjusted net margin was (0.8%), a 360 bp YoY improvement.
Over the longer term, management remains optimistic about a return to 30% margins as it works towards hitting its $1 billion revenue goal:
Q, Analyst Craig Ellis: “What are some of the bigger gives and takes that we should be aware of for gross margin and really the pace of expansion and what do you need to see to be confident that gross margins can move back to that 30% level and then at some point higher? Thank you.
A, CFO Yifan Lang: At this point and I mean we still think on our mid-term target model and when we reach the $1 billion in revenue, we expect to get to 30% gross margin on the non-GAAP basis level.”
Cash and Debt:
Operating cash flow was $28.2 million in Q3, including $9.9 million in repayments of customer deposits. Operating cash flow margin was 18.8%, compared to 8.8% in the year ago quarter.
Free cash flow was $20.2 million, for a margin of 13.7%, compared to (-8.3%) in the year ago quarter. Given that we’re in a high rate environment that is not ideal for companies undergoing capital raises, having positive operating and free cash flow with margins in the double digits is a positive for AOSL, suggesting that it should be able to fund operations organically.
Cash and equivalents totaled $174.4 million.
Debt totaled $41.2 million.
Key Segments:
Computing:
The Computing segment accounted for 45.8% of AOSL’s revenue in Q3, increasing 80.4% YoY on a weak comp due to a sharp inventory correction and downturn in the PC market in the same quarter last year. Sequentially, computing revenue declined 4.3%, as March is typically AOSL’s seasonally weakest quarter.
Management said Computing’s revenue was “in line with our original expectation for a mid-single digit decline sequentially due to seasonality and the impact of Chinese New Year,” and that “sequential growth in graphics cards, tablets and A.I. accelerators helped partially offset the seasonal decline that was mostly from notebooks.”
Consumer:
The Consumer segment accounted for 15.7% of revenue, declining (47.1%) YoY but increasing 0.3% QoQ. Management said the “inventory correction in gaming continued in the March quarter,” but they see “opportunities to increase BOM [bill of materials] content within the current console platform as part of a product refresh coming very soon.” Consumer segment revenue exceeded management’s expectations for a single-digit sequential decline due to strength in LCD TVs and home appliances.
Communications:
The Communications segment accounted for 17.9% of revenue, increasing 39.2% YoY but declining (7.4%) QoQ. Management noted that segment growth was below expectations as “continued strength in March quarter shipments to the Korea and China-based smartphone OEMs were offset by a seasonal decline in shipments to the Tier 1 U.S. smartphone customer, as well as a slowdown in networking.”
Looking forward, the segment is expected to see flat QoQ growth in the June quarter, as increasing BOM and increased shipments from its US smartphone customer in preparation for a fall launch will be offset by a sequential decline in Korea and China OEMs. Management said that “even with a sequential decline, our China OEM businessremains strong and up significantly year-over-year. Overall, we estimate the Communication segment will be flat sequentially in the June quarter, which is notably higher year-over-year, because of our BOM content and market share increases.”
Power Supply & Industrial:
The Power Supply and Industrial segment accounted for 16.5% of total revenue, decreasing (6.5%) YoY and (29.0%) QoQ on continued inventory corrections in quick chargers in addition to sequential declines in AC-DC power supplies, power tools and solar. Looking ahead to the June quarter, management expects sequential growth in the mid- to high-single digits as the quick charger inventory correction ends alongside strength in e-mobility.
Valuation
In terms of valuation, AOSL trades just slightly above 1x sales and below book, making it one of the cheapest stocks in the semiconductor industry on these two metrics.
At the moment, AOSL is trading about in line with its 5-year average PS ratio of 1.1x, falling from a peak multiple of 2.5x in early 2022 when revenue was approaching its peak above $200 million and EPS was surpassing $1.00 per quarter. AOSL’s forward PS ratio is nearly identical at nearly 1.2x, given that revenue growth is expected to be approximately (1%) this year before accelerating to 5.4% in fiscal 2025, based on current analyst estimates.
Because AOSL is not a hypergrowth stock at the moment, with revenue expected to accelerate to the double digits in late fiscal 2025 (calendar Q1 2025), the focus shifts to the bottom line, which has been weakening as margins slip on lower utilization rates and some ASP declines. Currently, gross margins are hovering in the 25% range, lower than AOSL’s long-term target of 30% and below peak margins in the 35% range in fiscal 2022; at that range, AOSL was delivering $1.00+ in EPS, or annualized earnings power above $4/ per share.
At the moment, AOSL trades at an ~47x forward PE ratio, weighed down by weaker margins. This is more expensive than the 36x forward multiple from November 2023 and significantly more expensive than the 15x ratio from a year ago, when gross margins were closer to the 30% level and the bottom line was a bit stronger.
Essentially, AOSL would need to drive net margin towards the high-single digit, low-double digit range to realize this earnings power, but that is likely entirely reliant on gross margin expanding beyond the 30% range. Finding ways to increase content per chip in the PC space should aid in higher margins, unless that is driven by increasingly expensive components. Notably, the margin recovery is likely to be more gradual due to weakness in other end markets, such as solar and consumer segments.
Technicals Appear Bullish
By Knox Ridley
The developing, larger trend in AOSL appears to be quite bullish. So far, there are two patterns within this larger trend: first, is a near vertical move higher; second, a corrective retrace that is making higher lows.
This first pattern starts off the COVID low in 2020, and is a clear 5 waves that stretches into the March 2022 high. Five wave moves are nearly vertical with minor pullbacks along the way. They tend to signal the start of a trend. There is simply no other interpretation of this pattern in AOSL, which suggests higher prices on the horizon.
The 2nd pattern in the larger trend, which further confirms this thesis higher, is how we have corrected since the March 2022 high. The correction since the March 2022 top has been an overlapping, corrective pullback, which is commonly called a “bull flag.” This pattern tends to be a correction within a larger uptrend.
The internals and volume patterns during this pullback further support the developing uptrend. Look at the MACD, which is a way to measure momentum within trends. Note how the MACD bottomed in July of 2022 and has since made a series of higher highs while price made a series of lower lows. This implies that the selling momentum has been fading, which is common to see close to bottoms.
Furthermore, note the large green volume patterns that have been developing since June of 2023. This is indicating accumulation, which is also a common pattern to see close to bottoms.
Our game plan is to wait for a breakout above $30.50. Once we get this signal, ideally on expanding buying volume, we would enter this position with a stop in the $24 range. If this larger pattern is playing out, we would then buy the dips of AOSL along the way.
Conclusion
We believe AI PCs may emerge as one of the stronger growth trends in consumer AI devices over the next few years, with AI PC shipments projected to surge at a 44% CAGR through 2028 to take over 70% share of PC shipments. AOSL’s tie-ins to Intel’s Meteor Lake CPU and possible launch on its upcoming Panther Lake platform, as well as its position in development stages for AMD’s FP11 platform, position it for strong growth in this space.
Computing revenue growth for AOSL has been strong and is a primary driver of overall growth, accounting for more than 45% share of total revenue. While AOSL’s top line valuation is much cheaper than many leading AI stocks, the bottom line is weak currently as margins remain depressed; however, the technicals are leaning bullish, and as we know, AI small caps can move quickly (in both directions!), so we believe it’s worth keeping AOSL on our radar with a buy plan (and a sell plan!) in place.
Damien Robbins, Equity Analyst for the I/O Fund, contributed to this analysis
Broadcom has greatly outperformed the FAANGs over the past decade yet is rarely discussed as one of the market’s top-performing stocks. The ticker certainly does not participate in a catchy acronym. Half the battle with Broadcom is there are many revenue segments to analyze, some go through harsh cyclical downturns, and it acquires companies hand over fist. To put it plainly, this is not an easy stock to cover; there are no pithy ways to summarize the products and it doesn’t offer growth stock qualities.
We have revamped the Essentials Portfolio by including Broadcom. Stay tuned for trade alerts sent directly to your inbox, keeping you up-to-date with any adjustments to three key holdings.
Broadcom has many departments that have been strung together through acquisitions with a vision of consolidating Ethernet, ASICs and now virtualization under one company. The reason this company is sitting in plain sight is because it was a major winner from the mobile era, is partnered with Big Tech as we move in the AI era, and is putting together the pieces to participate in AI strategically by not needing to compete on GPUs.
Broadcom Financials
Broadcom is firing on all cylinders and the Q1 earnings report cemented the company as number two in terms of AI revenue. It’s not only the AI revenue that sets Broadcom apart, but also its developing software strategy with VMWare.
The headline numbers don’t help to translate underlying AI strength as Broadcom reiterated its full year guidance yet raised AI revenue. This is because some of Broadcom’s segments are coming in lower than expected, while AI is coming in higher than previously guided.
This comment kicked off the tone of the call: “I know we told you in December, our revenue from AI would be 25% of our full year semiconductor revenue. We now expect revenue from AI to be much stronger, representing some 35% of semiconductor revenue at over $10 billion.” This is up from $7.5 billion expected this year, and also up from a $6 billion run rate last quarter ($1.5B per quarter). The AI revenue is roughly 70% ASICs and 30% AI Networking.
In addition to stronger-than-expected AI revenue, Broadcom is expecting dramatic, sequential growth in software bookings, which are expected to grow about 70% QoQ. We need another quarter or two to verify if the rapid growth from VMWare Cloud Foundation will continue, but management implies it will continue to be strong. If so, Broadcom is quickly asserting itself as a leader in AI software as consolidated bookings are expected to add $1.2 billion QoQ from $1.8 billion this quarter to $3 billion next quarter.
Revenue and EPS:
Q1 revenue was $11.96 billion, beating estimates by $240 million, and representing YoY growth of 34%. Excluding VMWare, revenue growth was 11% for a 7 percentage point acceleration over the past two quarters, at 4% in the October quarter and 4.9% growth in the July quarter.
Q1 adjusted EPS was $10.99, beating estimates by $0.57. GAAP EPS was $2.84, compared to $8.80 in the year ago quarter.
Broadcom reiterated its fiscal year revenue guide of $50 billion and full year EBITDA guidance of 60%. This compares to an EBITDA margin of 63% to 65% in previous quarters.
Margins:
Q1 GAAP gross margin was 61.7%, compared to 67.4% in the year ago quarter. Amortization of acquisition-related intangible assets adversely impacted gross margin by ~1150bp in the quarter. Adjusted gross margin was 75.4%, compared to 73.8% in the year ago quarter.
Q1 GAAP operating margin was 17.4%, compared to 46% in the year ago quarter. The operating margin was mainly lower due to the increase of amortization of acquisition-related intangible assets, restructuring charges, and stock-based compensation. Adjusted operating margin was 57.1%, compared to 60.9% in the year ago quarter.
Q1 GAAP net margin was 11.1%, compared to 42.3% in the year ago quarter. The net margin was mainly lower due to the increase of amortization of acquisition-related intangible assets, restructuring charges, and stock-based compensation. Adjusted net margin was 43.9%, compared to 50.3% in the year ago quarter.
Cash Flows and Balance Sheet:
Q1 operating cash flow was $4.82 billion, representing a 40.3% margin.
Q1 free cash flow was $4.69 billion, representing a 39.2% margin. Excluding restructuring and integration spend of $658 million, free cash flow was 45% of revenue.
Cash, equivalents and short-term investments totaled $11.9 billion.
Debt totaled $75.9 billion. The debt increased from the $39.2 billion in the previous quarter due to the additional debt taken to finance the VMware purchase and the company also assumed $8.3 billion VMware’s debt. The average coupon-rate and years to maturity of fixed rate debt of $48 billion is 3.5% and 8.4 years, respectively. The average coupon-rate and years to maturity of floating rate debt of $30 billion is 6.6% and 3 years, respectively. In early March, the company repaid $2 billion of floating rate debt and intends to maintain this quarterly repayment throughout FY2024.
In Q1, Broadcom paid stockholders $2.4 billion of cash dividends based on a quarterly common dividend of $5.25 per share. The company repurchased $7.2 billion of common stock and eliminated $1.1 billion of common stock for taxes due on vesting of employee equity, resulting in the repurchase and elimination of approximately 7.7 million AVGO shares. The Q2 non-GAAP diluted share count is expected to increase to approximately 492 million as the shares issued including VMWare.
Days sales outstanding were 41 days in the first quarter compared to 31 days in the fourth quarter on higher accounts receivable due to the VMware acquisition. This is due to the accounts receivable from VMware having payment terms of 60 days compared to Broadcom’s 30 days.
The company ended the first quarter with inventory of $1.9 billion, up 1% sequentially.
Key Segments:
Software Revenue:
Management reiterated their software revenue guidance of $20 billion this year.
Q1 Software segment revenue of $4.6 billion was up 156% year-on-year and included $2.1 billion in revenue contribution from VMware. In the previous quarter, software was $1.97 billion. This implies 27% QoQ growth in software after stripping out VMWare. When asked about this, management said to not get too excited about this particular growth as it’s due to strong contract renewals. Instead, the CEO explicitly stated: “Yes, don't get too excited over that. So that has also accelerated, but that's not the star of this show, Stacy. Star this show is the accelerating bookings and backlog we are accumulating on VMware.” In fact,it was indicated that some of this could fall off in future quarters given the software guide was not raised.
What the CEO is referring to as the star of the show is the consolidated bookings in software, which grew sequentially from less than $600 million to $1.8 billion in Q1 and is expected to grow to over $3 billion in Q2. Per management: “Revenue from VMware will grow double-digit percentage. Sequentially, quarter-over-quarter, through the rest of the fiscal year.”
Management stated the rapid growth from the VMWare segment is because: “We are focused on upselling customers, particularly those who are already running their compute workloads with vSphere virtualization tools to upgrade to VMware Cloud Foundation, otherwise branded as VCF […] VMware and NVIDIA entered into a partnership called VMware Private AI Foundation, which enables VCF to run GPUs. This allows customers to deploy their AI models on-prem. And wherever they do business without having to compromise on privacy and data — in control of their data. And we are seeing this capability drive strong demand for VCF, from enterprises seeking to run their growing AI workloads on-prem.”
Semiconductor Revenue:
Semiconductor solution sales increased 4% YoY to $7.39 billion, a slight uptick from 3.3% growth in the prior quarter. Stronger-than-expected growth from AI more than offsetting the cyclical weakness in broadband and server storage. According to Bloomberg, this was a bit shy of expectations for $7.7 billion in revenue. This was most likely due to weak wireless, broadband, and server storage segments.
Q1 networking revenue of $3.3 billion grew 46% year-on-year, representing 45% of semiconductor revenue. Management stated the following: “For fiscal 2024, given continued strength of AI NAND working demand, we now expect networking revenue to grow over 35% year-on-year compared to our prior guidance for 30% annual growth.”
Q1 wireless revenue of $2 billion decreased 1% sequentially and declined 4% year-on-year representing 27% of semiconductor revenue. Wireless is expected to be flat YoY for FY2024.
Q1 server storage connectivity revenue was $887 million or 12% of semiconductor revenue, down 29% year-on-year. The company revised its server storage revenue to decline in the mid-20 percentage range compared to prior guidance for a decline in the high teens.
Broadband Q1 revenue declined 23% year-on-year to $940 million and represented 13% of semiconductor revenue. Broadcom revised its outlook for fiscal '24 broadband revenue to be down 30% year-on-year from prior guidance of down mid-teens year-on-year.
Q1 industrial resales of $215 million declined 6% year-on-year. Management stated that industrial resales will be down high single digits this year.
Broadcom’s Switch Products and Switch Fabric
Broadcom has a dominant market share of switching and routing semiconductors for hyperscalers and is seeking to maintain its market share, most especially as AI changes networking requirements. The Jericho3-AI launch was last April, which is a redesign intended to compete with Nvidia’s InfiniBand.
Broadcom has three switch products. The Tomahawk is the high-bandwidth switch platform, Trident is the platform with more features, and the new Jericho line combines the Jericho switch with routing ASICs. The Jerico3 was redesigned with deep packet buffers. Tomahawk and Trident are used in data centers yet are not optimized for AI workloads, especially when compared to InfiniBand.
Jericho has 160 switch ports dedicated to switch fabric, which allows multiple ASICs to be stitched together to support GPU clusters. The asymmetric split helps the chip overcome network congestion and network failures. According to Broadcom, Jericho3-AI performed 10% better than “alternative network solutions” — which is a clear reference to InfiniBand.
A few specs before we go deeper into how Broadcom’s solutions compare to Nvidia’s. As you’ll note, the specs for InfiniBand are superior with support for 64X 400Gbp or 128 200 GB/s ports compared to Jericho’s 36X 400 GbE and 72X 200GbE network-facing ports.
Jericho has 144X SerDes lanes and 106Gpbs PAM4 supporting 18X 800Gbe, 36X 400 GbE and 72X 200GbE network-facing ports. The Jericho3-AI allows for more than 32,000 GPUs to be linked for a massive AI training system and links directly to GPUs without the need for a server bus.
Tomahawk5 runs at 100 GB/second with PAM4 with aggregate bandwidth of 51.2 Tb/s
Compare this to Nvidia’s Quantum-2 InfiniBand which has support for 64X 400Gbp or 128 200 GB/s ports with 51.2 Tb/s and 66.5 billion packets per second.
Nvidia’s new Spectrum X Platform is an Ethernet solution that delivers 1.6X better networking performance than traditional Ethernet with 256X 200 Gbe ports or 16,000 ports for larger training systems.
On a similar note, and while we are on the topic, Marvell has some skin in the game too by offering a 51.2T switch called Teralynx 10 that offers ultra-low-latency at 80% cost savings. According to Moor Insight Strategy, Marvell is the supplier for AWS for “electro-optics, networking, security, storage, and custom-designed solutions.”
Marvell’s Nova 1.6 Tbps PAM4 electro-optics have eight 200G lanes that “double the networking bandwidth while reducing power and cost per bit by 30%.” According to the press release, “by doubling the bandwidth per lambda, the Nova-based modules reduce the number of lasers and related optical components by 50%.”
Marvell hopes to help data centers transition to 51.2 Tbps networking architectures by offering a platform that needs 32 optical modules instead of 64 optical modules.
AI Networking
A few years back, we discussed that Nvidia acquired Mellanox for the strategic synergy that InfiniBand and Ethernet can provide in boosting GPU performance. Without proper interconnection, GPU performance could be limited, and so Nvidia strategically wanted to create the best-case scenario of owning both markets for AI accelerators — and their fabric and interconnects.
Mellanox supports Virtual Protocol Interconnect (VPI), which allows the ubiquitous Ethernet to provide bandwidth as cheap as possible, and InfiniBand to deliver higher throughput and fewer bottlenecks during high loads. In 2019, the split in Mellanox’s revenue was about 40% InfiniBand and 60% Ethernet. By leveraging a hybrid of Ethernet and InfiniBand, Mellanox was able to take market share from Ethernet incumbents.
The acquisition went under review in China, with officials believing Mellanox’s market share at the time was about 55% to 60% of the global interconnect market and 80% to 85% of the Chinese market. This illustrates how popular Mellanox was before Nvidia acquired the company.
The outcome of the review was that Nvidia was required to decouple the sale of InfiniBand from the sale of its GPUs to where a customer could buy one but not the other at no penalty. Even if a customer can buy them separately, there are many cases where it’s not practical to do so, such as with the DGX and HGX systems which achieve optimal performance with the A100s/H100s and InfiniBand.
Nvidia has stated that InfiniBand increase the effectiveness of AI infrastructure by 20% to 30%. Remote Direct Memory Access (RDMA) reduces CPU overhead by offloading data movement to network adaptors. In addition, Ethernet has quality of service (QoS) flow control and advanced error handling mechanisms that increase its network efficiency capabilities.
Ethernet Vs InfiniBand
I wish I could make networking more conversational, but it’s pretty challenging to do that! Here are some bullet points on how the two compare; I’ve bolded the more important takeaways:
Benefits of Ethernet:
Raw bandwidth is a benefit with Ethernet hitting 51.2 Tb/s two years ago with support for 800 Gb/s port speeds. InfiniBand lags by topping out at 51.2 TB/s with 400 Gb/s port speeds. Although typical server nodes do no need the extra bandwidth, AI clusters come with 400 Gb/s NIC per GPU with some nodes having four to eight GPUs. By 2025, Dell’Oro believes switch ports for AI networks will be operating at 800 Gb/s and will further double to 1600 GB/s by 2027.Dell’Oro believes switch ports for AI networks will be operating at 800 Gb/s and will further double to 1600 GB/s by 2027.
smartNICs and AI-optimized switch ASICs help to reduce packet loss
Large pool of vendors whereas InfiniBand increases dependency on Nvidia.For this reason, AWS and Google Cloud have remained on Ethernet as they prioritize custom silicon.
Ethernet is the incumbent networking standard and most cloud providers have invested heavily here already. With Ethernet, providers don’t have to manage a new network stack.
Ethernet switching has evolved to where a new term has been coined “lossless” Ethernet. Even Nvidia is moving in this direction with their Spectrum X platform.
Benefits of InfiniBand:
Outperforms for AI/ML workloads due to low latency and by reducing packet loss. Data packets are sent in a serial approach so multiple channels of data can be sent simultaneously. This is much better for AI/ML than a parallel approach for internal data flow, which creates bottlenecks.
Has 3X to 4X lower latency than traditional Ethernet switches based on ASICs
Highly scalable, can support tens of thousands of nodes per subnet. InfiniBand is also cheaper as it requires fewer connections for reliability.
Its QoS and failover capabilities are a reason it’s adopted for high-performance computing environments.
Reduces CPU resources
So, why is Ethernet Making a Comeback?
Broadcom’s Jericho3-AI has some promising benchmarks that could help shift the dominant market share InfiniBand has in AI networking (or at least prevent a monopoly). These benchmarks showed the Jericho3-AI outperforming InfiniBand by 10%, which is substantial when dealing with AI systems as it’s enough to increase the collective operations of the system.
“Leveraging this unique functionality, the Jericho3-AI fabric provides at least 10 percent shorter job completion times versus alternative networking solutions for key AI benchmarks such as All-to-All. This performance improvement has a multiplicative effect on decreasing the cost of running AI workloads since it implies that expensive AI accelerators are used 10 percent more efficiently. The network, in effect, pays for itself.” — You can read the press release here.
This means bare metal can work more effectively. Per Broadcom: “because it can handle 800Gbps port speed (for PCIe Gen6 servers) and more, it is a better choice [than InfiniBand.” At high price points, all hyperscalers want to see their investments working at maximum clock times. This is achieved by better load balancing and congestion control to improve network latency, whereas InfiniBand reduces port and hop latency inside the switch. Broadcom calls their product differentiation “Perfect Load Balancing” and “Congestion-Free Operation.”
A note on PCIe
The maximum bandwidth supported by PCIe 5.0 is 400Gbps per port. By using 106Gbps PAM4 SerDes, ASICs can be tuned to support 100, 200 and 400 Gbps port speeds. To work around this, and to achieve 800Gbps, chip makers are building NICs directly into the accelerator.
Jericho3-AI supports 36 ports at 400 Gbps speed, and this can support Nvidia’s powerful DGX H100, which have 8 ports of 400 Gbps speed. In this case, four node racks are within Jericho’s capabilities. However, the Quantum-2 InfiniBand can handle 64 ports of 400Gbps, and so for Nvidia’s GPUs, it outperforms. Broadcom’s answer to this is that AWS and Google still prefer to not have vendor lock-in with Nvidia and use the Jericho3-AI to make use of their extensive Ethernet systems.
Overview of Custom Silicon (ASICs):
In addition to AI networking, Broadcom participates in the custom silicon market. ASICs are application-specific integrated circuits that are customized to perform a specific function for a specific application, hence the term “application-specific.” This is in contrast to GPUs which are more general-purpose. ASICs are expensive at the onset, yet become cheaper with volume production. We first published this graph in 2019 but the comparison still applies:
For now, custom silicon only makes sense for a company with deep coffers that has immensely popular applications – such as Google, Meta, Amazon. These companies use custom silicon to drive down costs on GPUs for their most popular applications. Across ASICs, the most well-known is Google’s tensor processing unit (TPU).
Google was one of the first to require low-power machine learning workloads for Search, YouTube and Google Maps. The compute intensive workloads were running on Nvidia’s GPUs for both training and inferencing until Google made their own processing unit, TPUs, to perform workloads at a lower cost and higher performance.
Performance between TPUs and GPUs is often debated depending on the current release (A100 versus fourth-generation TPU, for example). In some cases, TPUs have better performance per watt for power-constrained applications. Notably, some of this comes with the territory of being an ASIC, which is designed to do one specific application very well whereas GPUs can be programmed as a more general-purpose accelerator. In this case, the benchmarks where TPUs compete are object detection, image classification, natural language processing and machine translation — all areas where Google’s product portfolio of Search, YouTube, AI assistants, and Google Maps, for example, excels.
Notably, TPUs are used internally at Google to help drive down the costs and capex of its own AI and ML portfolio and they are also available to users of Google’s AI cloud services. For example, eBay adopted TPUs to build a machine learning solution that could recognize millions of product images.
Unless Google releases an internal technology as open-source, it won’t be adopted by the competitors. This is where Nvidia’s neutral position as traditionally a hardware company becomes a positive as it’s universally used by Amazon, Microsoft, Google — — and Alibaba, Baidu, Tencent, IBM and Oracle. Meanwhile, TPUs create vendor lock in (with a direct competitor) which most companies want to avoid. eBay is the exception here as the company needs Google-level object detection and image classification.
Why ASICs are Not a Near-Term Threat to GPUs
AI investors will need to get comfortable hearing about the battle between ASICs and GPUs. This debate has been going on since at least 2018, when Nvidia’s biggest threat was thought to be Google’s custom TPUs. There is some merit to these concerns as the largest customers for Nvidia’s GPUs have enough cash to make custom chips. There’s roughly $35B to $40B per Big Tech company per year that executives will naturally want to optimize to drive down costs.
To program ASICs is difficult, and they are application-specific, which means they cannot be reconfigured. Nvidia is wildly popular because GPUs are easy to program and are the best choice for a wide range of applications. Developers create the moat, which was our original Nvidia thesis. Therefore, I don’t believe there is much risk that Big Tech commercializes AI accelerators.
However, it’s quite plausible that someday Big Tech will reallocate capex toward more ASICs and fewer GPUs to where it will impact Nvidia. For now, demand outstrips supply, and there are long lead times for Nvidia’s GPUs. If a company like Google reallocates to more TPUs, another enterprise will certainly step up to fill those orders.
VMWare –Software-Defined Networks and Data Centers
In November, Broadcom closed its acquisition of VMware for $69 billion. VMWare is virtualization software that virtualizes compute and data centers. The software creates an abstraction layer, or a “hypervisor” which is the technical term for a computer or server that runs virtual machines called ESX. VMWare was the first company to virtualize x86 machines and was founded in 1998. Operating systems, such as Linux, Windows and MacOS, can share the same, virtualized resources by running on a x86 machine.
Over the past decade, VMware pivoted to offer a software-defined data center. On the Q4 earnings call, Broadcom discussed building essentially a private cloud on-premise, which has some advantages, such as lowering capex by pooling memory, security, networking and server resources. “Our strategy going forward is simply to enable global enterprises to run their applications across the other data centers as well as on public clouds by consuming VMware’s higher-value software stack.”
Later it was stated: “We are creating with VMware, the same experience of virtualization of the data center on-prem for those companies, which has workloads, by the way, that are already running VMware products that application that’s already written on VMware Cloud Foundation. This is then giving these enterprises the opportunity to have a hyperscaler on-prem. That’s the plan we’re doing, plain and simple.”
Where software defined networks have seen quite a bit of success is with 5G networks. SDNs separate the control plane on embedded switching systems. This allows the networks to be managed remotely. Products from different suppliers can be used without incompatibility issues. By using open APIs, the 5G market has benefited from a more neutral ecosystem by allowing products from different suppliers. This is because SDNs allow network functions to be programmed by APIs instead of proprietary interfaces.
In 2012, VMWare acquired Nicera to create VMware NSX, virtual networking and security software that virtualizes network components. The NSX products, including NSX-T data center, programmatically creates and manages virtual networks from Layer 2 to Layer 7, which is defined as switching, routing, access control, firewall and QoS. NSX Manager and transport nodes can be assembled in seconds for proof-of-concept deployments, deployments with up to 64 hosts, or large-scale environments. Software-defined networks have a natural synergy with Broadcom, the leader in networking hardware.
A few years ago, VMWare expanded to virtualize containerized workloads for Kubernetes clusters. This product is referred to as Tanzu. This was a necessary evolution to keep cloud native customers. Many Kubernetes clusters use something called a multi-tenancy solution, which is to have non-connected “tenants” use a common pool of resources. This can be hard to implement correctly, and also has limited functionality once it’s set up. Virtualized containers are similar to a single-tenancy solution by having its own API server, controller manager and storage for data. Yet, it’s similar to a multi-tenancy solution by using a common pool of resources. Per the Broadcom Q4 earnings call: “And to attract and keep these workloads across the environment, we are investing in a rich catalog of microservices tools. This will be our focus. And the noncore businesses of end-user computing and Carbon Black will be divested.”
All of this sounds good, but virtualization is not a wild success. The software defined data center market at one time was expected to reach $77 billion by 2020 but instead has only reached $28 billion as of 2023. There are many vendors in the space, which creates pricing wars.
Broadcom Technical Analysis
By Portfolio Manager Knox Ridley
We still believe AVGO is in a large uptrend, so the recent volatility was used to layer into this position. Even though we are seeing a bounce, there is a chance that AVGO’s correction is not over. This setup would see the current bounce fail, and then a breakdown below $1200. If this happens, we will look to add to AVGO between the $1150 – $1000 region. On the other hand, if we hold the $1200 level, we can keep pushing higher into the $1600 region. A breakout over $1365 would signal this scenario is likely playing out, which we would also use as a signal to buy into strength.
Conclusion
Broadcom belongs to our AI portfolio. Over the next few years, Big Tech is likely to diversify away from Nvidia’s GPUs, plus Ethernet networking continues to be upgraded for AI purposes, which means Broadcom should be on our radar. It’s not only the AI revenue that sets Broadcom apart, but also its developing software strategy with VMWare makes it an ideal choice.
Pro premium members receive deep-dive research on all the stocks in the portfolio and quarterly earnings kickoff webinars. In addition, the Advanced Market Signals Members receive regular technical and broad market analysis and weekly webinars from our Portfolio Manager, Knox Ridley. Learn more here.here.
Lam’s Q3 report was nothing too spectacular, with a slight revenue beat in the quarter and a solid EPS beat. Q4’s guide pointed to relatively flat revenue and a slight sequential decline in EPS.
We have a 4% placeholder on Lam, which may be a tad early for the material rebound that is expected 2025-ish. Primarily, Lam’s rebound is dependent on NAND recovering. Discussions around the incoming NAND rebound were important, as well as the discussions on DRAM.
China is both an opportunity and a risk for Lam. China’s revenue contribution remained above 40% in the quarter, though Korea’s contribution increased 500 bp sequentially to 24%, suggesting major memory manufacturers may be increasing WFE (wafer fabrication equipment) spend. Given the high exposure to China, there is risk in more customers being added to the banned entity list, which would result in a loss of revenue for Lam.
Overall, this is not the standout quarter for Lam and we didn’t expect it to be. Instead, we were provided important clues as to when the standout quarter might occur. The story is intact, the fundamentals have likely bottomed, yet the stock is overvalued and has been for some time. Therefore, primarily due to valuation concerns, we realize the allocation we currently have is unlikely to be our lowest entry.
Revenue and EPS:
Lam’s revenue peaked in Q2 FY2023, with the current FY2024 Q4 guide pointing to flat revenue for three straight quarters as Lam digests a trough in NAND spending coupled with strong China and DRAM demand. Fiscal Q1 is expected to break this trend with revenues projected to push back to $4 billion and higher.
Revenue of $3.79 billion beat estimates by 1.6%, representing a YoY decline of (2.1%) but a QoQ increase of 0.9%.
For fiscal Q4 (June 2024 quarter), Lam guided for revenue of $3.8 billion, +/- $300 million, representing YoY growth of 18.5% and approximately flat QoQ growth at midpoint. Prior to earnings, our information shows QoQ growth in the September quarter of 6% and December quarter of 7%.
GAAP EPS of $7.34 beat estimates by $0.50, representing YoY growth of 22.1%. Non-GAAP EPS of $7.79 beat estimates by $0.49.
Q4’s GAAP EPS was guided at $7.20, +/- $0.75, representing YoY growth of 20.6% and a QoQ decline of (1.9%) at midpoint. Non-GAAP EPS was guided at $7.50, +/- $0.75, implying YoY growth of 25.4% and a QoQ decline of (3.7%). Same as revenue, the September quarter and December quarter is when QoQ growth returns.
Margins:
GAAP operating margin contracted slightly on a QoQ basis despite GAAP margin expanding due to customer mix in China. Q4’s margin outlook was also mixed, pointing to operating margin expansion and gross margin contraction.
It’s important to note that 46% is the normalized gross margin for Lam although customer mix can result in as high as 48% gross margin. Per management: “You're absolutely right, and thanks for mentioning the 46%. That's sort of where gross margin was after we had done some of the Malaysia stuff and before China popped up with those smaller customers. And so the fact that we're above that level is largely customer mix.”
Fiscal Q3’s GAAP gross margin was 47.5%, representing a 70 bp QoQ and 600 bp YoY expansion from 41.5%.
For fiscal Q4, Lam guided for a GAAP gross margin of 46.7%, representing an 80bp QoQ contraction but a 120 bp YoY expansion.
GAAP operating margin was 27.9% up 350 bp YoY from 24.4%.
Q4’s GAAP operating margin was guided at 28.3%, for a 40 bp QoQ and 170 bp YoY expansion compared to 26.6% in Q4 of last year.
GAAP net margin was 25.4%, essentially flat QoQ and expanding 440 bp YoY.
Cash and Debt:
Operating cash flow was $1.38 billion in Q3, compared to $1.76 billion in the year ago quarter. Lam’s OCF margin contracted from 44.6% a year ago to 36.5%.
Free cash flow was $1.28 billion, compared to $1.61 billion in the year ago quarter. FCF margin contracted from 41.5% a year ago to 33.7%.
Cash and equivalents totaled $5.67 billion.
Debt and finance leases totaled $4.98 billion.
The company allocated $860 million to share repurchases and paid $263 million in dividends in the March quarter. Management also added: “And I would just mention, we continue to track towards our long-term capital return plans of returning 75% to 100% of our free cash flow.”
Key Metrics:
DRAM Revenue Dips QoQ:
We highlighted DRAM as one of the primary growth drivers for Lam coming out of this memory trough over the course of the next few quarters as Samsung, SK Hynix, and Micron work to significantly boost HBM3 and HBM3e production to meet elevated demand from Nvidia and AMD’s GPUs.
However, DRAM contributed only 23% of systems revenue in fiscal Q3, or ~$551 million, compared to 31% of revenue, or ~$713 million, last quarter. Through the first three quarters of FY24, DRAM revenue totaled ~$1.737 billion, an increase of ~73% YoY.
Management stated the following about the sequential weakness in DRAM: “I do just want to mention one thing. We are characterizing 1 customer's investment in specialty DRAM as a nonvolatile investment since it has a nonvolatile component to the device.”
The weakness is also relative as during peak revenue in the Q2 FY2023 quarter, DRAM was 11% of revenue. So, even with this sequential weakness, it’s more than doubled in percentage of revenue from what it was at the cyclical top.
Non-Volatile Memory (NVM) Sales Pick Up:
Though DRAM’s contribution dipped sequentially, NVM sales offset much of this, rising from 17% of systems sales last quarter to 21% in Q3. Overall, memory accounted for 44% of Lam’s total systems sales in the quarter, down from 48% last quarter but up from 32% in the year-ago quarter.
Overall, systems sales rose to a ~63% contribution to total revenue, up from 61% in the prior quarter and marking a third consecutive quarter of increasing contribution. This suggests demand remains healthy.
Earnings Call:
Key Product Commentary and Timing for 2025-ish:
HBM and DRAM:
Our thesis is two-fold and management explained both points nicely in the call. The first is that we want to participate in the high bandwidth memory (HBM) boom being driven forth by AI acceleration. Our Members are quite aware of this trend as we’ve been hammering on it for a few quarters.
Here is what management stated about how Lam participates in this trend: “With respect to DRAM, AI servers use high-bandwidth memory or HBM to increase read write speed and reduce server power consumption. HBM stacks multiple DRAM dies using TSVs enabling 15x more data throughput than standard DRAM. However, HBM also requires an approximately threefold increase in wafers per bit compared to conventional memory. With this in mind, it's important that our SABRE 3D and Syndion tools not only provide best-in-class plating and etch capabilities, but also deliver industry-leading throughput and productivity to keep overall costs low for our customers. We are the leading player in TSV applications for HBM and expect our HBM related shipments to grow more than 3x in calendar year 2024.”
It was stated on the call that HBM is only 1-2 points of overall bit demand, and thus it’s “small today but growing quite rapidly.”
In terms of timing, especially as it relates to the CHIPS Act, which in turn will drive more equipment sales, the following was stated:
“And so we've always said these are more of a 25, 26, 27 time frame for — from the equipment side, especially the shorter lead time tools like we provide. So you see the fab coming up a lot of construction connectivity, you see long lead time tools go in. And then we know that our time will come. I mean — and so I think it's still a '25, '26, '27 opportunity for us. more of a 25, 26, 27 time frame for — from the equipment side, especially the shorter lead time tools like we provide. So you see the fab coming up a lot of construction connectivity, you see long lead time tools go in. And then we know that our time will come. I mean — and so I think it's still a '25, '26, '27 opportunity for us.
But the important thing is, while that's a lot of extra money maybe what's really exciting about is most of that is targeted towards to the leading-edge nodes […], but it's at nodes where we believe that we will actually do better from a SAM and market share perspective. And so we're patiently waiting. But we know it's going to come. You can go visit the sites, the fab buildings are there, and they're feverishly working to get them ready for equipment.”that we will actually do better from a SAM and market share perspective. And so we're patiently waiting. But we know it's going to come. You can go visit the sites, the fab buildings are there, and they're feverishly working to get them ready for equipment.”
The bigger picture at full utilization is that GPUs and AI servers will drive 8X DRAM and 3X NAND, which will equal “$1 billion to $1.5 billion incremental WFE” for every 1% server penetration, according to Lam.
NAND/Storage:
Non-volatile memory’s (NVM) acceleration this quarter could imply that the NAND uptick is already beginning, with a greater contribution expected in 2025. Since Korea commands a significant global share in both DRAM and NAND, its increased revenue share, at 24% in Q3 (up from 19% last quarter and 16% two quarters ago), hints at NAND spending and utilization resuming given that DRAM sales were weaker.
According to management, “More advanced AI applications need faster, more power-efficient and higher-density NAND storage. NAND-based enterprise solid-state drives or eSSDs, are 50x faster in read write capability, 2 to 5x more power efficient and use 50% less space at the system level compared to hard disk drives or HDDs. Today, over 80% of enterprise data is stored on HDDs. And we expect this mix to shift in favor of SSDs as NAND capability and cost continues to improve.”
In terms of timing and the 2025 rebound that is expected industry-wide, Lam stated the following:
“I mean, clearly, we all know that the NAND spending has been incredibly weak for the last 12 to 18 months. And so we're in the very early stages of starting to see that recover. And I think if you look at what most of our — we rely on our customer commentary that they make publicly for a lot of this, but they talk about the fact that maybe 90% of the bits they're shipping are at the leading edge.
But when we look at the installed base of our systems, that was my comment. I believe that there is still going to be a large portion of the installed base that will move forward to the next technology nodes. It's the most efficient way for our customers to to do that is to upgrade what they already have. And I think you'll see that move forward and therefore, NAND WFE move up in '25. But because it comes through a large — to a large degree, through upgrades, Lam's capture rate of every dollar of WFE spend will be much higher than in a greenfield capacity added. So when I think about Lam's opportunity to outperform in 2025, in NAND, I think it is obviously with high confidence because of the type of spending we would expect to be seen in 2025. And in the other market segments, it's also pretty high because of the — as I mentioned, the technology inflections that are occurring […] And so I just feel like there are a number of growth drivers for the company besides the one that is the most obvious, which is a NAND recovery in 2025.”And I think you'll see that move forward and therefore, NAND WFE move up in '25. But because it comes through a large — to a large degree, through upgrades, Lam's capture rate of every dollar of WFE spend will be much higher than in a greenfield capacity added. So when I think about Lam's opportunity to outperform in 2025, in NAND, I think it is obviously with high confidence because of the type of spending we would expect to be seen in 2025. And in the other market segments, it's also pretty high because of the — as I mentioned, the technology inflections that are occurring […] And so I just feel like there are a number of growth drivers for the company besides the one that is the most obvious, which is a NAND recovery in 2025.”
Gate All Around Technology Nodes:
In August, our deep dive discussed how gate-all-around transistors are replacing FinFET transistors. The company stated that shipments for gate-all-around nodes will exceed $1 billion this year. Per management, this is just starting:
“we're really just starting at gate-all-around. Our comment was $1 billion of shipments into the gate-all-around nodes this year. And it's across all of our types of products that help enable gate-all-around smaller technology nodes. And so what we've said is that every technology node, etch and depth intensity grows and our SAM opportunity expands.”
Utilization is Improving, Further Supports 2025 Recovery
Lam offered a lucid discussion around how utilization rates are showing signs the 2025 recovery is on track.
In the opening remarks it was stated: “In NAND, we continue to expect year-on-year growth in WFE spending in calendar 2024. Encouragingly, we have seen an uptick in fab utilization. And in the March quarter, this has translated into double-digit percent growth quarter-over-quarter in our spares revenues. As supply and demand continues to normalize through the remainder of the year, we see a strong setup developing for 2025 NAND spending. As supply and demand continues to normalize through the remainder of the year, we see a strong setup developing for 2025 NAND spending.”
There was follow-up on this in the Q&A:
However, through this downturn, the cuts in fab utilization were so severe that we actually saw spares revenue come down, which surprised us a bit, so maybe to your point of expectations.
We knew that as soon as customers started to utilize the fabs and bring some of the tools back online, we would see spares increase. We said that would be the first sign that the end market was really starting to improve. And so the reason we called it out was that, obviously, it's — it further confirms, I think, what you're hearing from our customers, which is that utilization is starting to improve.it further confirms, I think, what you're hearing from our customers, which is that utilization is starting to improve.
It doesn't tie to WFE because utilization of what you have is one issue. When you choose to spend more to either upgrade technology or add capacity is a second decision. We've said that, that is likely still more of a 2025 event on the equipment spend side. But you have to get the first indication, which is utilization improvement, spares improving and then the rest would comeWhen you choose to spend more to either upgrade technology or add capacity is a second decision. We've said that, that is likely still more of a 2025 event on the equipment spend side. But you have to get the first indication, which is utilization improvement, spares improving and then the rest would come.
China Sales Remain High
It was discussed in-depth that China is first-half weighted and revenue from this region is expected to declining as the year progresses.
In the Q&A, it was brought up that perhaps management is expecting more weakness as the year progresses due to customers being added to the blacklist. It was not confirmed directly but also was not denied.
So I wanted to ask about China. So it's going to modulate through the year, the mix, but it sounds like it's still going to be up year-over-year for domestic China this year. So I guess my question is, we've seen some headlines on a few entities being potentially added to the entity list. And I'm wondering if these comments reflect the potential addition of these entities? Or does it basically say, hey, if the status quo remains, this is what your assumption is, meaning that if there were entities added that, that would be downside to these comments?And I'm wondering if these comments reflect the potential addition of these entities? Or does it basically say, hey, if the status quo remains, this is what your assumption is, meaning that if there were entities added that, that would be downside to these comments?
Yes. Tim, I mean, obviously, we can't forecast changes in U.S. trade policy with respect to China that we don't know about. And so we're basically giving you our best view of what we think our China business will be through the rest of the year and recognizing that there could be changes that we don't foresee. And so we're basically giving you our best view of what we think our China business will be through the rest of the year and recognizing that there could be changes that we don't foresee.
Well, what I will say is we — obviously, we've built up what we believe is a strong government affairs team were plugged into all the relevant discussions. And I think over the last couple of years, you've seen we have a pretty strong track record of working with the U.S. government responding to export control policy and that's just what we plan to do going on into the future.
Conclusion:
Lam has broken key support and it’s likely we trim some of the position with the goal of adding back at lower levels. Across the board, Lam is trading about 2X higher than its median top line and bottom-line valuations. The PE Ratio is 34 compared to a 3-year median of 19. The forward PE Ratio of 30 is easily the highest it’s traded in three years. It’s the same scenario for the top line. This report may not be enough to justify these valuations in the near-term. Therefore, you can expect us to actively manage this position as we try to seek whatever alpha we can find in the current market.
For reasons clearly outlined above, we expect this will be a high allocation for 2025. The company carries a level of complexity that we are comfortable navigating, and it’s to our benefit that management is being quite clear on when to expect their largest segments to rebound. Therefore, whatever we trim will be added back at lower levels.
Damien Robbins, Equity Analyst at the I/O Fund, contributed to this analysis
We’re seeing early shoots of the memory market rebound unfolding a bit earlier than expected, with strong results from Micron and a positive outlook from Samsung on its HBM output this year due to GPU growth.
This is following a rather steep cyclical downturn in NAND and DRAM in 2023, and this rapid recovery offers a growth opportunity for both memory chip makers and WFE suppliers including Lam Research, though it should be approached carefully with a chance for oversupply in 2025.
Despite a rather soft guide for the March 2024 quarter, Lam’s management alluded to multiple pockets of strength arising through the back half of the year, with positive commentary on HBM and DRAM as well as a brighter outlook for WFE spend. Memory is a mission-critical component for AI accelerators and the newest battleground in the market, and Lam is a major equipment supplier and beneficiary of capital intensity that follows each new generation of HBM.
This memory ‘arms race’ is forecast to translate into strong revenue growth to potentially a record level, improved leverage and >35% EPS growth in fiscal 2025 (June 2024 to June 2025) From there, growth is expected to continue at a high-teens, low 20% rate through fiscal 2026. We look at this and more below.
For a deeper overview of Lam and its products and segments, refer to our August 2023 deep dive here.August 2023 deep dive here.
DRAM Market Overview: Rebound Unfolding
The DRAM market is exhibiting signs of rebounding from 2022 and 2023’s steep decline:
Industry revenues declined more than (35%) YoY from $80.1 billion in 2022 to $51.9 billion, according to TrendForce.
DRAM industry revenue in the fourth quarter rose 29.6% to nearly $17.5 billion, setting the stage for growth throughout 2024 as prices rise.
DRAM prices were projected to rise 13% to 18% QoQ in Q1, followed by a more modest 3% to 8% QoQ projected increase for Q2.
Micron is expecting DRAM pricing to increase throughout the calendar year, as surging HBM and DDR5 demand tightens leading-edge DRAM supply.
These strong pricing trends and a surge in HBM revenue, from 8.4% in 2023 to 20.1% this year, are expected to aid DRAM revenue growth for the full year, with growth estimated at over 62% YoY to $84.2 billion – this is 5% higher than 2022’s level.
HBM Shipments to Surge in 2024 and 2025
With a surge in demand for GPUs, the HBM market is poised to grow at a rapid pace in 2024, and then extend this growth into 2025. HBM bit shipments are estimated to rise 147% YoY to 1.18 billion GB, leading to a projected 156% YoY increase in HBM revenues to $14.1 billion. This follows a 93% YoY increase in bit shipments and a ~104% increase in revenue in 2023.
Commentary and outlook from the three major players in the market demonstrate just how strong this growth is that we’re beginning to see.
Micron’s management expressed how strong AI server demand was “driving rapid growth in HBM, DDR5 (D5) and data center SSDs,” adding that its “2024 volume as well as pricing is all locked up.” For 2025, HBM volumes “are largely allocated. A vast majority of our production supply is allocated, and some of the pricing is already firmed up. Keep in mind, this has never happened before, right, that we are talking about 2025, and we are sitting in CQ1, and we already have so much discussion around supply and pricing for 2025 getting locked up here as we speak.”
Micron also raised a crucial point, with comments regarding Nvidia’s new Blackwell GPU lineup – the architecture “provides a 33% increase in HBM3E content, continuing a trend of steadily increasing HBM content per GPU.” This trend for higher memory content to support larger and faster GPUs is likely to continue especially as chipmakers such as AMD work quickly to encroach on Nvidia’s share with comparable or faster GPUs.
Samsung is planning a “2.9-fold increase in HBM chip production volume this year, up from the 2.5-fold projection previously announced at CES 2024,” and is “projecting a 13.8-fold surge in HBM shipments by 2026 compared to 2023.”
Lam Well Positioned to Capture HBM and DRAM Growth
Lam is well positioned to capitalize on this growth in HBM and DRAM, as Samsung, Micron and SK Hynix work to significantly boost HBM TSV capacity this year.
The trio combined for an estimated capacity of ~93K units per month at the end of 2023, and are estimated to boost HBM TSV capacity to 270K to 275K units per month by the end of 2024. As a result, Lam is expecting its “HBM-related DRAM and packaging shipments to more than triple year-on-year and outpace WFE growth in this segment by a significant margin” in 2024.
CEO Timothy Archer added that in HBM, Lam is seeing “very, very strong demand. I think that whether or not at some point, it's shipping above peak, I think that this AI market is continuing to evolve at a very, very fast rate. And all we're focused on right now is ensuring we are building out our own capacity and capabilities. And ensuring that we maintain that technology leadership that's allowing us to hold 100% market share of the TSV formation in HBM.”
We had pointed out in our August 2023 deep dive that while all three segments are important to monitor for forward growth, for a true recovery, we would need to see memory and DRAM bottom as it’s a substantial part of Lam’s business.
HBM capacity expansion, the shift to DDR5, and shipments to China have kickstarted a strong rebound in DRAM sales – in the December quarter, memory systems revenue reached 48%, a 10-percentage point increase from 38% in the September quarter. Lam noted that DRAM reached “record levels on a dollar basis, coming in at 31% of systems revenue compared with 23% in the September quarter.”
Non-volatile memory (NVM) ticked up to 17% of systems revenue in the December quarter, up from 15% in the prior quarter, though this remained significantly lower than the ~40% the segment contributed through the end of 2022 as NAND customers aggressively cut capacity in response to oversupply and elevated inventory levels. Lam noted that this was at “historic lows” for NVM, and the “slight growth was predominantly related to investments in certain technology projects.”
This has marked a pretty significant mix shift over the past four, even six, quarters – in the first half of 2023, DRAM was at just 9% of systems revenue, before rising to 31% in the December quarter.
In dollar terms, here’s what this growth in DRAM looks like:
Essentially, in two quarters – June 2023 to December 2023 – Lam has seen DRAM revenues rise 363%.
As noted earlier, management is expecting “HBM-related DRAM and packaging shipments to more than triple” this year, suggesting that DRAM systems sales could push past $1 billion by the end of FY24 (June 2024 quarter). Such growth can help offset the near-term weakness in NVM until NAND spending and upgrades resume.
Positive WFE Spending Outlook
Lam’s management shared a rather cautious view on its WFE spending outlook for the first part of the year, but expressed optimism on a recovery and strong exit to 2024 leading to a “robust” setup for the WFE market.
Here’s what CEO Timothy Archer said in the December quarter earnings call:
“As we enter 2024, the business environment remains muted. However, we expect a modest recovery in memory spending to drive a stronger exit to the year. Our early view of WFE spending for calendar 2024 is in the mid- to high $80 billion range. Growth in DRAM will be driven by capacity additions for high-bandwidth memory as well as node conversions. NAND spending increases will largely come from technology upgrades. We see foundry logic spend growing in 2024 with higher leading-edge investment, offset in part by declines in mature node investment outside of China. Overall, we believe domestic China spending will be stable in 2024.early view of WFE spending for calendar 2024 is in the mid- to high $80 billion range. Growth in DRAM will be driven by capacity additions for high-bandwidth memory as well as node conversions. NAND spending increases will largely come from technology upgrades. We see foundry logic spend growing in 2024 with higher leading-edge investment, offset in part by declines in mature node investment outside of China. Overall, we believe domestic China spending will be stable in 2024.
Longer term, the setup for WFE investment is robust. With semiconductor revenues widely expected to reach $1 trillion around the end of the decade and device manufacturing complexity continuing to rise, we believe WFE spending will need to roughly double from today's levels. Lam's served markets of etch and deposition should outpace growth in WFE overall.”the setup for WFE investment is robust. With semiconductor revenues widely expected to reach $1 trillion around the end of the decade and device manufacturing complexity continuing to rise, we believe WFE spending will need to roughly double from today's levels. Lam's served markets of etch and deposition should outpace growth in WFE overall.”
Lam’s early view for the mid to high $80 billion range represents just single digit growth YoY, with a majority of the growth being driven by HBM, which we are seeing signs of within DRAM systems sales. NAND spending cuts are likely weighing down on WFE spend, as management noted that memory WFE fell nearly 40% in 2023 on greater than 75% spending cuts in NAND.
NAND Upgrades to Aid Beyond 2024
While 2023 was extremely tough for NAND and in turn the broader memory WFE market, Lam sees a rather large opportunity to capitalize as NAND capacity comes back online due to the fact that there will be a high percentage of technology upgrades this cycle. Archer was hard-pressed for details on how this NAND recovery would unfold in the December quarter earnings call, and his comments alluded to Lam being able to capture these tech upgrades.
Archer explained in response to Cantor analyst C.J. Muse about NAND’s recovery and timeline for normalization that “as we see NAND growing — recovering and growing at a certain percentage rate, Lam will actually significantly outperform that rate because of the fact that most of that is coming from upgrades.”
And in response to BofA analyst Vivek Arya about current NAND demand and the outlook for H2 this year, Archer said that there is “a tremendous amount of capacity that [has] been offline and we've said in the past that needs to be brought back online. And I think the question and the discussions we're having is [at] what technology node should that capacity be restarted. And in many cases, there is a very high likelihood that technology upgrade certainly will occur as that equipment is brought back into service.
And so in that case, we would actually begin to see a restart of some of the utilization driven revenue that we get from things like spares and services, as well as, at the same time, a restart of technology upgrade revenues. And that's why I think that from a NAND perspective this year, we think that will effectively represent the majority of the spend that occurs in this segment.”
These technological upgrades and resumed spending in NAND will help cement in a recovery to potentially record revenues in fiscal 2025 – while the near-term rebound is more DRAM-centered, NAND’s rebound may unfold as the bigger story, given that NAND’s best-ever quarter was larger than NAND revenue in all of last year.
Double Digit Revenue Growth Through FY26 to Drive Strong Earnings Leverage
While the March quarter guide (fiscal Q3) was soft, pointing to a ~(4.4%) YoY decline at midpoint, fiscal 2025’s outlook (beginning in July of 2024) is much brighter, boosted by DRAM’s surge and NAND’s recovery.
Fiscal 2024 is expected to see a (15.2%) revenue decline to just under $14.8 billion as a result of this sharp memory WFE decline in calendar year 2023. Fiscal 2025 (beginning in July of 2024) is expected to see an 18.7% increase to a record $17.55 billion on DRAM-fueled tailwinds.
Fiscal 2026 is projected to see revenues top $20.2 billion, representing an increase of 15.6% YoY; NAND technological upgrades and continued DRAM spending are likely the main drivers of this growth.
We noted in our August deep dive that an inflection in Systems’ revenue contribution would offer further evidence that Lam had bottomed — during periods of strong demand, the breakdown is about 65%/35% between Systems and CSBG. This reflects strong sales of new hardware and the steady growth of the aftermarket that follows. During periods of weaker demand, the percentage of hardware sales decreases and aftermarket increases because there are fewer new systems sales and the aftermarket is primarily done on existing capacity.
Systems inflected in September, contributing 59% of revenue before rising to 61% of revenue in the December quarter, likely aided by this strength in DRAM sales.
In addition, we’re seeing evidence that CSBG revenue may have bottomed in the September quarter, rising 2.3% QoQ in the December quarter. Reaching this inflection point serves as an early sign that customers are planning to increase utilization. Increased utilization and higher systems sales go hand in hand, as customers boost both to capture growth in periods of higher memory chip demand.
This path to possible record revenues in FY25 and $20B+ in FY26 sets the stage for strong EPS growth. Lam has demonstrated a tremendous ability to grow earnings in the past. For example, from fiscal 2019 to fiscal 2023, Lam grew its EPS from $13.70 to $33.21.
Despite a hit to EPS in fiscal 2024 from the revenue decline and margin pressure Lam is experiencing, earnings growth in fiscal 2025 and fiscal 2026 is expected to be robust, at 22% and 26% YoY – this is faster than Lam’s earnings growth in fiscal 2022. Fiscal 2026 is estimated to see Lam generate nearly $43 in GAAP EPS, almost 54% higher than its $28 estimate for fiscal 2024.
In addition, Lam said that its new Malaysian manufacturing facility is “poised to fully scale in the coming WFE upturn, providing us the capability to nearly triple the percentage revenue contribution from our lower cost manufacturing locations versus a few years ago.” Bringing more lower cost manufacturing online provides room for operating margin expansion, which paves the way for increased operating leverage as revenue accelerates over the next two fiscal years.
However, one thing to watch is whether we see a ‘V’ or ‘U’ shaped rebound for margins. In the last memory downturn in 2019, operating margin recovered in a U-shaped fashion, taking five quarters to reclaim its 2018 levels after bottoming in December 2019. We’ve seen a rather swift contraction in TTM operating margin through 2023, and subdued revenue growth in FY24 is likely to remain a headwind on this margin rebound.
China Risks
China presents a rather real risk to Lam, not only due to rising geopolitical tensions and export restrictions, but also because the country is a primary revenue driver, contributing 40% of revenue in the December quarter, up from 26% in the June quarter.
Lam’s China revenue increased nearly 14% YoY in the first half of fiscal 2024 to $3.18 billion, while sales to Lam’s second largest segment, Korea, declined almost (35%) to $1.26 billion. It’s not necessarily that Lam is driving much higher revenue from China, as revenues are well within historical norms, but rather than China’s strong demand in the first half of the fiscal year is offsetting global weakness – the revenue trough has been significantly minimized by China. Should Lam face increased difficulties selling to China in the remainder of FY24 and into FY25 due to export restrictions, the revenue recovery may be at risk.
However, this is not solely isolated to Lam, as peers are also seeing increasing China contributions. ASML’s China systems sales reached 49% in its first quarter, versus a single-digit percentage just a year ago, while KLA’s China sales reached 41% in the December quarter, versus 23% in the prior December quarter.
Fiscal Q3 Earnings Preview
Lam’s fiscal Q3 (March 2024 quarter) is expected to be the last quarter of its revenue trough, with revenue expected to inflect back to YoY and QoQ growth in the June 2024 quarter. Sentiment in semis was weak last week heading in to Lam’s report this week. Primarily, the lackluster response to TSMC’s solid top and bottom line beat, the selloff following ASML’s weak bookings and a sharp industry-wide selloff to end last week.
Here are our notes for the upcoming earnings report:
Revenue and EPS:
Lam guided for $3.7 billion, +/- $300 million in revenue for the March quarter, pointing to a YoY decline of (4.4%) at midpoint.
GAAP EPS was guided at $6.90, +/- $0.75, representing YoY growth of 14.8% at midpoint. Non-GAAP EPS was guided at $7.25, +/- $0.75, representing YoY growth of 3.7% at midpoint.
Analysts expect revenue of $3.73 billion and non-GAAP EPS of $7.30, slightly above the midpoint of both figures. The EPS figure has been revised 9.32% higher over the last 3 months, revised 9.32% higher over the last 3 months, suggesting analysts are looking for improved operating leverage aiding bottom line growth.
Margins
Lam guided for GAAP gross margin of 47.2%, +/- 1%, and non-GAAP gross margin of 48.0%, +/- 1%. This would represent a 570 bp expansion for the GAAP margin and a 400 bp YoY expansion for the non-GAAP margin at midpoint.
am guided for a GAAP operating margin of 28.1%, +/- 1%, and non-GAAP operating margin of 29.5%, +/- 1%. This would represent a 370 bp YoY expansion for the GAAP margin and a 120 bp expansion for the non-GAAP margin.
This YoY improvement in GAAP margins is aiding the earnings leverage that Lam is seeing, calling for double-digit YoY GAAP EPS growth on a decline in revenue. GAAP operating margin is approximately flat QoQ, hinting that the margin recovery may take more of a U-shaped pattern.
What to Watch:
Systems sales mix: Systems sales have steadily increased from 53% of revenue in the June quarter to 61% of revenue in the December quarter, suggesting healthy demand for new hardware in the market. Ideally, systems sales will maintain this 61% mix or increase it slightly in the March quarter.
DRAM systems revenue: Given management’s commentary about tripling HBM-related DRAM and packaging revenue this year and DRAM’s surge from 9% to 31% of systems revenue, we’re watching for continued growth here. DRAM systems sales have increased by $550 million, from $155 million to $718 million, and while a $1 billion quarter in Q3 is unlikely, strong double-digit sequential growth further supports the story that we will see a $1B+ DRAM systems revenue quarter in the next couple of quarters.
Q4 guide: Though this is rather obvious, Q3’s guide will ultimately be one of the more important pieces of the report, as Lam is expected to shift back to double-digit YoY revenue and EPS growth in fiscal Q4 (the June quarter) – however, QoQ growth is minimal, estimated at less than $60 million, so ideally we would like to see Q4’s revenue guide pointing to a QoQ increase. Analyst estimates are projecting 17.9% YoY revenue growth to $3.78 billion and 22.2% YoY EPS growth to $7.31, just $0.01 higher than the $7.30 estimate for Q3.
Conclusion
Lam is a primary beneficiary of this memory upcycle driven by GPU upgrades, with memory being the current battleground rather than computing power. Q3 is expected to be the inflection point for revenue and EPS growth before Lam returns to double-digit growth rates. DRAM systems sales have been surging as memory chipmakers work to rapidly expand HBM3 and HBM3e production, while NAND sales have been sluggish over the past couple quarters as spending has not yet resumed.
Lam Research reports after the bell on Wednesday. This research helps us get ready regardless of what’s reported. Our goal over the next few quarters is to build a bigger position in Lam Research. However, we need to see what comes from this report before we determine when to layer-in. As you know, we initiated a starter position this past quarter. This refreshes our analysis from August and we look forward to updating you post-earnings Wednesday evening.
Damien Robbins, Equity Analyst for the I/O Fund, contributed to this analysis
Netflix kicks off tech’s Q1 earnings season on Thursday, and is setting a high bar after guiding for a first quarter revenue acceleration and nearly double-digit margin expansion. Netflix returned to double-digit growth in Q4, and guided to 13.2% YoY revenue growth, the fastest growth rate since Q4 2021.
We noted in Q4’s post-earnings report that average revenue per member (ARM) would be one of the more important metrics to watch this quarter, after Netflix raised prices for the first time in 18 months last October. Commentary from management implied we would see ARM return to growth in 2024 after being flat to negative throughout 2023.
Despite not yet being a substantial driver of growth, management was optimistic about the ad tier, saying they expect strong growth off a small base this year to transition ads into a “substantial revenue stream” in 2025 and beyond. Netflix has not updated its ad tier subscribers since January, so an update may be in store.
Notably, Netflix has gone through a phenomenal turnaround on the bottom line and this was the primary reason we added the stock to our portfolio about 18 months ago. Earnings continues to grow while cash flow is pausing on growth, per current estimates and commentary. We detail this and more below.
Revenue and EPS:
Netflix guided for $9.24 billion in revenue in Q1, representing YoY growth of 13.2%, with a three percentage point headwind from the devaluation of the Argentine peso relative to the US dollar. On a constant currency basis, this represents approximately 16% YoY growth.
Revenue growth is poised to continue accelerating through Q2, with estimates pointing to 16.3% growth in the June quarter before softening to the 14% range for the back half of the year. Q2 is still expected to mark ‘peak’ growth as was noted in January; however, revenue growth forecasts for 2025 have inched higher. Prior to Q4, revenue growth was projected to moderate to the 10% range, but now it is expected to hover in the 12% range.
Q1’s EPS guide called for more than 112% QoQ growth and 56% YoY growth to $4.49, which would be Netflix’s highest ever quarterly EPS print. Much of this EPS growth stems from margin expansion driving increased operating leverage – Netflix guided for operating income to increase nearly $1 billion sequentially to $2.42 billion, and that is flowing straight through to the bottom line with net income guided to rise by more than $1 billion sequentially to $1.98 billion.
This sets the stage for strong EPS growth for fiscal 2024 and into 2025. Current estimates call for EPS growth of 43.1% YoY to $17.22 in 2024, a strong double-digit acceleration from 20.9% growth in 2023. EPS growth in 2025 is projected to moderate to 23.2% YoY to $21.21.
Margins:
Operating margin expansion is one of the primary highlights for Q1’s upcoming report, with Netflix guiding for a 26.2% operating margin in the quarter, a ~930 bp expansion to the highest level in three years.
An operating margin in the mid to high-20% range is not out of the ordinary for Netflix in the first quarter, with margins in this ballpark in 2021 and 2022. However, Netflix increased its full year operating margin guide from 22.5% at midpoint to 24%, implying that margins through the remainder of the year will remain strong, and not as prone to sequential weakness as we had seen in 2021 and 2022.
Q2’s operating margin guide will provide clues as to how this will unfold – a guide for sequential growth would imply a weaker Q4 in line with historical trends, while a guide in the low 20% range points to steady margins and likely strong YoY expansion in Q4.
With this operating margin strength, net margin in Q1 is also expected to be very strong at 21.4%. This compares to 10.6% in Q4, and 15.9% in the year ago quarter.
Cash Flows and Balance Sheet
Cash flows have been a strong point throughout 2023, with Netflix more than tripling operating and free cash flows and driving more than 1500 bp expansion in operating and free cash flow margins for the full year.
Operating cash flow was $1.66 billion in Q4 and $7.27 billion in 2023, for a margin of 18.8% and 21.6% respectively. The 21.6% margin in 2023 marked a substantial 1520 bp expansion from 6.4% in 2022, as operating cash flow increased 259% YoY. For Q1, operating cash flow is expected to be just north of $2 billion, for a margin of ~22.0%.
Free cash flow was $1.58 billion in Q4 and $6.93 billion in 2023, for a margin of 17.9% and 20.5% respectively. Free cash flow increased 328% YoY last year, though growth is pausing – management guided for ~$6 billion in FCF this year, or a (13.4%) YoY decline with this lumpiness caused by the WGA and SAG-AFTRA strikes.
Netflix has more than $7.1 billion in cash and short term investments on the balance sheet, while debt totaled $14.5 billion.
Key Metrics: ARM, Paid Net Adds In Focus
Paid Adds:
Paid net additions were probably the strongest key metric in Q4’s report. Netflix reported 13.12 million paid net adds globally, driving global paid memberships up 12.8% to more than 260 million. This marked the fourth quarter of accelerating growth and the highest growth rate in eleven quarters for global paid memberships.
Management hinted that we would see strong paid net additions in Q1, saying that “similar to prior years, we expect paid net additions to be down sequentially (reflecting typical seasonality as well as some likely pull forward from our strong Q4’23 performance) but to be up versus Q1’23 paid net adds of 1.8M.” However, this leaves quite a wide range for where paid net adds could fall – Q4’s total paid net adds surpassed 13.1M, so technically, anything between 2M and 13M is fair game and would align with management’s commentary.
Consensus for paid net adds sits on the lower end of the range, at 4.11 million. Analysts from TD Cowen are expecting paid net adds of 5.11 million, noting the firm is “benefiting from a dual tailwind of paid sharing initiatives as well as strong underlying business demand from a robust, increasingly global content slate.” This 5.11 million expectation would correlate to global paid membership growth of almost 14.2%, suggesting analysts are looking for another quarter of acceleration in Q1.
ARM:
ARM also will be watched closely, given that it is expected to inflect back to growth and contribute to revenue growth instead of providing a headwind as it had in 2023. Netflix said for 2024, it expects “healthy double digit revenue growth…on a F/X neutral basis driven by continued membership growth as well as improvement in F/X neutral ARM as we adjust prices.”
As Netflix’s largest region by paid memberships, EMEA’s return to growth in ARM will be critical, given that it declined (1%) YoY to $10.84 in Q4 on an F/X neutral basis. Return to growth in APAC may take an extra quarter of two, given that Netflix has been struggling to improve monetization with ARM declining for seven straight quarters. UCAN ARM accelerated to 3% growth in Q4 from 0% in Q3, and further acceleration will help offset residual weakness in APAC in Q1 and potentially lighter growth in EMEA.
Ads:
With management aiming to make ads a more substantial revenue driver in 2025, updates on ad-tier subscriber count could be in store, following strong growth over the past three quarters and potential for partner deals like that with T-Mobile further boosting growth.
We have seen strong adoption of Netflix’s ad-tiers so far: subscribers tripled from 5 million in May 2023 to 15 million in November, before rising another 53% to 23 million in early January. Ad-tier subscribers now account for nearly 10% of Netflix’s total paid memberships.
In late January, all of T-Mobile's subscribers to its Netflix on Us deal, which previously offered a free Netflix Basic subscription, will convert to Netflix's Standard with Ads tier unless subscribers pay the difference for a plan without ads. Management explained that these kinds of partner deals are “very effective, very useful for us because that lower consumer-facing price means that we got room now to bundle the ads plan into a set of lower-priced partner offerings where it was hard to make the economics work for everyone previously.” This provides two outlets for growth –a surge in ad-tier users from those who do not wish to upgrade, and extra revenue dollars from those that pay the difference to upgrade.
Conclusion
Netflix has been delivering on its promise to shareholders with accelerating revenue and subscriber growth, greatly improved margins and cashflows, and strong EPS growth. A few metrics we are watching closely include ARM and paid net additions growth, given the strong numbers Netflix has reported recently.
We are also on the lookout for whether the ad tier’s strong initial adoption will begin to slow and/or if Netflix will run out of growth levers, though this may become more of a concern for 2025. With that said, an ad tier should greatly improve margins as we go along and that’s also central to the story beyond paid net additions. We will keep you in the loop on how we view Netflix’s peak growth in Q2 and the inevitable slowing growth come 2025 (or perhaps 2026) in the face of its impressive and expanding margins and cash flows.
Damien Robbins, Equity Analyst at the I/O Fund, contributed to this analysis
This article was originally published on Forbes on Apr 11, 2024,03:58 pm EDTForbes on Apr 11, 2024,03:58 pm EDT
Semiconductor stocks are standout performers so far in 2024, with investor appetite for AI stocks remaining elevated as AI chip leader Nvidia continues its streak of high growth. Numerous chipmaking equipment and chip stocks outperform the broader indices on a YTD basis – sixteen have YTD gains above 20%.
For years, the I/O Fund has published on semiconductors being the leaders in tech as the building blocks and common denominators for the decade’s largest tech trends, most notably AI and high-performance computing, but also EVs, robotics, 5G, and IoT. Our premium research urged our members to look closely at semiconductors across these trends dating back to 2019.
These emerging trends, coupled with strong demand for AI and HPC applications at the moment, set semiconductors up as an ideal investment, supported by strong free cash flow generation. Below, we update our semiconductor sector analysis to look at which companies have performed well in the most recent quarter, and also which companies stand out on a forward-basis with revenue growth estimates, profits, cash flows and earnings surprises. We also look into key management insights.
Top Semiconductor Companies with the Highest Quarterly Revenue Growth Rates
Nvidia led the semiconductor sector with 265.3% YoY revenue growth in Q4.
It should’ve been an easy guess that AI’s de facto leader Nvidia would sit atop the list here, as it reported more than 265% YoY revenue growth to $22.1 billion in its fourth quarter. Nvidia CFO Colette Kress said that Q4’s “data center revenue of $18.4 billion was a record, up 27% sequentially and up 409% year-over-year, driven by the NVIDIA Hopper GPU computing platform along with InfiniBand end-to-end networking. Compute revenue grew more than 5x and networking revenue tripled from last year.”
AI fueled gains outside of Nvidia as well – Micron is emerging as a big winner from surging AI demand. Micron’s recovery looks to be in full force as it reported nearly 58% revenue growth, driven by strong AI demand and increased pricing power stemming from a tighter supply environment.
However, we saw pockets of strength outside of AI – indie Semiconductor and Navitas Semiconductor both reported over 110% revenue growth, with primarily automotive and industrial end markets. ACM Research reported 57% revenue growth, and Qorvo followed with 45% revenue growth due to content gains at its single largest customer.
Sign up for I/O Fund's free newsletter with gains of up to 221% – Click hereClick hereClick here
Q4 Revenue Surprise
Cirrus Logic and ACM Research both beat quarterly revenue estimates by more than 14% in Q4, while AI favorites Micron, Arm, and Nvidia each beat by more than 7.5%.
Cirrus Logic reported a significant 14.6%, or $79 million, revenue beat in the December quarter (its fiscal third quarter) as it posted a record $619 million in revenue on strong smartphone shipments. This represented 29% QoQ and 5% YoY growth. Management said the $619 million was “significantly above our guidance range, as sales of components shipping and smartphones exceeded our expectations, driven by strength in orders from our largest customer. Shipments stayed strong throughout the quarter, including the first holiday week, and we also benefited from an additional week of revenue in the quarter.” This uptick in smartphone shipments also aided Qorvo, who beat estimates by 7.1%.
Three of the Street’s AI favorites — Micron, Arm, and Nvidia — all beat revenue estimates by 7.6% to 8.8%. Strong AI-fueled memory chip demand aided Micron’s growth in the quarter, while strong GPU shipments and still-dazzling data center revenue growth served as a major contributor to Nvidia’s $1.6 billion revenue beat. Arm’s $61 million revenue beat was driven by record royalty revenue, with royalties for the newest v9 design underpinning the latest AI chips and other advanced smartphone chips, double that of the v8.
If it’s not obvious which chip stock would hold the crown for the highest estimated revenue growth for Q1, then you’ve been living in a cave.
Nvidia leads the sector with a blazing 237% estimated revenue growth rate for Q1, to an estimated $24.2 billion. Growth in Q1 is expected to be driven by sequential growth in data center revenues, as Big Tech companies continue to quickly snap up GPUs. Nvidia has been on a streak of beating-and-raising by approximately $2 billion over the past couple quarters, and it will be looking to keep this streak alive in the first quarter. Analysts have had an extremely difficult time pinpointing just how rapidly Nvidia’s GPU sales and revenue growth will be – six months ago, in October 2023, analysts’ Q1 revenue estimate was pegged at $18.4 billion, and now, it’s nearly 32% higher. This is reflective of the unprecedented growth materializing for Nvidia over the past year.
ACM Research is expected to see over 105% YoY growth in Q1, with management expecting a strong 2024 on mature node investment in China and product development progress at multiple customers. However, despite the triple-digit headline growth rate, the $152 million revenue estimate would represent an ~(11%) sequential decline.
Micron’s growth is poised to accelerate from 58% YoY to nearly 77% YoY, as it continues to reap the benefits of this unfolding recovery in the memory market with strong pricing tailwinds. Management said that “AI server demand is driving rapid growth in HBM, DDR5 and data center SSDs, which is tightening leading-edge supply availability for DRAM and NAND. This is resulting in a positive ripple effect on pricing across all memory and storage end markets. We expect DRAM and NAND pricing levels to increase further throughout calendar year 2024 and expect record revenue and much improved profitability now in fiscal year 2025.”
Every Thursday at 4:30 pm Eastern, the I/O Fund team holds a webinar for premium members to discuss how to navigate the broad market, as well as various stock entries and exits. We offer trade alerts plus an automated hedging signal. The I/O Fund team is one of the only audited portfolios available to individual investors. Learn more here.Learn more hereLearn more here.
Revenue Growth Estimates for Current Year
Nvidia and Micron lead the sector with estimated revenue growth rates of 82.7% and 58.1% for the current fiscal year.
There should be no surprises here, with Nvidia and Micron leading the way with 82.7% and 58.1% estimated revenue growth for the current fiscal year. Navitas’ strong growth in Q4 and expected growth in Q1 are projected to translate to a solid year with nearly 43% growth, while Rambus is expected to record more than 32% growth.
Data center will be the main driver of Nvidia’s growth this fiscal year, with the H200 shipping at the end of the second quarter and the new B200 Blackwell GPUs commencing late in the year. Put in dollar terms, Nvidia is estimated to generate $50 billion in revenue growth this year – assuming data center drives ~90% of that growth, that could represent more than 1 million additional GPUs shipped this year.
What you may have noticed is that the estimated 83% growth for Nvidia is a far cry from the 237% estimated growth for Q1. It’s not that revenue growth will slow on a dollar basis – Nvidia is estimated to see ~$2 billion in sequential growth each quarter this year, but rather it will start to face tough comps in the back half of the fiscal year, when it comes head-to-head with $14.5 billion and $18.4 billion data center revenue prints. This is what will drag on YoY revenue growth rates, from the 237% to an estimated 40% by fiscal Q4.
We’re seeing thematic similarities in the chip companies making the list of fastest revenue growth expectations for the current fiscal year. Nvidia is capitalizing on data center AI demand and TSMC and Arm are seeing tailwinds from this growth. Micron is seeing rising DRAM and NAND prices aid AI strength, while Rambus and Camtek are both poised to capture growth on this memory upswing. Rambus is seeing the data center drive more than 75% of its chip and silicon IP revenue with outlets in DDR5 and HBM, and Camtek is benefiting from increased metrology equipment demand from HBM and AI chiplet customers.
Despite popular belief, Nvidia is not the most expensive semiconductor stock on a top-line (and even bottom-line) valuation. On a top-line, forward PS valuation, Arm is the most expensive semiconductor stock by a wide margin, trading at 32.4x forward sales despite having a forward revenue growth rate of just 18.7%. We discussed Arm’s extreme valuation and how it poses risks to investors to our free newsletter readers last month in the analysis “Arm Stock: AI Chip Favorite is Overpriced.”
Nvidia trades at 19.8x forward sales and arguably deserves this premium valuation due to its unrivaled position on GPUs and the raw earnings power this is driving; in addition, this 19.8x multiple surprisingly is a slight discount to the 21.7x average PS multiple Nvidia has traded at over the past 5 years.
Semiconductors with the highest exposure levels to the unfolding AI megatrends are predominantly among the sector’s most expensive stocks. For example, Monolithic Power is the fourth most expensive at 15.6x forward sales, while ASML and Marvell also feature on the list. Monolithic has seen strong growth in its Enterprise Data segment as a primary power management supplier for Nvidia’s H100 GPU, though it is also recording >20% growth in automotive and ADAS markets.
Despite some of the blazing growth rates we are seeing emerge across the sector, only a handful of companies with the highest operating margins are seeing growth translate into increased operating leverage.
Due to the sheer pricing power of its H100 GPUs, Nvidia has seen its operating margin rise to nearly 62% in the most recent quarter, compared to a TTM operating margin of under 52%. This suggests that Nvidia will still feel these positive margin tailwinds over the next few quarters, assuming it can maintain a 60%+ quarterly operating margin as it scales its next-generation GPUs.
Smartphone strengths drove improvements in margins for Qualcomm and Cirrus Logic, while strong royalty revenue growth aided in Rambus’ margin improvement. TSMC is facing some margin headwinds, primarily due to its positioning in the ramp cycle of its 3nm node, which is still in the early stages.
Strong free cash flow generation and high FCF margins are a core factor in the chip sector’s attractiveness to investors – not only does strong FCF generation allow companies to reinvest rather heavily in R&D and remain on the leading edge of innovation, but it provides an extra safety net when the macroenvironment sours.
Skyworks led the sector with a 62% free cash flow margin as the company reported record quarterly cash flow metrics. CEO Liam Griffin said the company “continues to execute well and generate robust profitability in light of ongoing macroeconomic volatility” and “delivered record quarterly free cash flow of $753 million, which reflects strong working capital management and moderating capex intensity.”
Taking a broader view of the entire sector, 18 semiconductor stocks reported quarterly FCF margins above 30%, with 9 having a 30% or higher free cash flow margin on a TTM basis. Skyworks reported a 62% FCF margin in Q4, followed by Nvidia at 51% and Cirrus Logic at 49%.
Conclusion
Nvidia has quickly become the market’s most-followed AI stock due to its ‘hockey stick’ data center revenue growth, and it also became the first semiconductor stock to break both $1 trillion and $2 trillion in market cap. However, it’s not the only one putting up strong growth numbers, with Micron expected to see 58% revenue growth this year, and Navitas projected to record over 40% growth.
Strong free cash flow generation has been a hallmark of some of the sector’s top performers. As building blocks for AI and other developing megatrends, semiconductors remain a vital sector to track for tech investors, due to their position at the forefront of AI, strong margins, and strong free cash flow generation.
Please note: The I/O Fund conducts research and draws conclusions for the Fund’s positions. We then share that information with our readers. This is not a guarantee of a stock’s performance. Please consult your personal financial advisor before buying any stock in the companies mentioned in this analysis.
This article was originally published on Forbes on Mar 21, 2024,01:49 pm EDTForbes on Mar 21, 2024,01:49 pm EDT
Arm Holdings is positioned to capitalize on the growing adoption of artificial intelligence (AI) technologies, leveraging its established licensing model and extensive ecosystem to drive future growth. Arm's established licensing model offers a recurring and relatively stable income source, and the stock is seeing favorable price action due to the growing tailwinds from its higher-royalty v9 design supporting next-generation AI chips from Nvidia, Microsoft, Amazon and others.
Yet, despite Arm dominating the smartphone market with 99% share, the company has made very little on licensing compared to its partners. For example, mobile handsets created a $200+ billion segment for Apple, which relies on Arm technology for the iPhone, yet only resulted in (roughly) $3 billion for Arm. In this case, it was far better to own Apple.
The market is excited about the fact that AI will drive double the licensing fees for Arm. My contention is that, similar to mobile, it’s better to own the AI leaders who license Arm’s technology rather than Arm. Analyst estimates have Arm growing to $6.5 billion by 2028. For our purposes, this isn’t high enough growth to ensure insiders, aka SoftBank, won’t take their exit following the IPO lock-up expiration. Frankly, the valuation on Arm is absurdly expensive, at more than double the most-expensive chip stocks, including Nvidia. This is why we’ve stated in the past that Arm makes a better acquisition target. For public investors’ purposes, there is no riskier proposition than an IPO that is richly valued.
Background on Arm
Arm offers the most popular CPU architecture in the world with 250 billion chips shipped since inception, of which 30.6 billion were shipped in FY2023. It’s most dominant in mobile CPUs with 99% market share, and 40.8% in automotive, for an overall share of 48% in Arm’s related markets. This dominant market share is achieved through its developer ecosystem.
For mobile (and how it came to reach 99% share), Arm’s design known as “heterogenous compute” has helped facilitate lower power requirements as the architecture allows different CPU parts to work together for improved efficiency. This enables workloads to work across both high-performance and low-performance CPU cores to lower energy by balancing performance.
Arm’s different licensing models are the following:
Arm Total Access Agreements: It is a type of licensing model wherein the company provides a package of CPU designs and related technologies for an annual fee. The agreement has a fixed term and Arm reserves the right to modify the package by adding or removing specific products.
Arm Flexible Access Agreements: This model provides a selection of CPU designs and related technologies for an annual fee. However, the latest products are not included. In comparison, the total access agreement is a comprehensive package. Another key difference is that the customers need to pay a single-use license fee for specific products if they are included in the final chip design. Like total access agreements, the company reserves the right to modify the package.
Technology Licensing Agreements: It involves licensing a specific CPU design or technology to the customer for a fixed fee. The license can be used for a fixed term or the number of uses.
Architecture License Agreements: Under this agreement the customers design their own customized CPU designs using the Arm’s Instruction Set Architecture (ISA).
Arm’s v9 Architecture
The latest Arm v9 architecture offers significant improvements in performance and efficiency, particularly for artificial intelligence (AI) applications. This has led to increased adoption by its partners, particularly in the premium smartphone segment and with hyperscalers developing their own custom silicon for data center use.
CEO Rene Haas explained that the “premium smartphone is almost exclusively now v9, and virtually every high-end data centre chip is v9. When you look at Grace Hopper, when you look at Graviton, when you look at Microsoft Cobalt, these are all v9-based designs.” However, CFO Jason Child emphasized that Arm is “overweighted towards smartphones on v9, primarily because it’s an annual refresh cycle.”
Compared to the previous v8 architecture, v9 chips command double the royalty rate. This means Arm receives a higher percentage of the chip's selling price when a manufacturer uses v9 designs.
The rapid growth in v9 adoption and its higher royalty rates have already contributed to a significant increase in Arm's royalty revenue. v9 constituted 10% of royalty revenue in the September quarter and accelerated to 15% in the recent quarter. By doing the math, v9 revenue grew 69% QoQ to $70.5 million. As adoption continues to rise, the v9 architecture is expected to be a major driver of future royalty income growth for Arm.
Sign up for I/O Fund's free newsletter with gains of up to 221% – Click hereClick hereClick here
Addressable Market
The company’s total addressable market was $203 billion in 2022 and is expected to grow at a compound annual growth rate (CAGR) of 6.8% to $247 billion in CY2025. The company has maintained a market share of over 99% in the mobile applications processor market. It expects this market to grow at a CAGR of 6.4%, from $29.9 billion in 2022 to about $36 billion in 2025. The company estimates that the aggregate value of chips that contain Arm technology was $98.9 billion (48.9% market share) for the CY ending December 2022, up from 38.7% in 2014. Notably, the 6.8% CAGR is a low CAGR for an AI trend with AI chips expected to grow at a 38.2% CAGR.
Arm also has strong market share of 40.8% in the automotive chip market. Management expects the automotive chip market to grow from $18.8 billion in 2022 to $29.1 billion in 2025, growing at a CAGR of 15.7%.
The cloud compute chip market is expected to grow at a CAGR of 16.6% from $17.9 billion in CY2022 to $28.4 billion in CY2025. Arm’s market share in the cloud computing chip market has increased from 7.2% in CY2020 to 10.1% in CY2022. Since Arm-based chips are increasingly used in data centers, its market share is expected to increase significantly in the future.
Per the prospectus, “Arm-based chips have been gaining market share as CSPs, such as Amazon AWS and Alibaba, have started to deploy Arm products in their own in-house designed chips used in their data centers, and as other CSPs, such as Microsoft and Oracle, start to deploy chips designed by Arm licensees, such as Ampere. As a result, we expect our market share of cloud compute to grow significantly faster than the overall cloud compute market.”
Financials
Arm’s recent Q3 FY2024 revenue ending December grew by 13.8% YoY to $824 million, helped by the recovery in the smartphone market and demand for AI technology. This marks the second consecutive quarter of positive revenue growth, following declines of (2.5%) in the June quarter and (3.7%) in the March quarter, due to the cyclical downturn from smartphones.
License and other revenue grew 18% YoY to $354 million. The company has seen strong growth in license revenue as they are signing long-term and high value agreements with its customers due to demand for Arm’s advanced CPUs to run AI workloads. The trend was strongest in the Sept quarter as license revenue grew by 106%.
CEO Rene Haas said in the earnings call, “And that has seen growth in not only the smartphone sector but also in infrastructure and other markets, which drives growth. We are also seeing strong momentum and tailwinds from all things AI. From the most complex devices on the planet for training and inference, the NVIDIA Grace Hopper 200 to edge devices such as the Gemini Nano Pixel 6 from Google or the Samsung Galaxy S24, more and more AI is running on more end devices, and that's all running on Arm.”strong momentum and tailwinds from all things AI. From the most complex devices on the planet for training and inference, the NVIDIA Grace Hopper 200 to edge devices such as the Gemini Nano Pixel 6 from Google or the Samsung Galaxy S24, more and more AI is running on more end devices, and that's all running on Arm.”
They expect another record quarter for the licensing revenue. CFO Jason Child said Arm is “expecting another strong quarter for licensing with revenue up sequentially to near record levels. As with recent quarters, we expect to sign multiple new ATA deals in Q4, and demand for our latest technology remains high as customers need access to AI-capable CPUs and related technology such as our Compute Subsystems.”we expect to sign multiple new ATA deals in Q4, and demand for our latest technology remains high as customers need access to AI-capable CPUs and related technology such as our Compute Subsystems.”
Arm reported record royalty revenue, thanks to its higher value v9 technology and market share gains in cloud server and automotive markets. Royalty revenue rebounded to 11% YoY growth to $470 million from a decline of (5%) and (8%) in the previous two quarters.
Management’s guide for the next quarter is to grow over 30% YoY, due to a weak comp against the “bottom of the industry wide inventory correction that occurred in prior year Q4.” On a sequential basis, royalty revenue was guided to increase by the mid-single digits.
Source: ARM
CFO Jason Child explained that the “sequential growth is mainly coming from increasing penetration of Arm v9, where royalty rates are on average, at least double the rates on equivalent Arm v8 products. Additionally, we are seeing an increasing amount of Arm technology in chips being deployed and as the amount of Arm technology in chips increases, so does the royalty rate.”increasing penetration of Arm v9, where royalty rates are on average, at least double the rates on equivalent Arm v8 products. Additionally, we are seeing an increasing amount of Arm technology in chips being deployed and as the amount of Arm technology in chips increases, so does the royalty rate.”
Management increased its revenue guidance for the next quarter by $95 million to a range of $850 million to $900 million, representing YoY growth of 38.2% at the midpoint. This strong upward revision was due to the points discussed earlier, including the rebound in royalty revenue and the higher revenue opportunity from AI. Analysts expect revenue to grow 37.4% YoY to $869.88 million in the next quarter and 27.9% in the June quarter.
Source: Seeking Alpha
FY2023 revenue ending March declined by (0.9%) YoY to $2.679 billion. Analysts expect FY2024 revenue to grow 18.7% YoY to $3.18 billion and 23.9% YoY to $3.94 billion for FY2025.
RPO
Remaining performance obligations (RPO) grew by 38% YoY to $2.43 billion, helped primarily by high-value license agreements and renewal of long-term customer agreement. As per the shareholder letter, “We expect to recognize approximately 28% of RPO as revenue over the next 12 months, 26% over the subsequent 13-to-24-month period, and the remainder thereafter.”
Source: ARM
Every Thursday at 4:30 pm Eastern, the I/O Fund team holds a webinar for premium members to discuss how to navigate the broad market, as well as various stock entries and exits. We offer trade alerts plus an automated hedging signal. The I/O Fund team is one of the only audited portfolios available to individual investors. Learn more here.Learn more hereLearn more here.
Margins
Gross margin was 95.6% in the recent quarter compared to 96% in the same quarter last year. Adjusted gross margin improved 50 basis points YoY to 96.8%.
Operating margin was 16.3% compared to 33.7% in the same period last year. The operating margin was lower due to the increase of R&D expenses from an increase in engineering headcount and SG&A expenses from increase of non-engineering headcount.
In the Sept quarter, the operating margin was low at (19.4%) due to increased R&D expenses, stock-based compensation, and IPO-related expenses. SBC was higher than it is expected to be in future quarters as the IPO triggered a one-time expense for previously granted shares. SBC in the September quarter was “$509 million with $19 million in cost of sales, $343 million in R&D and $147 million in SG&A.” The future SBC run rate “will depend on a number of factors, including the share price, but is currently expected to be between $150 million to $200 million per quarter.” At the midpoint, this will be about 20% of revenue.
Adjusted operating margin was 43.8% compared to 39.9% in the same period last year and 47.6% in the Sept quarter.
Source: ARM
Net margin was 10.6% compared to 25.1% in the same period last year and (13.7%) in the Sept quarter. The adjusted net margin was 39.3% compared to 31.1% in the same period last year and 46.9% in the Sept quarter.
Valuation and Risks
Arm’s IPO lock-up period expired on March 12th, so there is risk of volatility in the coming months. Arm is wildly expensive, and it’s this ultra-premium valuation that leads to elevated downside risk for investors, especially now that SoftBank’s IPO lock-up has expired.
Arm was previously listed from 1998 to 2016 when it was taken private by SoftBank Group, and it holds about 90% of the outstanding shares. Arm’s current valuation of $133 billion (90% of that is ~$120 billion) is significantly higher than SoftBank’s current market valuation of $86 billion. The lockup expiration frees up SoftBank’s 90.6% (~930 million shares) stake, allowing SoftBank to lock in gains on Arm after acquiring the company in 2016, should the holding company decide to do so.
Arm’s shares have doubled since its IPO in September 2023, and it is currently trading at a forward P/S ratio of 43x, far higher than AI semiconductor companies that have much higher growth. For as much as Nvidia is being called a ‘bubble’, Arm is trading at more than double its forward P/S multiple of 20x. Meanwhile, AMD and Broadcom, also followed closely for AI potential, are trading in the 11x P/S range, or one-quarter of Arm’s multiple.
Though Arm’s licensing and royalty model allows it to have a superior gross margin profile relative to its GPU customers, it does not have the same hypergrowth profile that will allow it to command such a multiple, let alone expand on such a multiple to provide gains for investors at these levels.
Nvidia is expected to see 81% revenue growth in FY25 (Q1 beginning in February) to more than $110 billion, with similar earnings power, whereas Arm is expected to record just 24% revenue growth to $3.95 billion. Despite tens of billions in revenue growth next year for Nvidia, not to mention other AI chipmakers underpinned by Arm’s designs, Arm is expected to only see $800 million in revenue growth. Even with a beat above the $800 million, this is not nearly enough to support the $60 billion gained in valuation since Arm’s earnings report.
On the bottom line, Arm still trades at a significant premium to peers. Arm is currently trading above a 113x forward PE, more than double AMD’s 50x multiple and triple Nvidia’s 37x multiple. Looking ahead to Arm’s fiscal 2025, Arm is trading at an 86x forward PE with estimated earnings growth of just 27%, compared to 91% for Nvidia.
The rich valuation combined with lockup expiration is the predominant risk, however, the longer-term risk is RISC-V.
Arm is based on lower power instruction sets and hardware, which is also known as a RISC architecture (Reduced Instruction Set Computing). As stated, this contributes to Arm’s approach to power efficiency by reducing the number of instruction sets required. Intel and AMD’s x86 CISC, or Complex Instruction Set Computing, offers more complex instructions that execute multiple operations. This leads to better performance but more power consumption due to the need to decode the complex instructions.
There is a third competitor to Arm and x86 which belongs in the RISC architecture category, called RISC-V. The instruction sets for RISC-V are similar to Arm’s yet RISC-V is open source and is also very new with an official launch in 2019. Compare this to Arm, which was founded forty years ago. RISC-V emphasizes register access over direct memory access, which may be more suitable for parallel processing.
It’s unlikely that RISC-V overtakes Arm in the near-term but it could become a serious contender in future years – some of Arm’s customers support RISC-V, which could limit Arm’s ability to raise prices.
Conclusion
Strong tailwinds for growth exist in Arm’s core markets, notably in AI, automotive and cloud compute chips, while royalty revenue is accelerating on the backs of increased royalties from the v9 design. Despite accelerating key metrics, including revenue, RPO and average contract value, Arm’s valuation poses significant risks, given that it is trading at exuberant levels even relative to the hottest AI chip stocks. In the event the valuation comes down drastically, we’ve done a thorough analysis on Arm as it’s a central player to edge AI and is key to the next phase for AI.
I/O Fund Equity Analyst Damien Robbins contributed to this report.
Please note: The I/O Fund conducts research and draws conclusions for the Fund’s positions. We then share that information with our readers. This is not a guarantee of a stock’s performance. Please consult your personal financial advisor before buying any stock in the companies mentioned in this analysis.
Micron will release its results on March 20th. The company reported 15.7% revenue growth in the last quarter, breaking the string of five quarters of negative growth. Management expects revenue to grow 43.5% YoY to $5.3 billion.
Higher prices and better utilization rates are also expected to improve the company’s margin profile in 2024, along with contribution from higher margin high-bandwidth memory (HBM).
The company will be in focus as HBM3e emerges as a significant enabler of generative AI applications and a significant growth driver over the next few years. Micron has recently started volume production of HBM3e, and more details will likely be revealed during the earnings call.
Revenue
Micron reported 15.7% YoY growth to $4.73 billion in the recent quarter after five quarters of negative growth.
DRAM revenue grew by 24% QoQ to $3.4 billion, primarily helped by increased bit-shipments in the low 20% and improved prices by a low single-digit percentage. DRAM revenue constituted 73% of total revenue.
NAND revenue grew by 2% QoQ to $1.2 billion, primarily helped by 20% price growth.
Revenue guidance for the next quarter is $5.3 billion at the midpoint, representing YoY growth of 43.5%. The company’s CFO, Mark Murphy, said in the earnings call, “Now turning to our outlook for the fiscal second quarter. While we remain mindful of macroeconomic risks, the memory and storage market environment is improving. We expect supply-demand balance to tighten in both DRAM and NAND throughout 2024. Our leading-edge DRAM and NAND nodes are oversubscribed for the full year. Consequently, we expect prices to increase through calendar 2024, driving improvements in our financial performance.”Our leading-edge DRAM and NAND nodes are oversubscribed for the full year.Consequently, we expect prices to increase through calendar 2024, driving improvements in our financial performance.”
The analysts expect revenue to grow 44.6% YoY to $5.34 billion in the next quarter and accelerate to 59.5% in Q3 and 70.6% in Q4.
Margins
Margins have gone through a steep cyclical low and have been showing signs of improvement. The GAAP gross margin was (0.7%) in Q1, compared to 21.9% in the year ago quarter. It marked a 1010 bps QoQ improvement from (10.8%) in Q4. The decline in gross margin compared to the previous year was due to the lower average selling price for DRAM and NAND and $165 million of underutilization costs in Q1.
The sequential rise in gross margin was due to improved prices and higher DRAM revenue mix, and it benefitted from $600 million from the sale of inventory written down in the prior periods. Mgmt expects around $400 million from a similar inventory benefit in the next quarter. The management guide for the next quarter is 12% at the mid-point. The adjusted gross margin was 0.8% compared to 22.9% in the same period last year. The management guide for the next quarter is 13%, helped primarily due to the improvement in prices, lower utilization charges, and the benefit from the sale of inventory.
The operating margin was (23.9%) compared to (5.1%) in the same period last year. The management guide for the next quarter is (8.2%). The adjusted operating margin was (20.2%) compared to (1.6%) in the same period last year. The lower operating margin was due to the factors discussed in the earlier paragraphs, higher R&D expenses, and the reinstatement of certain compensation programs that were suspended in the prior fiscal year. Management expects operating expenses to be lower in the next quarter due to lower R&D expenses and an asset sale previously anticipated in Q1. The management guide for Q2 is (4.9%) and expects to return to positive adjusted operating income in the third quarter.
Due to the various factors discussed above, the company reported EPS of ($1.12) in the recent quarter compared to ($0.18) in the same period last year. The adjusted EPS came at ($0.95) compared to ($0.04) in the same period last year.
The management guide for the GAAP EPS is ($0.45) at the mid-point for Q2 and adjusted EPS of ($0.28) at the mid-point. The analysts expect adjusted EPS of ($0.26) in the next quarter and a return of profitability in Q3 with adjusted EPS of $0.19.
Cash Flow and Balance Sheet
The operating cash flow grew by 48.6% YoY to $1.4 billion. The operating cash flow in Q1 benefitted from $600 million of customer prepayment “to secure supply for leading-edge memory products.” The operating cash flow margin was 29.6% compared to 23.1% in the same period last year. The adjusted free cash flow came in at negative ($333 million) and included capital expenditures of $1.7 billion compared to capital expenditures of $2.5 billion in the same period last year. The adjusted free cash flow margin was (7%) compared to (37.4%) in the same period last year. The company’s CFO said in the earnings call, “We see operating cash flows improving substantially in the second-half of the fiscal year and are now forecasting positive free cash flow in the fiscal fourth quarter.”positive free cash flow in the fiscal fourth quarter.”
The company had cash and investments of $9.8 billion and debt of $13.5 billion in Q1 compared to $10.5 billion and $13.3 billion in Q4. The short-term debt is $908 million and the weighted average maturity of the company’s debt is 2030.
Key Metrics from Business Units
Compute and Networking Business Unit (CNBU) revenue declined by (1%) YoY and is up 45% sequentially to $1.74 billion, as data center and client shipments strengthened in Q1 primarily helped by AI demand and normalized inventory at client customers. We want to see more recovery in compute and networking, as the segment was as high as $3.8B in Q4 of FY2021 and $3.9B in Q3 of FY2022.
The Mobile Business Unit shows signs of recovery, growing by 7% QoQ and by 97% YoY to $1.29 billion. The company’s CFO, Mark Murphy, said in the earnings call, “Mobile revenue continued to show strength as customer inventories normalized and smartphone units and average memory and storage capacity growth at customers drove demand.” We would also like see the recovery continue, as the mobile segment was at $1.89 billion in Q4 of FY2021 and $1.97 billion in Q3 of FY2022.
Embedded Business Unit (EBU) grew by 21% sequentially and by 4% YoY to $1.04 billion helped by growth in most of the end markets.
Storage Business Unit (SBU) revenue declined by (4%) YoY and (12%) sequentially to $653 million due to lower consumer component sales and partially offset by strong growth in SSD revenue.
Other noteworthy points to watch
In the earnings call, CEO Sanjay Mehrotra talked about the AI tailwinds, “We expect 2024 to be a year of recovery and can see the path towards a healthy supply-demand environment along with strong growth in critical new technologies like HBM3E. From the data center to the edge, AI has emerged as a significant secular driver that will further bolster the industry towards record revenue TAM in 2025 and drive growth for years to come. Micron's broad and growing suite of leading-edge products positions us well to capitalize on the immense opportunities ahead.” strong growth in critical new technologies like HBM3E. From the data center to the edge, AI has emerged as a significant secular driver that will further bolster the industry towards record revenue TAM in 2025 and drive growth for years to come. Micron's broad and growing suite of leading-edge products positions us well to capitalize on the immense opportunities ahead.” Any key insights on the 2024 trends are to be watched.
Management comments on HBM3E are to be closely watched in the upcoming earnings. The company’s CEO Sanjay Mehrotra said in the last earnings call. “Micron is addressing these exciting opportunities brought on by the proliferation of AI with an industry-leading portfolio of data center solutions, including HBM3E, D5, several types of high-capacity server memory modules, LPDRAM, and data center SSDs. We have received very positive customer feedback on our HBM3E, which has approximately 10% better performance and about 30% lower power consumption compared to competitive offerings of HBM3E.”We have received very positive customer feedback on our HBM3E, which has approximately 10% better performance and about 30% lower power consumption compared to competitive offerings of HBM3E.”
In fiscal Q1, we shipped samples of HBM3E to a number of key partners and are making good progress in our qualifications. Micron is in the final stages of qualifying our industry-leading HBM3E to be used in NVIDIA's next-generation Grace Hopper GH200 and H200 platforms. In addition, our LP5x is being used for the Grace CPU, driving a new use case for LP memory in the data center for accelerated computing.
We are on track to begin our HBM3E volume production ramp in early calendar 2024 and to generate several hundred millions of dollars of HBM revenue in fiscal 2024. We expect continued HBM revenue growth in 2025, and we continue to expect that our HBM market share will match our overall DRAM bit share some time in calendar 2025.”
The company has confirmed recently that they have begun volume production of HBM3E. TD Cowen Analyst Krish Sankar pointed out that they expect Micron to increase its market share in the HBM market significantly to over 25% in the next year from the current 10-15%.
Margin improvement and management comments on the margins are key items to watch in the earnings call. The company’s CFO answered the analyst’s question on gross margin improvement. “We are seeing some cost declines occurring with the increase of leading node production, and then again with the lower wafer starts and the higher utilization. What we've talked about before, we start to see idle charges dropping, as we've discussed. So again, principally price in the second quarter, but then beginning to see some cost benefits, even though we're losing the benefit of that lower cost inventory.We are seeing some cost declines occurring with the increase of leading node production, and then again with the lower wafer starts and the higher utilization. What we've talked about before, we start to see idle charges dropping, as we've discussed. So again, principally price in the second quarter, but then beginning to see some cost benefits, even though we're losing the benefit of that lower cost inventory.
We will see price appreciation through the year. We're going to — we don't expect there to be volume growth in the third quarter either, but good price appreciation, which will drive gross margins up. And then in the fourth quarter, we would expect to see volume and price, and again some lower utilization charges. So again, we would expect to see margin expansion second quarter to third quarter, and then again third quarter to fourth quarter.”
We will see price appreciation through the year. We're going to — we don't expect there to be volume growth in the third quarter either, but good price appreciation, which will drive gross margins up.And then in the fourth quarter, we would expect to see volume and price, and again some lower utilization charges. So again, we would expect to see margin expansion second quarter to third quarter, and then again third quarter to fourth quarter.”
Conclusion
The company’s Q1 FY2024 results showed that Micron’s recovery is underway. We would like to see this positive trend continue in Q2 with margin expansion in the coming quarters and a commitment to positive free cash flow by the end of the fiscal year 2024.
Edge AI will be an important trend with AI-powered PCs allowing more people to access the full benefit of AI-powered applications. This, in turn, will help AI developers build a bigger ecosystem. There is a bottleneck right now for AI applications to where client devices are not powerful enough or energy efficient enough to leverage AI capabilities. We’ve discussed this previously in our Memory and PC analysis with details on the upcoming Windows 12 upgrade, and also in the Memory and PC stocks write-up
Inference is also pushing forward the need for AI Edge devices and networks to be more powerful, but also more energy efficient. Inference takes batches of real-world data and quickly comes back with an answer or prediction. This is best done at the edge, which includes the edge network that a company like Cloudflare provides, and edge devices, such as smartphones and laptops. In the inference stage, the compute intensive neural networks are modified for speed and to improve latency. In order to do this, inference is optimized for runtime performance. This allows the computation tasks to be as close to the data source as possible. In many cases, data is produced at the edge, and it’s more efficient and faster to run inferencing at the edge. We’ve covered this in the past in our Cloudflare analysis.
Arm-based PCs are sparking competition, and this will be more evident this time next year (Q1 2025). The analysis below expands on the topic of Edge AI devices to discuss what 2024 will bring, and how we want to be positioned for 2025.
x86 versus Arm versus RISC-V
If Arm-based PCs stick this time, it will mark a massive shift in edge devices. X86 dominates PCs as it stands today, yet AI leaders have their roadmaps loaded with Arm-based releases over the next year. This will be Qualcomm in 2024, followed by Nvidia and AMD in 2025.
x86 and x64 Computer and Laptop Processors:
x86 is a set of design instructions and the architecture for nearly every desktop and laptop computer except MacBooks. The x86 architecture has been around for decades and is considered the standard in personal computers and servers due to its high clock speed and ability to execute multiple instructions per clock cycle. When it comes to performance, the x86 architecture is superior with additional features such as hyper-threading and turbo boost, which assists with tasks that require high computational power. In the early 2000s, x64 was built on top of x86 and is the dominant complex architecture.
Arm-Based Architecture:
A few years ago, MacBooks switched from Intel’s x86-64 processors to Apple’s system on a chip (SoC) based on Arm 64 architecture. Arm offers much lower power consumption and generates less heat due to being a Reduced Instruction Set. The M2 is built on Taiwan Semi’s 5nm process with 100GB/s memory bandwidth and 24 GB of unified memory. When the M2 was released in 2022, Apple claimed 1.9X CPU performance at the same power. At the same performance level, Apple claims the M2 uses ¼ the power as x86.
Source: Apple
The M3 MacBook Air is hitting stores this month with Apple stating it’s 13X faster than an x86 Intel powered MacBook. The Arm-based system on a chip (SoC) combines a CPU and a GPU with a 16-core Neural Engine for what Apple is calling the “World’s Best Consumer Laptop for AI.”
To understand why Apple chose to go with Arm-based architecture and why Microsoft Windows has to play catch up in 2024, it’s important to understand what Arm offers.
The name Arm stands for “Acorn RISC Machine” with RISC standing for reduced instruction set computer. Reduced instruction set leads to lower power consumption and less heat. Decades ago, in the early 1980s, founders Sophie Wilson and Steve Furber discovered that a CPU can run faster on a small set of instructions. This means the operating system breaks down tasks rather than add more instructions to the processor. While most CPU designs were adding more instructions to chips, Arm patented the technique of using fewer instructions that run more quickly and efficiently.
CPUs require instruction sets that tell the processor to move data between registers and memory or to perform calculations with a specific execution unit. Architecture is defined by providing the link between instructions and processor hardware designs. Here’s what Arm’s instruction set looks like.
However, a major difference is that Intel maintains its IP in-house and sells chips while Arm licenses its IP. Revenue is generated from licenses for Arm’s technology and royalties that come from the sale of a licensees’ chips that contain Arm’s technology.
Arm Dominates Mobile, and AI May be the Catalyst for Arm to Dominate PCs:
Around 2012, mobile phones began using the 64-bit architecture that PCs had been using for some time. Arm introduced the ARMv8 64-bit architecture for mobile in 2011. This architecture has two execution states to run 32-bit code and 64-bit code. To run on both Arm and Intel architectures, a developer might compile native code for both or run code emulation, although it is more common to choose one and stick with that choice. This is why we see near ubiquity with Arm on mobile whereas Intel and AMD have done quite well in the data center. Due to power constraints of the mobile device, which was introduced much later, Arm found a massive market where it dominates at 99% market share of smartphones.
Today, Arm offers the most popular CPU architecture in the world with 250 billion chips shipped since inception, of which 30.6 billion were shipped in FY2023. As stated, Arm is most dominant in mobile CPUs with 99% market share, and is at 40.8% in automotive. The overall share of Arm’s related markets is 48%. The company’s dominant market share is achieved through its developer ecosystem.
For mobile, Arm’s design known as “heterogenous compute” has helped facilitate lower power requirements as the architecture allows different CPU parts to work together for improved efficiency. This enables workloads to work across both high-performance and low-performance CPU cores to lower energy by balancing performance.
Arm’s architecture is the best choice for mobile and Intel’s x86-64 is the best choice for the data center and PCs. However, we are on the precipice of going through a major shift to where Arm architecture will compete with x86 architecture for PCs. This has been promised many times in the past, yet starting with Qualcomm’s Snapdragon Elite X, there is a chance that a viable Arm-based Windows PC finally happens. To improve the chances an Arm-based PC finally sticks, both AMD and Nvidia are preparing to release Arm-based PC systems in 2025.
Arm’s different licensing models are the following:
Arm Total Access Agreements: It is a type of licensing model wherein the company provides a package of CPU designs and related technologies for an annual fee. The agreement has a fixed term and Arm reserves the right to modify the package by adding or removing specific products.
Arm Flexible Access Agreements: This model provides a selection of CPU designs and related technologies for an annual fee. However, the latest products are not included. In comparison, the total access agreement is a comprehensive package. Another key difference is that the customers need to pay a single-use license fee for specific products if they are included in the final chip design. Like total access agreements, the company reserves the right to modify the package.
Technology Licensing Agreements: It involves licensing a specific CPU design or technology to the customer for a fixed fee. The license can be used for a fixed term or the number of uses.
Architecture License Agreements: Under this agreement the customers design their own customized CPU designs using the Arm’s Instruction Set Architecture (ISA).
RISC-V
For the fiscal year ending March 2023, more than 260 companies have reported shipping Arm-based chips, including Amazon, Alphabet, AMD, Nvidia, Qualcomm, and Samsung.
Arm is based on lower power instruction sets and hardware, which is also known as a RISC architecture or Reduced Instruction Set Computing. As stated, this contributes to Arm’s approach to power efficiency by reducing the number of instruction sets required. Intel and AMD’s x86 CISC, or Complex Instruction Set Computing, offers more complex instructions that execute multiple operations. This leads to better performance but more power consumption due to the need to decode the complex instructions.
There is a third competitor to Arm and x86 which belongs in the RISC architecture category, called RISC-V. The instruction sets for RISC-V are similar to Arm’s yet RISC-V is open source and is also very new with an official launch in 2019. Compare this to Arm, which was founded forty years ago. RISC-V emphasizes register access over direct memory access, which may be more suitable for parallel processing.
It’s unlikely that RISC-V overtakes Arm in the near-term but it could become a serious contender in future years. Companies like SiFive and Imagination Technologies are designing RISC-V processors. Think Silicon released a RISC-V GPU in 2022. As of last year, AMD’s Radeon RX 6700 works with the RISC-V platform from SiFive.
According to Ars Technica, Qualcomm is also starting a joint venture with NXP, Nordic, Bosch and Infineon “aimed at advancing the adoption of RISC-V” with a focus on automotive use cases. With that said, there are not many games that support RISC-V and it has a long way to go to become a true competitor to Arm.
Arm Holdings Financials:
Arm Holdings is positioned to capitalize on the growing adoption of artificial intelligence (AI) technologies, leveraging its established licensing model and extensive ecosystem to drive future growth. Arm's established licensing model offers a recurring and relatively stable income source.
However, despite Arm dominating the smartphone market at 99%, the company has made very little on licensing compared to its partners. For example, mobile handsets created a $200+ billion segment for Apple, which relies on Arm technology for the iPhone, yet only resulted in (roughly) $3 billion for Arm. In this case, it was far better to own Apple.
The market is excited about the fact that AI will drive double the licensing fees for Arm. My contention is that, similar to mobile, it’s better to own the AI leaders who license Arm’s technology rather than Arm. Analyst estimates have Arm growing to $6.5 billion by 2028. For our purposes, this isn’t high enough growth to ensure insiders won’t take their exit following the IPO lock-up expiration – and frankly, the valuation on Arm is absurd at 41.9 Forward PS and 108 Forward PE Ratio. There is no riskier proposition than an IPO that is richly valued.
In the event the valuation comes down drastically (which it likely will, given IPOs tend to selloff sharply in the year following lockup expiration), we’ve done a thorough analysis on Arm as it’s a central player to Edge AI and is key to the next phase for AI.
Armv9 Architecture
The latest Armv9 architecture offers significant improvements in performance and efficiency, particularly for artificial intelligence (AI) applications. This has led to increased adoption by its partners, particularly in the premium smartphone segment.
Compared to the previous Armv8 architecture, Armv9 chips command double the royalty rate. This means Arm receives a higher percentage of the chip's selling price when a manufacturer uses Armv9 designs.
The rapid growth in Armv9 adoption and its higher royalty rates have already contributed to a significant increase in Arm's royalty revenue. Armv9 constituted 10% of royalty revenue in the September quarter and accelerated to 15% in the recent quarter. By doing the math, Armv9 revenue grew 69% QoQ to $70.5 million. As adoption continues to rise, the Armv9 architecture is expected to be a major driver of future royalty income growth for Arm.
Addressable Market
The company’s total addressable market was $203 billion in 2022 and is expected to grow at a compound annual growth rate (CAGR) of 6.8% to $247 billion in CY2025. The company has maintained a market share of over 99% in the mobile applications processor market. It expects this market to grow at a CAGR of 6.4%, from $29.9 billion in 2022 to about $36 billion in 2025. The company estimates that the aggregate value of chips that contain Arm technology was $98.9 billion (48.9% market share) for the CY ending December 2022, up from 38.7% in 2014. Notably, the 6.8% CAGR is a low CAGR for an AI trend with AI chips expected to grow at a 38.2% CAGR.
Arm also has strong market share of 40.8% in the automotive chip market. Management expects the automotive chip market to grow from $18.8 billion in 2022 to $29.1 billion in 2025, growing at a CAGR of 15.7%.
The cloud compute chip market is expected to grow at a CAGR of 16.6% from $17.9 billion in CY2022 to $28.4 billion in CY2025. Arm’s market share in the cloud computing chip market has increased from 7.2% in CY2020 to 10.1% in CY2022. Since Arm-based chips are increasingly used in data centers, its market share is expected to increase significantly in the future. Per the prospectus, “Arm-based chips have been gaining market share as CSPs, such as Amazon AWS and Alibaba, have started to deploy Arm products in their own in-house designed chips used in their data centers, and as other CSPs, such as Microsoft and Oracle, start to deploy chips designed by Arm licensees, such as Ampere. As a result, we expect our market share of cloud compute to grow significantly faster than the overall cloud compute market.”
Financials
Arm’s recent Q3 FY2024 revenue ending December grew by 13.8% YoY to $824 million, helped by the recovery in the smartphone market and demand for AI technology. This marks the second consecutive quarter of positive revenue growth, following declines of (2.5%) in the June quarter and (3.7%) in the March quarter, due to the cyclical downturn from smartphones.
License and other revenue grew 18% YoY to $354 million. The company has seen strong growth in license revenue as they are signing long-term and high value agreements with its customers due to demand for Arm’s advanced CPUs to run AI workloads. The trend was strongest in the Sept quarter as license revenue grew by 106%.
The company’s CEO, Rene Haas, said in the earnings call, “And that has seen growth in not only the smartphone sector but also in infrastructure and other markets, which drives growth. We are also seeing strong momentum and tailwinds from all things AI. From the most complex devices on the planet for training and inference, the NVIDIA Grace Hopper 200 to edge devices such as the Gemini Nano Pixel 6 from Google or the Samsung Galaxy S24, more and more AI is running on more end devices, and that's all running on Arm.”strong momentum and tailwinds from all things AI. From the most complex devices on the planet for training and inference, the NVIDIA Grace Hopper 200 to edge devices such as the Gemini Nano Pixel 6 from Google or the Samsung Galaxy S24, more and more AI is running on more end devices, and that's all running on Arm.”
They expect another record quarter for the licensing revenue. The company’s CFO, Jason Child said in the earnings call. “We are expecting another strong quarter for licensing with revenue up sequentially to near record levels. As with recent quarters, we expect to sign multiple new ATA deals in Q4, and demand for our latest technology remains high as customers need access to AI-capable CPUs and related technology such as our Compute Subsystems.”we expect to sign multiple new ATA deals in Q4, and demand for our latest technology remains high as customers need access to AI-capable CPUs and related technology such as our Compute Subsystems.”
The company also reported record royalty revenue due to its higher value Armv9 technology and also market share gains in cloud server and automotive markets. Royalty revenue rebounded to 11% YoY growth to $470 million from a decline of (5%) and (8%) in the previous two quarters. Management’s guide for the next quarter is to grow over 30% YoY and mid-single digits sequentially.
The company’s CFO, Jason Child said in the earnings call, “Within Q4 total revenue, we expect royalty revenues to grow mid-single digits sequentially and to be up over 30% year-over-year as we compare against the bottom of the industry wide inventory correction that occurred in prior year Q4. Royalty revenue sequential growth is mainly coming from increasing penetration of Armv9, where royalty rates are on average, at least double the rates on equivalent Armv8 products. Additionally, we are seeing an increasing amount of Arm technology in chips being deployed and as the amount of Arm technology in chips increases, so does the royalty rate.”increasing penetration of Armv9, where royalty rates are on average, at least double the rates on equivalent Armv8 products. Additionally, we are seeing an increasing amount of Arm technology in chips being deployed and as the amount of Arm technology in chips increases, so does the royalty rate.”
The management has increased its revenue guidance for the next quarter by $95 million to a range of $850 million to $900 million, representing YoY growth of 38.2% at the midpoint. The strong upward revision was due to the points discussed earlier, like the rebound in royalty revenue and the higher revenue opportunity from AI.
Analysts expect revenue to grow 37.4% YoY to $869.88 million in the next quarter and 27.9% in the June quarter.
FY2023 revenue ending March declined by (0.9%) YoY to $2.679 billion. Analysts expect FY2024 revenue to grow 18.7% YoY to $3.18 billion and 23.9% YoY to $3.94 billion for FY2025.
Annualized Contract Value
Annualized Contract Value (ACV) grew by 15% YoY and by 5% QoQ to $1.16 billion. The sequential increase was due to an increase in high-value license agreements and also the increase of total access agreements.
RPO
Remaining performance obligations (RPO) grew by 38% YoY to $2.43 billion, helped primarily by high-value license agreements and renewal of long-term customer agreement. As per the shareholder letter, “We expect to recognize approximately 28% of RPO as revenue over the next 12 months, 26% over the subsequent 13-to-24-month period, and the remainder thereafter.”
Margins
Gross margin was 95.6% in the recent quarter compared to 96% in the same quarter last year. Adjusted gross margin improved 50 basis points YoY to 96.8%.
Operating margin was 16.3% compared to 33.7% in the same period last year. The operating margin was lower due to the increase of R&D expenses from an increase in engineering headcount and SG&A expenses from increase of non-engineering headcount.
In the Sept quarter, the operating margin was low at (19.4%) due to increased R&D expenses, stock-based compensation, and IPO-related expenses. Stock-based compensation was higher than it’s expected to be in future quarters as the IPO triggered a one-time expense for previously granted shares. As per the September quarter shareholder letter, “Total share-based compensation cost (equity-settled) was $509 million with $19 million in cost of sales, $343 million in R&D and $147 million in SG&A. Share-based compensation costs were higher in Q2 than is expected in future quarters as the IPO triggered a one-time expense for previously granted shares. The future run-rate of share based compensation cost will depend on a number of factors, including the share price, but is currently expected to be between $150 million to $200 million per quarter.” At the midpoint, this will be about 20% of revenue.
Adjusted operating margin was 43.8% compared to 39.9% in the same period last year and 47.6% in the Sept quarter.
Net margin was 10.6% compared to 25.1% in the same period last year and (13.7%) in the Sept quarter. The adjusted net margin was 39.3% compared to 31.1% in the same period last year and 46.9% in the Sept quarter.
Cash Flow and Balance Sheet
The operating cash flow margin was 37.6% compared to 56.8% in the same period last year and 28.2% in the Sept quarter. The free cash flow margin was 30.5% compared to 53.5% in the same period last year and 21% in the Sept quarter.
The company has cash and short-term investments of $2.4 billion compared to $2.2 billion in the Sept quarter, and no debt.
Key Metrics
The company reports the actual chips shipped in the subsequent quarter. For the quarter that ended September, Arm’s customers shipped 7.7 billion chips, down (3%) YoY and up 8% QoQ, showing a sequential improvement for the second consecutive quarter on account of smartphone market recovery and demand for AI chips.
Total Access Licenses
Total Access Licenses grew by 80% YoY to 27, with the company signing five new licenses in the quarter. Notably, this included three companies upgrading from Flexible Access Licenses, marking the first time such a transition had occurred. This also caught the attention of the analyst, who asked“Did that take you by surprise or were these customers that were getting to be particularly large for an AFA and so it was natural for them to upgrade?”
The company’s CEO, Rene Haas replied, “Yeah. Thank you for the question. We didn’t bring it up in our comments. We had a lot of good stuff to talk about this quarter, and I was trying to keep it as concise. But the AFA transition to ATA, thank you for calling that out. That’s a great trend for us. When we designed the program a number of years ago, that was absolutely the intent is that customers that launched into an AFA would ultimately go on to a total access license.When we designed the program a number of years ago, that was absolutely the intent is that customers that launched into an AFA would ultimately go on to a total access license.
What largely drives that, quite frankly, is the company that AFA start to get commercial traction in their business. Some of the AFA customers are early-stage companies. They may have an early exit or get acquired. But as they get larger and mature, we expect them to embrace Arm technology in a broader way. So I wouldn’t call it a surprise. I would actually call it an expected outcome that we have, and we’re really happy to see it. It’s great.”
Flexible Access Licenses
The Flexible Access Licenses grew by 6% YoY to 218. These agreements are renewed annually and over 50 were renewed in the quarter and 14 new agreements were signed with 6 net additions in the quarter.
Risks
The company also highlighted the risk in its prospectus that some of its customers support open-source RISC-V. This may not be a potential immediate risk to the business. However, it might be difficult for Arm to raise prices.
Arm China accounted for about 24% of revenue for the FY ending March 2023. The company said in its prospectus, “Neither we nor SoftBank Group control the operations of Arm China, which operates independently of us.” So, this is a potential political risk to consider if the US-China tensions escalate.
The company’s IPO lock-up period expired on March 12th, so volatility is likely in the coming months. The risk that Arm cannot hold the exuberant valuation it currently trades at post-lockup is very high.
Arm was previously listed from 1998 to 2016 when it was taken private by SoftBank Group, and it holds about 90% of the outstanding shares. The high ownership of SoftBank is a significant risk to consider since SoftBank could slowly start to book profits on Arm Holdings once the IPO lock-up expiry is now over. Arm’s current valuation of $135 billion (90% is $122 billion) is significantly higher than SoftBank’s current market valuation of $85 billion.
Arm’s shares have doubled since its IPO in September 2023. Arm is currently trading at a forward P/S ratio of 41.9. As seen in the chart below, this is trading far higher than the other AI semiconductor companies. The 1-year forward for fiscal year ending in March 2025 is a PS ratio of 33.8, which still exceeds other AI-related semi companies – including Nvidia.
Qualcomm
As we look into Arm-based PCs, it’s worth noting that Qualcomm will be the first to release an Arm-based PC this summer with ETA of June. Qualcomm is a tough stock to own because it’s subject to licensing and IP lawsuits that the company most recently won, and anti-trust lawsuits that the company has lost. China adds complexity, as similar to Samsung and Apple, the OEMs use Qualcomm but ultimately seek to compete with Qualcomm where possible. This leads to IP battles and creates risk not present in other stocks. Interesting enough, Qualcomm is being sued by Arm following the acquisition of Nuvia as Arm alleges the IP deal it had with Nuvia should have been terminated at acquisition. What goes around, comes around.
For the most part, Qualcomm’s customers are frenemies. This is true for all of tech but especially Qualcomm. The tug-o-war between partners/competitors was noted in the most recent earnings call when an analyst asked the following:
“Tal Liani:
Thanks. I have two follow-ups on answers or questions you had before. The first one is Samsung. On one hand, there is a new contract. On the other hand, Samsung is going to use their own more in '24 versus '23. So net-net, are you expecting revenues of Samsung to go up or down in '24 versus '23? What are your expectations of share losses within — can you frame it for us?”
Management didn’t directly answer the question so I’m not going to quote their answer here other than to note the material concern to Qualcomm’s business model. Even as the company innovates on chips, chipsets and SoCs, the older products typically get replaced (where possible).
Qualcomm is not of interest for our portfolio right now as we would want to see more top line growth. Handsets have been in a decline, IoT is in a deep trough, yet automotive is surprisingly strong – which is all detailed below. However, Qualcomm is an important company to cover for AI edge devices and can be instrumental in helping us time our other investments.
From the most recent earnings call, the major takeaways for our purposes are timing for the Windows upgrade, Android’s roll-out for AI features, and China’s ramp in mobile that favors domestic OEMs like Huawei instead of Apple. Most importantly, as stated, the company is working with Microsoft on an Arm-based PC due out mid-2024. Details around this help to inform our thesis on AI-powered PCs, which was detailed here and here.
Brief Overview of the Financials:
In 2023, Qualcomm entered a trough similar to many other semiconductor companies. This was driven by mobile handsets and internet of things (IoT). Qualcomm’s IoT segment includes consumer virtual headsets and edge networking such as WiFi 7 broadband devices. In the most recent quarter, Qualcomm returned to positive growth of 5% after four quarters of negative growth, some as steep as (-24%) and (-23%).
The rebound will be strongest in the second half of CY2024 when Qualcomm returns to growth with an estimated 12.5% in the September quarter. Notably this estimate has come down since the last earnings report, when it was estimated to be 14.3%. The December quarter estimate is for 5.90%.
According to the earnings call, the September quarter will be seasonally stronger due to the anticipated Windows upgrade that is due to be released around the school season.
Here is what was said on the earnings call:
“We're tracking to the launch of products with this chipset tied with the next version of Microsoft Windows that has a lot of the Windows AI capabilities. We're still maintaining the same date, which is driven by Windows, which is mid-2024, getting ready for back-to-school, what we're excited about it is since we announced that Tech Summit showing the performance of the product and the AI capabilities, design traction continues to increase.”
On the bottom line, Qualcomm reported $2.75 non-GAAP EPS, beating estimates for $2.37. The company is returning to growth on the bottom line with the September quarter being the peak at 22% growth for EPS of $2.46. Last quarter, Qualcomm “returned $1.7 billion to stockholders during the quarter, including $784 million in stock repurchases and $895 million in dividends.”
Margins:
Gross margin of 56.6% is in line with previous quarters
Operating margin of 29.5% is higher than previous quarters. Discussion from Q&A is noted below.
Net margin of 28% is higher than previous quarters.
More on Mid-2024 Timing
As mentioned above, the Windows upgrade is expected to hit mid-2024. There were some additional notes on timing:
Tom O'Malley:
Thanks for taking the question. Just passing on my congratulations to Akash as well. I just wanted to ask on the ASP side for Android. You're obviously kind of characterizing the market that's flattish into March, kind of the bottom in June and then improving from there. But you benefited from some good mix in the beginning of the fiscal year here. Could you talk about what you would expect from a mix perspective as you go to the back half? Would you see the same kind of strength on the ASP side that you've kind of seen over the past year? That would be really helpful to understand. Thank you.
Akash Palkhiwala:
Yeah. So if you think about premium flagship launches for our OEMs, a lot of the launches happen in the holiday time frame just before the holidays going into Chinese New Year as well. And so you've seen a lot of those happen. We do have some significant launches through the middle of the year, but obviously, the next big launch goes into the holiday season, starting with Apple and then going into the Android launches. So that's a typical cadence.”
China is a Problem for Apple
We outlined how BYD was becoming a problem for Tesla. According to commentary on Apple’s earnings call and Qualcomm’s earnings call this quarter, China’s preference for domestic OEMs is becoming a problem for the iPhone. In particular, Huawei is making a comeback. Below is mention that Huawei is performing well in the premium tier.
“Samik Chatterjee
[…] So just wondering if you can give us an update in terms of what you’re seeing from those customers? And if at all, Huawei and their reemerges in the market is starting to have an impact in terms of volume or market share for these customers as well in the context of your flat guide for them for quarter-over-quarter? Thank you.
Akash Palkhiwala
In terms of your comment on Huawei, really what we’ve seen since Huawei 5G launch is that the premium tier TAM in China has expanded. And so we’re continuing to see strong demand from our customers post that launch.”
There’s additional evidence that a Chinese OEM is gaining market share as a new customer emerged at 14% of revenue for Qualcomm compared to an estimated 20% from Apple.
“Ross Seymore
Great. And I guess for my follow-up, I noticed in the 10-Q, you had a new 10% customer, I think it was a 14% customer. I don't expect you to name who that is. But is that a reflection of the strong China demand that you talked about in the continuation of good future growth opportunities or was there any onetime aspect of that customer, whoever it may be popping up in the quarter?
Akash Palkhiwala
I think the you framed it in your first theory is a reasonable way of thinking about it.”
Per our write-up on Big Tech earnings, “Apple is facing competition from other smartphone companies in China due to foldable designs and advanced AI features. The company’s total revenue from China in the recent quarter was $20.8 billion, which missed estimates of $23.8 billion.”
Some of Qualcomm’s commentary is useful for if/when we build a position in Apple in anticipation of AI mobile devices. As of now, Apple faces a serious headwind with Huawei and Chinese OEMs. We saw the technicals flashing a few months back in a free analysis here and again here.
Snapdragon AI Platform Roll-Out:
Qualcomm’s Snapdragon 8 Gen 3 mobile platform is helping to bring generative AI to the edge with an AI engine that can run LLMs up to 20 tokens per second. It offers on-device AI such as live translate, interpreter and chat assist. Per management: “This marks the beginning of how gen AI will evolve the overall smartphone experience and highlights the significant opportunity for Snapdragon platforms.”
The Samsung Galaxy S24 Ultra, GalaxS24 and S24 Plus is using the Snapdragon 8 Gen 3 mobile platform. Per management: “The Snapdragon 8 Gen 3 mobile platform is setting a new standard for on-device gen AI experiences for premium smartphones and powers all through flagship Android devices launched and launching this fiscal year.”
In addition, the Snapdragon X Elite will offer on-device gen AI and copilot for the upcoming Windows upgrade. There was a second mention of “mid-2024” for this release.
The Snapdragon X35 will also serve 5G-enabled industrial IoT devices equipped with generative AI, such as enterprise workflow, inventory management and warehouse applications (there are dozens or use cases). According to Qualcomm: “We continue to believe that industrial edge devices with connectivity, high-performance computing and on device AI will become one of our largest addressable opportunities fueled by the secular trends of digital transformation.”
Custom Oryon CPU Cores:
Qualcomm’s Snapdragon AI platform is powered by a new Arm-based CPU called Oryon. This effort began with the acquisition of Nuvia, a company that specializes in custom Arm silicon. This was important for Qualcomm to compete with Apple’s M1 chip, released in 2020 with more iterations since, such as M1 Pro, M1 Max, M2 and M3.
Prior to Nuvia, Qualcomm used Arm designs off-the-shelf with Cortex cores designed by Arm. The Oryon CPU will be the first 64-bit that Qualcomm has designed itself using an architectural license. Legally, only ARM themselves or companies Arm has sold a license to are allowed to design Arm CPUs. When Qualcomm bought Nuvia for its CPU design, Arm is asserting the license is no longer valid and is not transferrable since the company with the license no longer exits.
The importance of this is that Arm architecture on PCs is expected to help Windows PCs compete on performance and power efficiency with MacBooks. It could also spell trouble for Intel. Here are current benchmarks (benchmarks tend to be skewed in favor of one performance measurement rather than overall performance). This is also benchmarked against the M2 whereas the M3 on 3nm technology came out last Fall. According to Apple, the M3 is 15% faster than the M2 with efficiency cores that are 30% faster than what was benchmarked against the upcoming Qualcomm release.
With that said, Oryon is rumored to have power efficiency issues due to Qualcomm using cell phone PMICs. The power management integrated circuits (PMICs) are what manage and regulate the power in electronic components. By using cell phone PMICs, the CPU cores won’t run in the optimal efficiency range. In order to handle the needs of a laptop, Qualcomm is bundling together PMICs. In the very near-term, this means selling more Qualcomm PMICs, but in the medium-term, it means a competitor like AMD or Intel (or Nvidia) could crush Qualcomm on price and performance. The full write-up from SemiAccurate is worth a read. Here is what the independent analyst stated:
“Laptops have a large multiple of the board area of a cell phone, think more than 10x rather than a percentage. So a very expensive cell phone spec board just blew out costs for Oryon laptops. Whoops. Some OEMs SemiAccurate talked to were a tad peeved by this because it is entirely unnecessary, it is mandated solely by the force bundled PMICs. Allowing a suitable PMIC would also allow for a much cheaper PCB too but as you might guess, Qualcomm took a different path.”
Although we will have to wait until 2025 for AMD and Nvidia’s Arm-based laptops, the stage is being set for Qualcomm to stumble and this is something we track for portfolio purposes. To translate, Qualcomm could do well in 2024 given it will be the first to launch Arm-based Windows PCs for AI purposes but whatever lead Qualcomm gains in roughly 6 months time will be harder to maintain in 2025 and beyond as Qualcomm’s exclusive deal expires and more competition arrives.
Qualcomm will release its first smartphone processor with the Oryon CPU in late 2024. The Snapdragon 8 Gen 4 will feature custom CPU cores for the first time since 2016.
Note on Automotive:
The handset segment reported +16% growth and IoT reported (-32%) growth whereas the Automotive segment reported +31% growth.
It’s the smallest segment by revenue size at $598 million compared to handsets at $6.7 billion and IoT at $1.1 billion. However, what’s important to note is that Qualcomm’s automotive segment is growing when other pockets of Automotive are weak on an industry-wide basis.
According to the Auto Investor Day, Qualcomm expects to have “greater than $4 billion in revenue in fiscal '26 and greater than $9 billion in revenue in fiscal '31.”
Here is what was stated on the call:
“And we already have some revenue from ADAS processing. You see a lot of cars for example, in China with both ADAS and autonomy with our processor, you see some of our customers in the United States of our processor. And I think that continues to grow as we get towards our 2026 revenue target, you’re probably going to see very healthy components of all of those elements.”
Regarding the disconnect between Qualcomm’s growth in automotive versus the industry declining, the following was stated:
“Switching over to your second question on automotive. You should really think — the way to think about our automotive business is we're tied to the launch of new cars. Clearly, the industry is going through a transformation, digitization of cars, and we are right at the intersection of that transformation. We are we're benefiting our cars put in more infotainment content for experience within the car. More ADAS content comes into the car as well.
And really, we get to benefit from all those intersection points in the car, and we're increasing the content as new cars launch. So that's the maybe a disconnect between some of our peers what they're seeing and what we're seeing. Stepping back, I mean, clearly, this is an industry that's going through some shorter-term dynamics, so we'll be closely monitoring it. But when you step back, our technology, our position, our products look really good, and we're excited about where we're going.”
Nvidia and AMD could strong ARM Qualcomm
The efficiency shown by the M1 and M2 chips from Apple has resulted in a long battery life and high performance per watt. Apple’s laptops like the M2 Max Macbook Pro can compete with discrete graphics and is better suited for AI processing than laptops with x86 processors. This has led to Apple doubling its market share since the M1, and has caught the attention of Nvidia and AMD. Qualcomm has an exclusive through 2024, which leaves 2025 as the year the world’s top design companies can release an Arm-based PC. According to Reuters, this is exactly what they plan to do.
In addition to Qualcomm’s controversial use of mobile PMICs, which could alter the benefits of an Arm-based PC in terms of power requirements, Nvidia and AMD are more equipped to build advanced AI features into CPUs and devote on-chip resources for AI-enhanced software (need I go further into how Nvidia and AMD will potentially beat Qualcomm on advanced AI features? This one is a tad obvious)
Where the rubber meets the road is that x86 applications have a mature ecosystem and is ubiquitous whereas code for Arm-based Windows is far less supported. If Nvidia and AMD are getting involved, then they must be envisioning the power requirements for AI will be enough of a motivating factor to push forward efforts for Windows Arm-based code.
Conclusion:
We are not interested in Qualcomm or Arm as a portfolio position at this time, rather we are tracking these companies more closely as they will help to bring AI to the edge with Arm-based PCs. This will be timed to an AI-focused release for Windows in mid-2024. There is also quite a bit of excitement around Arm at the moment. For the most part, our firm does not participate in IPOs as the vast majority trade below their opening price after the lockup expires. Arm’s valuation is particularly shocking as it exceeds even Nvidia. We find it advantageous to take our time and buy post-lockup, especially given Arm CPUs dominate 99% of mobile and it’s procured very little revenue compared to mobile heavy hitters in hardware and software. What’s also of interest to our portfolio is that Qualcomm may stumble given the mobile PMICs being used, and in that case, our favorites AMD and Nvidia could have an opening to dominate come 2025.
The overarching theme is that Edge AI is approaching and we want our positions to be aligned as closely as possible given client revenue has been weak for semis across the board. It will be the perfect recipe when client revenue segments return to growth, combined with ongoing data center strength. We want to be positioned when this happens for otherwise strong semiconductor companies that are currently a “tale of two cities” – weak PC and mobile segments detracting from strong data center/AI segments.