Skip to content
Logo-main-white.860316a8

I/O Fund

  • Home
  • Free Stock Analysis
  • AI Stocks
  • BEST OF 2025
  • Analysts
  • Nvidia Hub
  • About
    • Case Studies
    • About Us
    • Premium Services
    • Pricing
    • Notable Wins
    • I/O Fund Reviews
    • Media
  • Contact Us

Category: Consumer Tech

Big Tech Q4 Earnings: Capex Increases

Posted on February 6, 2024June 30, 2026 by io-fund

Below, we look at key Big Tech earnings reports and the major takeaways from Alphabet, Meta and Apple.

Alphabet Q4 results: Cloud accelerates while ad revenue falls short

Alphabet beat top-line and bottom-line estimates. The company’s revenue growth of 13% was the highest growth since Q2 2022. Google Cloud revenue accelerated four points from 22% in the previous quarter to 26% in Q4. However, the company’s ad revenue fell short of estimates as it grew by 11% YoY to $65.5 billion and missed consensus estimates of $65.8 billion. The rise of Capex also led to the stock selling off post-results.

However, the rise of Capex is a notable positive for AI accelerators, which our portfolio is loaded with as the increase in capex will funnel through to GPUs and other AI beneficiaries. Per Alphabet’s earnings call: “In 2024, we expect investment in CapEx will be notably larger than in 2023.”In 2024, we expect investment in CapEx will be notably larger than in 2023.”

Revenue and EPS:

Revenue grew by 13% YoY to $86.31 billion, beating estimates by 1.2%. Analysts expect revenue to grow 13% YoY to $78.58 billion in the March quarter and 11% in the next two quarters.

GAAP EPS came at $1.64 and beat consensus estimates by 2.8%. This is up from $1.05 in the same period last year.

Margins

  • Gross margin improved 300 bps YoY to 56.5% yet was 20 bps lower than the Sept quarter.
  • Operating margin improved 360 bps YoY to 27.5% yet was 30 bps lower than the Sept quarter.
  • Net margin improved 610 bps YoY to 24% yet was 170 bps lower than the Sept quarter.

This year’s December quarter expenses included $1.2 billion in exit charges related to office space optimization, and last year's Dec quarter included $1.2 billion in inventory-related charges.

The CFO reiterated the company’s efforts to reduce costs in the earnings call and this should further help the company to improve its margins. “Turning to margins and expenses. As we have repeatedly stressed, we remain committed to our framework to durably reengineer our cost base as we invest to support our growth priorities. Key contributors to moderating our expense growth include: first, product and process prioritization to ensure we have the right resources behind our most important opportunities and to reallocate resources where we can; second, organizational efficiency and structure. We're focused on removing layers to simplify execution and drive velocity.”

Cash Flows and Balance Sheet

  • Operating cash flow margin was 21.9% compared to 31.1% in the same period last year and 40% in the Sept quarter.
  • Free cash flow margin was 9.2% compared to 21.1% in the same period last year and 29.5% in the Sept quarter.
  • Cash flows were lower mainly due to the deferral of tax payments to the fourth quarter. The CFO said in the earnings call, “We delivered free cash flow of $7.9 billion, which was affected by the timing of the $10.5 billion tax payment we made on October 16 that we called out previously related to the deferral of certain tax payments to the fourth quarter.”
  • Capex also increased 45% YoY to $11 billion in the Dec quarter, which also led to the lower free cash flow.

The CFO said in the earnings call. “With respect to CapEx, our reported CapEx in the fourth quarter was $11 billion, driven overwhelmingly by investment in our technical infrastructure with the largest component for servers followed by data centers. The step-up in CapEx in Q4 reflects our outlook for the extraordinary applications of AI to deliver for users, advertisers, developers, cloud enterprise customers and governments globally and the long-term growth opportunities that offers. In 2024, we expect investment in CapEx will be notably larger than in 2023.”driven overwhelmingly by investment in our technical infrastructure with the largest component for servers followed by data centers. The step-up in CapEx in Q4 reflects our outlook for the extraordinary applications of AI to deliver for users, advertisers, developers, cloud enterprise customers and governments globally and the long-term growth opportunities that offers. In 2024, we expect investment in CapEx will be notably larger than in 2023.”

As stated, comments on capex are good for our semiconductor portfolio mix.

The company has cash and marketable securities of $110.9 billion compared to $119.94 billion in the Sept quarter. Meanwhile, debt was $13.25 billion compared to $13.78 billion in the Sept quarter. The company repurchased $62 billion worth of shares in 2023.

Key Metrics:

Google Cloud Revenue

Google Cloud revenue grew by 26% YoY to $9.2 billion, helped by the increasing contribution from AI. Even though the growth is slower than the 32% growth in the same period last year, it has accelerated from 22% in the previous quarter.

The operating margin for Google Cloud came in at 9% compared to 3% in the previous quarter and negative (0.2%) in the same period last year. The strong growth in the quarter also helped the company to narrow the gap to 4 percentage points with Microsoft Azure’s leading growth of 30% compared to 7 percentage points in the previous quarter.

The CFO said, “The Cloud team is intensely focused on bringing the benefits of Gemini, our industry-leading AI technology, to enterprises and governments globally, and we are gratified with the level of engagement. The strong demand we are seeing for our vertically integrated AI portfolio is creating new opportunities for Google Cloud across every product area.” 

Google Advertising Revenue

Google Advertising revenue grew by 11% YoY to $65.5 billion, compared to 9% growth in the previous quarter and a (-4%) decline in the same period last year. However, they fell short of the consensus estimates of $65.8 billion.

  • Google Search and other advertising revenues grew by 13% YoY to $48 billion. It was up from 11% growth in the previous quarter and a decline of (-2%) in the same period last year.
  • YouTube ads revenues grew by 16% YoY to $9.2 billion. It is up from the 12% growth in the previous quarter and a decline of (-8%) in the same period last year.
  • Network advertising revenues declined by (2%) YoY to $8.3 billion.

Earnings Call

The company’s CEO Sundar Pichai was positive on the launch of Gemini and said in the earnings call, “We closed the year by launching the Gemini era, a new industry-leading series of models that will fuel the next generation of advances. Gemini is the first realization of the vision we had when we formed Google DeepMind, bringing together our two world-class research teams. It's engineered to understand and combine text, images, audio, video and code in a natively multimodal way and it can run on everything from mobile devices to data centers.

Gemini gives us a great foundation. It's already demonstrating state-of-the-art capabilities and it's only going to get better. Gemini Ultra is coming soon. The team is already working on the next versions and bringing it to our products. That starts with Search.”Gemini Ultra is coming soon. The team is already working on the next versions and bringing it to our products. That starts with Search.”

He also mentioned that subscriptions revenue reached $15 billion in annual revenue, up 5x since 2019, helped by strong demand for YouTube Premium and Music, YouTube TV, and Google One. The CFO said, “Subscriptions, Platforms and Devices revenues, which we previously referred to as other revenues, were $10.8 billion, up 23%, primarily reflecting growth in YouTube subscription revenues.”

Conclusion:

While the overall report was good, it is clear that the market expects perfection in key metrics. The slight miss in the advertisement revenues and the rise of capex overshadowed the acceleration in Google Cloud. With that said, for our purposes, the increase in capex commentary is critical to hear for our current portfolio mix, which is overweight AI semis.

Meta Q4: Back to Juggernaut Status

Meta’s Q4 report beat on the top and bottom lines and initiated a $0.50 dividend in a surprise move, The strength of the report is cementing the Facebook parent’s status as a juggernaut of tech once more. Key metrics were very strong across the board, and Q1’s guide pointed to 25% revenue growth at the midpoint, suggesting that 2023’s momentum is continuing into next quarter.

Revenue and EPS:

  • Meta reported revenue of $40.11 billion for Q4, above the higher end of its guide of $36.5-$40.0 billion range and beating estimates for $39.17 billion. Revenue grew 24.7% YoY.
  • For the full year, Meta reported revenue of $134.9 billion, representing YoY growth of 15.7%.
  • Meta guided for $34.5-$37 billion in revenue for Q1, representing YoY growth of 24.8%
  • EPS of $5.33 beat estimates by 7.9%, and represented YoY growth of 203%.
  • For the full year, Meta reported EPS of $14.87, representing YoY growth of 73.1%.

Margins:

  • Gross margin was 80.8% in Q4, a 100 bp QoQ decline but a 670 bp YoY improvement.
  • Operating margin was 40.8% in Q4, a 50bp QoQ and 2090 bp YoY improvement.
  • Net margin was 34.9%, a 100 bp QoQ and 2060 bp YoY improvement.
  • For the full year, gross margin was 80.8%, a 240 bp YoY improvement.
  • For the full year, operating margin was 34.7%, a 990 bp YoY improvement.
  • For the full year, net margin was 29.0%, a 910 bp YoY improvement.

Accelerating ARPU

Although Q1’s guide is for 24.8% growth, triple-digit EPS growth and strong YoY expansion in margins, the highlight of the report lies within acceleration in ARPUs to record levels – ahead of what is expected to be a strong ad market backdrop this year.

Growth in ad impressions cooled, but remained above 20% (versus a fairly tough comp at 23% in the year ago quarter). Ad pricing returned to growth, increasing 2% YoY after seven quarters of declines. We highlighted in mid-January while discussing Meta’s clear leadership in the social media space that “what investors should watch for is if improved ad targeting from AI features can help drive ad pricing back to growth, supported by a favorable spending backdrop and continuing strength in ad impressions globally.” Meta delivered exactly that, though impressions growth decelerated a bit more rapidly QoQ than in Q3.

This recovery and inflection in ad pricing helped drive an acceleration in advertising revenue growth. Overall advertising revenue increased 23.8% YoY to $38.7 billion, a rapid acceleration from the 4.1% growth posted in Q1 when Meta inflected back to growth. US & Canada ad revenue grew 18.5% YoY, while Europe ad revenue growth was the strongest, increasing 32.7% YoY.

Accelerating ARPUs in Facebook’s two core geographies drove this growth – we said two weeks ago that Meta was “on track to potentially reach a record level” for ARPU in Q4, and it did exactly that.

ARPU in US & Canada accelerated to 16% YoY to $68.44, compared to 14% YoY growth in Q3 and a (3%) YoY decline in the year ago quarter. Europe ARPU growth remained steady compared to Q3 at 34% YoY to $23.14, up from 14% YoY in Q2 and a (12%) YoY decline in the year ago quarter. Meta has displayed unbelievable strength in improving monetization in US & Canada, with ARPU rising nearly $20, or 40%, since Q1. 

Q1 will be the next true test for Meta, as it needs to show that it can maintain this strength in ARPU, though it faces a very easy comp with 1% growth in ARPU in the three regions highlighted above. If Meta can report US & Canada ARPU above $60 and Europe ARPU above $20, it will be well on track to proving that it can successfully and meaningfully increase monetization via AI. Q1’s strong guide at nearly $1.9 billion above consensus estimates at midpoint suggests that this is possible.

What also cannot be written off is Meta’s ability to deliver strong operating margin expansion and generate substantial cash flow, while continuing to invest heavily in AI and AR.

In Q4, operating margin expanded over twenty percentage points YoY to 40.8%, the second straight quarter with operating margin above 40% since Q1 and Q2 2021. As a result, FY23 operating margin improved 990 bp YoY to 34.7%. This is helping drive a strong improvement in the bottom line, with Meta reporting a net margin of 34.9%, a second straight quarter above 33% and a strong 2040 bp YoY expansion.

This operating margin expansion comes as Meta continues to pour substantial amounts of cash into Reality Labs. Operating losses for Reality Labs totaled ($16.1) billion for FY23, generating a ~1195 bp headwind to operating margin.

Not only has Meta driven a visible increase in operating margin while meaningfully accelerating revenue over the last four quarters, but it has also driven a massive increase in cash flow.

For FY23, Meta delivered 40.9% YoY growth in operating cash flow to $71.1 billion, as it saw OCF margin expand 940 bp YoY to 52.7%. This is the highest margin among the Magnificent 7. Free cash flow also increased 134% YoY to $43.01 billion, with FCF margin increasing 1610 bp YoY to 31.9%.

Commentary:

Meta guided for a strong Q1, calling for 24.8% YoY growth though it comes against a weak 2.6% YoY comp; however, the ad market backdrop is looking increasingly favorable and supportive of a high-teens growth rate, with current expectations pointing to 16.7% revenue growth for Meta in 2024 to $157.6 billion.

Social media ad spend is expected to remain robust in 2024, with one of the fastest projected growth rates in the ad industry at +13.8% to reach $227.2 billion globally, less than 1% shy of search ad spend.

In the US, growth is expected at a similar rate, with Insider Intelligence projecting 13.5% YoY growth to $82.9 billion for US social network ad spending. This marked a $7.8 billion increase from the Q1 2023 forecast, as Insider Intelligence sees the market benefiting from “higher ad loads, a focus on lower-funnel ads, and an improved advertising economy,” driven by Meta and TikTok.

CEO Mark Zuckerberg said Meta’s year of efficiency in 2023 paid off, with the company returning to strong revenue growth with strong engagement across its apps, while it also “established a world-class AI effort that's going to be the foundation for many of our future products.” By the end of 2024, Meta will have approximately 350,000 H100 GPUs and 250,000 H100 equivalents (perhaps a mix of AMD’s MI300X and/or Meta’s in-house ASICs?), to power its AI ambitions, which span LLMs, in its Llama, Llama 2 and Llama 3, Reels, and other AI features and new products.

Meta is also starting to see more positive contributions from products outside of Facebook, primarily Reels, Meta’s answer to TikTok. Management said Reels “and our discovery engine remain a priority and major driver of engagement,” and “Reels is now contributing to our net revenue across our apps.” Management added that it is seeing “sustained growth in Reels and Video overall as daily watch time across all video types grew over 25% year-over-year in Q4.” Reels can continue to aid growth for Meta in 2024, and while its engagement rate of ~6-9% is slightly below TikTok’s average engagement of 9-11%, Reels is estimated to have higher reach and interactions, which can benefit ad pricing despite the lower engagement rate.

While 2023 was Meta’s year of efficiency, 2024 may shape up to be Meta’s year of leverage. Key metrics support a return to >40% operating margin for the full year and a possible >33% net margin, driven by increasing ad pricing after inflecting back to growth, strong engagement and impressions growth, aided by the release of numerous AI features. Reaching those margins for the full year would imply EPS growth of nearly 38% to $20.50 on $160B in revenue.

AI can help provide increased operating leverage, similar to what we have seen with Microsoft as it boosts growth and creates additional engagement opportunities. Meta is investing heavily in both AI and non-AI hardware and data centers, with its capex guided for $30 to $37 billion in 2024.

Meta said that for “generative AI, we fully rolled out our Meta AI assistant and other AI chat experiences in the U.S. at the end of the year and began testing more than 20 GenAI features across our Family of Apps.” Increasing user engagement via AI features can drive higher ad loads, and thus higher pricing by increased optimization: Meta said that its “approach to optimizing ad levels in our apps has become increasingly sophisticated” as it continues to deliver performance gains for advertiser campaigns.

Note on Meta’s Capex:

The management has guided $30 billion to $37 billion in 2024, an increase of $2 billion at the high range of the prior guide. The guide represents 19.2% YoY growth in capex at the mid-point compared to an actual $28.1 billion in 2023. Since 2023 was a ‘Year of Efficiency,’ the company’s capex was down (12.3%) YoY compared to a growth of 66.5% in 2022.

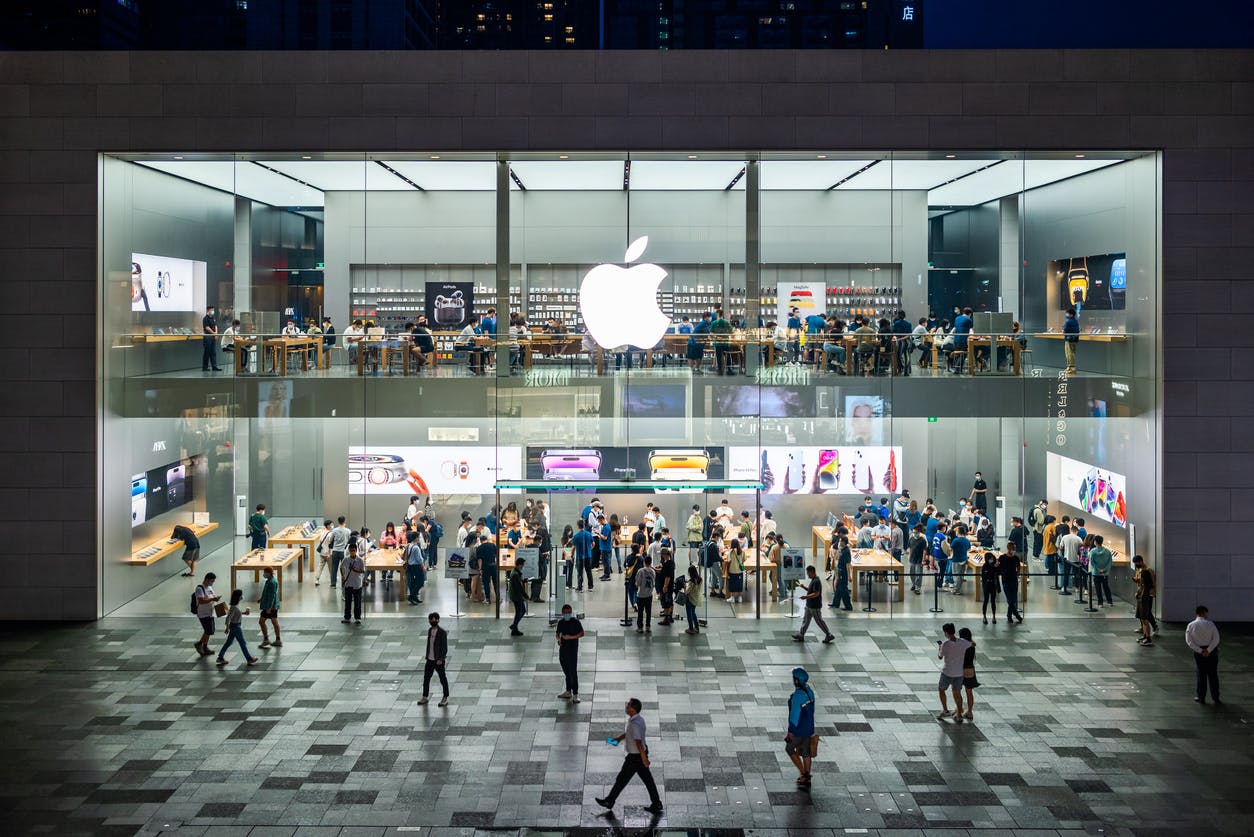
Apple: Strong Q1 FY24 results overshadowed by weak guidance

Apple beat on the top line and bottom line. The profit margins and cash flow margins improved in the Dec quarter. The gross margin guide for the March quarter was also strong. However, management’s revenue outlook for the next quarter implies revenue will decline (5%) YoY and miss consensus estimates by 6%. China revenue of $20.8 billion also missed analyst estimates of $23.8 billion.

Revenue and EPS

Revenue grew by 2.1% YoY to $119.58 billion, beating estimates by 1.1%.

  • iPhone sales accelerated to 6% YoY growth to $69.7 billion, up from 3% in the Sept quarter, partly due to strong demand for the iPhone 15 line-up.
  • Mac Sales rebounded to 1% YoY growth to $7.8 billion from a (34%) decline in the September quarter. We want to watch this line item for a rebound in the broader PC market.
  • iPad sales disappointed as they declined by (25%) YoY to $7 billion. The slide was steeper than the Sept quarter decline of (10%).
  • Wearables, home, and accessories revenue declined by (11%) YoY to $12 billion, from a (3%) decline in the Sept quarter.
  • Services revenue grew by 11% YoY to $23.1 billion. Services remain a long-term opportunity for the company to monetize its installed base of over 2.2 billion active devices. Services revenue grew 16% in the Sept quarter.

GAAP EPS grew by 16% YoY to $2.18, beating estimates by 3.6%.

Margins

Gross margin improved 70 bps sequentially and 290 bps YoY to 45.9%. The management guide for the next quarter is in the range of 46% to 47%.

Operating margin improved 370 bps sequentially and 310 bps YoY to 33.8%.

Net margin improved 270 bps sequentially and 280 bps YoY to 28.4%.

Cash flow and balance sheet

Operating cash flow margin improved 930 bps sequentially and 440 bps YoY to 33.4%. Free cash flow margin improved 970 bps sequentially and 560 bps YoY to 31.4%. Free cash flow also benefitted from lower capex when compared to the same period last year.

The company has cash and marketable securities of $172.6 billion and debt of $108 billion. They repaid $4.0 billion of commercial paper and had net cash of $65 billion compared to net cash of $51 billion in the Sept quarter. Management reiterated its plan to be net cash-neutral over time. The company returned about $27 billion to the shareholders in the recent quarter in the form of dividends and share repurchases.

What to watch in the coming quarters

  • While providing the outlook for the next quarter, the CFO said they expect foreign exchange to be a 2-percentage headwind. The outlook suggests that revenue will decline by (5%) YoY in the March quarter and this missed consensus estimates by 6%. iPhone sales are expected to decline by about (10%) YoY in the March quarter.

The CFO said, “As a reminder, in the December quarter a year ago, we faced significant supply constraints on the iPhone 14 Pro and 14 Pro Max due to COVID-19 factory shutdowns. And in the March quarter a year ago, we were able to replenish channel inventory and fulfill significant pent-up demand from the constraints. We estimate that this impact added close to $5 billion to the March quarter's total revenue last year. When we remove this impact from last year's revenue, we expect both our March quarter total company revenue and iPhone revenue to be similar to a year ago.” We estimate that this impact added close to $5 billion to the March quarter's total revenue last year. When we remove this impact from last year's revenue, we expect both our March quarter total company revenue and iPhone revenue to be similar to a year ago.”

The company is facing competition from other smartphone companies in China due to foldable designs and advanced AI features. The company’s total revenue from China in the recent quarter was $20.8 billion, which missed estimates of $23.8 billion.

  • The performance of the services segment will also be crucial as the company has an installed base of over 2.2 billion active devices and over 1 billion paid subscriptions. The management expects a similar double-digit revenue growth rate in the next quarter to what the company reported in the December quarter: 11% YoY growth.

Management is expected to share more details later this year on how the company plans to capitalize on Artificial Intelligence. Tim Cook said in the earnings call. “That includes artificial intelligence where we continue to spend a tremendous amount of time and effort, and we're excited to share the details of our ongoing work in that space later this year.”

Vision Pro launched and has sold an estimated 200,000 units.

Lastly, the recent changes to the app store to comply with the EU’s Digital Markets Act are to be watched. The impact is limited at the moment since the change is only to Europe. The company will have lower commissions on the app store in Europe, which will now range between 10% to 17% instead of the typical 30%.

The CFO answered an analyst’s question on the call on the impact of the changes. “As Tim said, these are changes that we're going to be implementing in March. A lot will depend on the choices that will be made. Just to keep it in context, the changes applied to the EU market, which represents roughly 7% of our global app store revenue.”

Conclusion

The company's strengths are strong margins, cash flows, a stable balance sheet, and a loyal customer base. Tackling the revenue slowdown in China and capitalizing on its vast installed base is crucial for the company. Keep an eye on the app store commissions as Europe’s move to reduce these commissions will likely serve as inspiration to developers globally to push for the same.

Equity Analysts Damien Robbins and Royston Roche contributed to this article.

Recommended Reading:

  • Special Webinar Replay – February 1, 2024
  • Microsoft Fiscal Q2: Cloud Leads the Way
  • AMD Q4 2023 Earnings: 75% GPU Raise, Separating the Wheat from the Chaff
  • Super Micro Q2 2024 Earnings: The AI Bullet Train
Posted in Consumer, Consumer TechLeave a Comment on Big Tech Q4 Earnings: Capex Increases

Tesla Q4: Moving from Margin Issue to Revenue Growth Issue

Posted on January 30, 2024June 30, 2026 by io-fund

Tesla missed on both the top and bottom line as weak ASP cut into revenues, with the EV manufacturer posting automotive revenue growth of just 1.9% YoY despite a 19.5% YoY increase in deliveries. That statistic is key, as it reflects the idea that Tesla may be moving from a margin issue to a revenue growth issue.

We are starting to see signs of margins stabilizing, with automotive gross margin rising ~85 bp QoQ to 17.2% and operating margin improving 60bp QoQ to 8.2%; however, margins are not in the clear based on recent price cuts and commentary from management regarding cost reductions. This now raises red flags that Tesla will face revenue growth issues moving forward stemming from “notably lower” volume growth and heightened competition from BYD in China and globally. We covered this for our free readers early-on here and here.

Revenue and EPS:

As stated, Tesla missed on the top line and bottom line.

  • Q4 revenue of $25.17 billion missed estimates by 2.3%, representing YoY growth of 3.5%.
  • Q4 non-GAAP EPS of $0.71 missed estimates by 4%, representing a YoY decline of (-40.3%).
  • FY23 revenue of $96.77 billion increased 18.8% YoY from $81.46 billion in FY22.
  • FY23 non-GAAP EPS of $3.12 declined (-23.3%) YoY from $4.07 in FY22.

Margins:

In Q4, average selling prices declined (4.3%) QoQ to $42,579 as price cuts continued; this also represented a (17.9%) YoY decline from an ASP of $51,887 in Q4 2022. This major weakness in pricing is significantly impacting revenue growth and margins.

  • GAAP gross margin was 17.6% in Q4, representing a decline of 612 bp YoY and ~300 bp QoQ.
  • Automotive gross margin (excluding regulatory credits) was 17.9%, a 707 bp YoY decline but improving 86 bp QoQ.
  • Operating margin was 8.2%, a 784 bp YoY decline but improving ~60 bp QoQ.
  • Adjusted EBITDA margin was 15.7%, down 652 bp YoY and ~400 bp QoQ.
  • FY23 GAAP gross margin of 18.2% declined 735 bp YoY from 25.6% in FY22.
  • FY23 operating margin of 9.2% declined 758 bp YoY from 16.8% in FY22.
  • Adjusted EBITDA margin of 17.2% declined 637 bp YoY from 23.6% in FY22.

Cash and Debt:

Operating and free cash flow growth was one of the strongest parts of the report.

  • Cash and equivalents totaled $29.09 billion.
  • Debt and finance leases totaled $5.23 billion.
  • Operating cash flow increased 33% YoY to $4.37 billion in Q4. FY23 operating cash flow of $13.26 billion declined (10%) YoY.
  • Free cash flow increased 45% YoY to $2.06 billion in Q4. FY23 free cash flow of $4.36 billion declined (42%) YoY.

Other Segments:

  • Energy storage deployments were 3,202 MWh in Q4, up 30% YoY. FY23 energy storage deployments rose 125% YoY to 14,724 MWh.
  • Energy storage revenues increased 54% YoY to $6.04 billion, generating gross profit of $1.14 billion. Energy storage now represents more than 6% of revenue, compared to less than 5% in 2022.
  • Solar deployments were 41 MW in Q4, down (59%) YoY. FY23 solar deployments declined (36%) YoY to 223 MW, reflecting global weakness in solar deployments.

Volume Growth Concerns

One of the most telling comments from the Q4 release was Tesla’s call for reduced vehicle volume growth, with CEO Elon Musk saying that the weak growth forecast stems from Tesla gearing up to produce a next-generation model.

Tesla explained that in 2024, its “vehicle volume growth rate may be notably lower than the growth rate achieved in 2023.” Production grew 35% to 1.845 million vehicles while deliveries grew 38% to 1.808 million vehicles.  Calling for a notable slowdown in volume growth raises some substantial red flags as Tesla has recently prioritized volume growth over margins. This is important here as primary rival BYD has surpassed Tesla as the largest BEV market on a quarterly basis and is on track to likely overtake Tesla on an annual basis this year.

CEO Elon Musk emphasized said just in Q2 that “it does make sense to sacrifice margins in favor of making more vehicles because we think in the not too distant future, they will have a dramatic valuation increase.” CFO Vaibhav Taneja reiterated that in Q3, saying Tesla is “focused on reducing costs, maximizing delivery volumes, and continuing making investments in the future.”

What the bull case needs here is irrefutable evidence that this next-generation platform will aid significant growth in vehicle volumes in 2026, as not only is Tesla increasingly at risk of losing its top spot to BYD, but it’s also now opening the door for revenue growth issues.

We do want to reiterate our stance, that this is not a Tesla-specific issue, rather is widespread throughout the automotive sector. We stated this in the July earnings write-up: “While some will talk about recurring software revenue from robotaxis as the most important catalyst, the harsh reality is that the FED lowering rates is the most important catalyst for Tesla today. That may not be as exciting as AI, but Tesla is one of many tech stocks whose revenue growth and profitability is on borrowed time until the Fed instills a more dovish policy.”

What is Tesla-specific is BYD passing the company last quarter, which we made sure to highlight for our readers. This means Tesla is battling both the FED and China, two foes that are known to either stifle innovation by making cash harder to come by or known to undercut innovation in the United States by creating pricing wars.

From Margins to Revenue Growth Issues

Q4’s earnings highlighted the idea that Tesla may be shifting from margin issues to revenue growth issues, especially as vehicle selling prices remain depressed. In Q4, average selling prices declined (4.3%) QoQ to $42,579 as price cuts continued; this also represented a (17.9%) YoY decline from an ASP of $51,887 in Q4 2022. This major weakness in pricing is significantly impacting revenue growth and margins.

Deliveries grew 19.5% YoY to 484,507 vehicles, but the sharp decline in ASP weighed heavily on automotive revenue (excl. reg credits), which came in at 1.2% YoY to $21.13 billion. This was also evident compared to Q2: Q4’s deliveries were nearly 4% higher than Q2’s, but automotive revenues were just 1% higher because ASPs continued to fall.

Revenue Being Revised Lower:

Tesla has already cut prices twice in January, by (3%) to (6%) on the Model 3 and two Model Y variants in China, followed by (4%) to (8%) cuts on Model Y variants across Europe. This raises the risk that revenue growth in Q1 and Q2 will remain in the single-digits, with revenue revisions being pulled lower for both quarters and the full year.

  • Q1’s revenue estimate already has been revised 4% lower following Q4’s miss, from $26.8 billion to $25.7 billion
  • Q2’s revenue estimate has been revised 4.5% lower, from $28.8 billion to $27.5 billion.
  • As a result, FY24’s revenue estimates has been revised 7% lower, from $118 billion to $109.8 billion, pointing to just 13.5% YoY growth, a 5 percentage point slowdown from 2023.

Commentary:

The conference call shed light on how Tesla was able to drive a small improvement in automotive gross margin, but comments from Musk portrayed the difficulty in finding a concrete bottom for margins.

Management explained that Tesla continues “to see improvements in our per unit cost despite us being in the early phase of Cybertruck ramp. As a result, our auto gross margin improved sequentially.” This was evident with the (5.3%) QoQ decline in vehicle production cost to $35,504, which was likely driven by decreasing lithium prices.

While this decline aided margins by offsetting a (4.3%) QoQ decline in ASP, management added that “while the teams are focused on cost reductions, we are approaching the limits within our current platforms.” This suggests that the pace of cost reductions is slowing and may reach a point where it is unable to fall further, meaning that cost reductions may not be enough to offset the price cuts already seen in Q1.

Musk added that if “interest rates come down quickly, I think margins will be good. And if they don't come down quickly, they won't be that good.” Rates are expected to remain above 4% until December, so vehicle affordability may remain pressured from a consumer standpoint and require more price cuts, thus impacting margins.

When discussing competition, Musk did little to assuage concerns that Tesla may fall behind BYD as volume growth slows. Musk said that the “Chinese car companies are the most competitive car companies in the world. So I think they will have significant success outside of China depending on what kind of tariffs or trade barriers are established. Frankly, I think if there are not trade barriers established, they will pretty much demolish most other car companies in the world.”

In 2023, BYD delivered 1.57 million BEVs, up 73% YoY to land about 13% shy of Tesla’s 1.808 million deliveries. Assuming a 20% growth rate for deliveries next year, Tesla would be on track to deliver approximately 2.15 million vehicles, meaning BYD’s growth would only need to be 40% to overtake Tesla next year. Given that BYD is growing tremendously in China, maintaining a growth rate above 40% might not be extremely difficult.

Conclusion

Tesla’s double miss in Q4 came despite a sign of stabilizing margins, with the automaker now opening itself up to revenue growth risks as ASPs are declining nearly as quickly as deliveries are growing. Q4’s automotive revenue rose just 1.9% YoY despite 19.5% YoY growth in deliveries, and high single-digit percentage price cuts in January raise the risk that revenue growth remains weak in Q1 and Q2. Comments about notably lower volume growth in 2024 due to a focus on ramping up a next-generation vehicle platform with a start of production date in late 2025 paves the way for BYD to surpass Tesla’s annual volumes this year.

In light of the weaknesses in Q4, Tesla’s valuation is starting to approach levels where it has previously bottomed: shares are now trading below 5x forward sales, the lowest level since May and approaching January 2023’s bottom at 3.5x.

We will keep watching Tesla’s valuation should shares keep declining. Please follow Knox’s technical analysis and webinars for more details.

Recommended Reading:

  • Q1 Earnings Kickoff Webinar
  • Netflix Q4: Paid Net Adds Impress, Return to Double-Digit Growth
  • 2023 Year in Review: I/O Fund Webinar
  • Micron Q1: The Memory Rebound Has Arrived Fueled by HBM3e
Posted in Consumer Tech, Electric VehiclesLeave a Comment on Tesla Q4: Moving from Margin Issue to Revenue Growth Issue

Tesla Q4 Earnings Preview: Margins Likely To Slip Again

Posted on January 23, 2024June 30, 2026 by io-fund
Tesla Q4 Earnings Preview: Margins Likely To Slip Again

This article was originally published on Forbes on Jan 18, 2024,03:32pm ESTForbes Forbes on Jan 18, 2024,03:32pm EST

Tesla’s Q4 earnings are on tap after the market close on January 24, closing up a year in which aggressive price cuts helped the automaker top Q4 delivery estimates reach a new record and narrowly beat its 1.8 million volume target. Tesla’s continued actions to improve vehicle affordability throughout the year have been detrimental to margins, as average selling price is falling quicker than production costs.

We covered in the past how Tesla’s lower selling prices in China are having a detrimental effect on margins, as well as assessing how low Tesla’s margins could go. We reiterated after Q3 earnings that this continual decline in margins highlights a broader concern for investors in that Tesla has provided no concrete guidance on how far margins will decline.

Tesla kicked off Q4 with price cuts in the US for some Model 3 and Y versions after Q3 deliveries missed expectations, though it raised prices later in October for the Model Y Long Range and X Plaid AWD. Tesla also increased the price of the Model 3 and Y in China in Q4, reportedly due to rising production costs. Given these pricing trends, ASPs look set to remain pressured in Q4 while production costs may decline marginally, a combination likely to cause margins to slip again.

It is imperative for the bull case that operating margins show sequential improvement in Q1 should it fall to the low 7% range in Q4. Assuming a ~10% QoQ increase in operating expenses, about in line with historical trends, Q4’s operating margin is projected to be ~7.2%, for a ~40 bp sequential decline. The analysis below looks at what investors need to know moving into Q4, and equally important, a few red flags we see going into Q1 and Q2 to keep an eye on.

Sign up for I/O Fund's free newsletter with gains of up to 221% – Click hereClick hereClick here

Automotive Margin Remains a Key Item to Watch

While the promise of full autonomy and its potential value entice some investors, the core story remains margins heading into the Q4 release. Notably, margins topped in Q1 2022, and shares have returned (41.0%) since the end of that quarter.

Tesla Price Change

Source: YCharts

Automotive gross margin excluding regulatory credits topped in Q1 at 30.03%, before slumping to 16.33% in Q3 2023. Quarterly operating margin peaked at 19.21%, before falling to 7.6% in Q3 2023. Wall Street continues to search for a bottom in margins, which look set to decline again based on current trends in ASP and production costs per vehicle.

Tesla ASP per Vehicle

Source: Tesla, Author Calculations

Aggressive price cuts pulled ASPs below $45,000 in Q3, a level likely to stay in play as recent price hikes for certain models are unlikely to aid pricing given the pace of cuts throughout 2023. Looking forward to Q4, ASP is projected to decline (1%) to (1.5%) sequentially, impacted by recent price cuts and a slightly higher mix of retail sales in China in the quarter, at just over 35% in Q4 compared to 32% in Q3.

Production costs were reported to have risen slightly in China during the quarter, resulting in a price hike, but Tesla likely enjoyed favorable tailwinds to battery pack cost optimization as lithium prices continued to fall through the quarter. In addition, BloombergNEF estimated lithium-ion battery pack prices declined 14% YoY in 2023 to $139/kWh, with passenger BEV batteries falling to $128/kWh. Based on favorable tailwinds from raw materials prices and headwinds from reports of increased production costs, COGS is estimated to have declined between (0.5%) to (1%) sequentially.

As seen in the scenario analysis below, the incremental effects to gross margin from a 0.5% change in production costs are ~42 bp compared to ~50 bp for a 0.5% change in ASP – therefore, it is critical to margins bottoming that production costs decline faster and/or further than prices, or selling prices begin to increase.

Change in COGS, QoQ

Source: Author Calculations

Our current assumptions point to a slightly larger sequential decline for ASP, an unfavorable combination for margins. For Q4, automotive gross margin is projected at ~15.1%, excluding regulatory credits and operating leasing; including operating leasing, automotive gross margin would project to 15.71%, pointing to a ~60 bp sequential decline from Q3’s 16.33%.

Tesla Automotive Gross Margin

Source: Author Calculations

Every Thursday at 4:30 pm Eastern, the I/O Fund team holds a webinar for premium members to discuss how to navigate the broad market, as well as various stock entries and exits. We offer trade alerts plus an automated hedging signal. The I/O Fund team is one of the only audited portfolios available to individual investors. Learn more here.Learn more hereLearn more here.

Operating Margin May Be Approaching a Bottom

A sequential decline in automotive margin likely spells another sequential decline for operating margins, though there is increasing evidence that operating margins might be approaching a bottom in Q4.

We highlighted in late August via a competitive analysis framework that we believe Tesla’s Q3 operating margins can decline to a level between Honda and VW, or between 7.8% to 9.6%. However, if operating margins were to reach a level closer to — or below GM — that could be sign they’re close to the bottom. This highlights the broader concern for investors in that Tesla has not provided any parameters nor guidance to assess how low margins may go.

Vehicle Company Operating Margins (Quarterly)

Source: YCharts

Q3’s actual operating margin came in below that level, at 7.6%, landing between Honda’s 8.5% and VW’s 6.2%, while still sitting above GM’s 6.8% margin. With automotive gross margin estimated at ~15.7%, company-wide gross margin is expected to hover around 17.5%, assuming a ~180 bp benefit from regulatory credits and positive impact from Energy Storage and Services. Assuming a ~10% QoQ increase in operating expenses, about in line with historical trends, Q4’s operating margin is projected to be ~7.2%, for a ~40 bp sequential decline.

At that level, the spread between Tesla’s operating margin and GM’s would be less than 40 bp, adding evidence that operating margins are approaching a bottom. Aggressive price cuts look to be easing, a tailwind for ASP inflection, while declining lithium and Li-ion battery prices would add production cost reduction, a second tailwind for margins.

It is imperative for the bull case that operating margins show sequential improvement in Q1 should it fall to the low 7% range in Q4. This is crucial for earnings estimates to begin seeing upwards revisions once more, as forward earnings estimates have fallen significantly over the past six months:

  • Q4’s adjusted EPS estimate on June 30 was $0.98 for (17%) growth. This was later revised to $0.86 in mid-October for (28%) growth, and the current estimate sits at $0.74 for (38%) growth.
  • Q1’s adjusted EPS estimate on June 30 was $1.02 for 21% growth. October’s revision saw adjusted EPS at $0.95 for 12% growth, while the current estimate is pegged at $0.81 for (5%) growth.
  • Q2’s adjusted EPS estimate in mid-October was $1.11 for 23% growth, while the current estimate is $0.92 for 1% growth.

Q1’s trajectory, from pointing to over 20% YoY growth to now suggesting a low single-digit YoY decline raises red flags for Q2’s growth forecast, even after a 2100 bp revision lower. Weaker than expected margins in Q4 and/or Q1 could quickly see Q2’s adjusted EPS figure revised lower for another YoY decline. The bull case would need to have concrete evidence of margins bottoming in Q4/Q1 in order to avoid multiple quarters with YoY declines for EPS. Tesla has already cut prices twice in January, by (3%) to (6%) on the Model 3 and two Model Y variants in China, followed by (4%) to (8%) cuts on Model Y variants across Europe. This raises the risk that ASPs fall much further than COGS in Q1, driving a sequential decline in margins and adding more uncertainty to when and where margins will bottom.

Near-Term Focus on Volume Growth

CEO Elon Musk emphasized in Q2 that Tesla is focusing on volume growth at the detriment of margins, based on his view that unlocking full autonomy will lead to a substantial increase in the value of each vehicle and therefore for Tesla: “it does make sense to sacrifice margins in favor of making more vehicles because we think in the not too distant future, they will have a dramatic valuation increase.” CFO Vaibhav Taneja reiterated this in Q3, saying Tesla is “focused on reducing costs, maximizing delivery volumes, and continuing making investments in the future.”

Q4’s production of 494,989 took FY23’s total production to 1.85 million vehicles, while deliveries of 484,507 took the full year’s total to 1.81 million vehicles — this represented delivery growth of 38% YoY and production growth of 35% YoY.

This focus on volume growth via price cuts comes as Tesla is increasingly at risk of losing its title as the world’s largest BEV manufacturer on an annual basis, after losing the title on a quarterly basis this quarter to BYD. BYD has extended its lead against Tesla in China, especially so in Q4, proving that it can’t be ignored as a fierce competitor on the global stage.

BEV sales for BYD increased 22% QoQ in Q4 to reach 526,409 vehicles, almost 9% higher than Tesla’s total. BYD had nearly matched Tesla’s deliveries in Q3 as both held ~18% of the global BEV market that quarter, and BYD’s rapid growth allowed it to take the throne in Q4. Annually, BYD’s BEV sales came in at 1.57 million, +73% YoY, putting it on track to challenge Tesla’s annual volumes in 2024.

Tesla Technical Analysis

Many of the FAANGs are in the final throes of very mature long-term, uptrend patterns, some of which started in 2009. Many FAANGs are either at all-time highs, or just shy of them; however, Tesla trades roughly 50% lower than its 2021 highs, which signals relative weakness compared to other FAANGs.

Tesla Technical Chart

Source: TradingView

It’s worth noting the head and shoulders pattern that is close to confirming. This is the red count above, which implies that if Tesla breaks below $203, then the lower target will be sub-$100, as we likely press below the January 2023 lows.

If Tesla is going to have any chance at a sharp uptrend, it would need to break above $264 and $280 in a vertical manner. If this happens, we can start discussing the possibility of $345 – $400. This is the green count in the chart, and it has a low probability of manifesting.

The problem with this scenario is that no FAANG supports this type of move. This would be a 60% – 80% move higher in Tesla. Most FAANGs look like they have topped or have one more minor swing higher before topping.

Even the strongest FAANGs are suggesting a final push higher that doesn’t fit with the above green count. META, being one of the stronger FAANGs, only has room for a 4% – 10% move higher before completing a mature 5 wave pattern off the January low completes. NVDA, being the strongest FAANG, only has room for a 5% – 18% move, at most, before it becomes a better buy at lower levels. Therefore, neither the fundamentals, nor the technicals support this type of large move higher in Tesla, which makes the red count more likely at this time.

Conclusion

The main story for Tesla through 2023 and now entering 2024 has been when and where margins will find a bottom. Margins have declined significantly as Tesla prioritized growing delivery volumes via aggressive price cuts – automotive gross margin has fallen nearly 1400 bps in six quarters, while operating margin has pulled back to the mid-7% range. The two are both projected to slip again in Q4 as price cuts are expected to offset any incremental margin benefits from lowering vehicle production costs.

This rather rapid decline in margins is having a direct impact on forward earnings estimates, with Tesla now expected to report a single-digit YoY decline in fiscal Q1 and almost zero growth in fiscal Q2, compared to prior views for >20% YoY growth. Operating margins are nearing a level where we believe it will find a bottom, while more constructive pricing action through the rest of 2024 and/or continued improvements in lowering production costs will also help aid margin recovery.

If you own Tesla stock, or are looking to own Tesla, we encourage you to attend our weekly premium webinars, held every Thursday at 4:30 pm EST for premium members to discuss how to navigate the broad market, as well as various stock entries and exits. We offer trade alerts plus an automated hedging signal. The I/O Fund team is one of the only audited portfolios available to individual investors. Learn more here.

I/O Fund Equity Analyst Damien Robbins contributed to this analysis.

Please note: The I/O Fund conducts research and draws conclusions for the Fund’s positions. We then share that information with our readers. This is not a guarantee of a stock’s performance. Please consult your personal financial advisor before buying any stock in the companies mentioned in this analysis.

Recommended Reading:

  • Tesla’s China Market Share Continues To Slide
  • Social Media Stocks: One Metric Shows Meta’s Clear Leadership
  • Palantir, Three Other Cloud Stocks Poised For An Acceleration In 2024
  • Ad Spending Growth to Accelerate In 2024
Posted in Autonomous Vehicles, Consumer Tech, Electric VehiclesLeave a Comment on Tesla Q4 Earnings Preview: Margins Likely To Slip Again

Tesla’s China Market Share Continues To Slide

Posted on December 12, 2023June 30, 2026 by io-fund
Tesla’s China Market Share Continues To Slide

This article was originally published on Forbes on Dec 7, 2023,10:58pm ESTForbes Forbes on Dec 7, 2023,10:58pm EST

Tesla’s China struggles are persisting, as the American OEM saw its monthly sales decline substantially year-over-year in November, continuing a string of weak growth that began in August.

Tesla’s primary China rival BYD continues to see solid vehicle sales growth, and is poised to potentially become the market share leader in Q4. In an analysis last month “Tesla Sells 33% of Vehicles Below Average Cost, BYD Pulls Ahead,” our firm had reported that BYD more than doubled Tesla’s China sales in October and that BYD “is set to overtake Tesla in terms of quarterly BEV deliveries.”

Sign up for I/O Fund's free newsletter with gains of up to 221% – Click hereClick hereClick here

Tesla Falls Further in China

In November, Tesla’s China-made EV sales fell about (-17.8%) YoY to 82,432 vehicles, marking the largest YoY drop since December 2022 when Tesla cut output and prices in response to rising inventories.

Vehicle sales did increase approximately 14.3% MoM from October, a positive sign of improvement from the stagnation seen since the peak in June at 93,680 vehicles. Despite the 14.3% MoM growth, Tesla is still tracking at less than half the BEVs as BYD and will need much more than one month to maintain its lead globally.

China EV Sales, BYD vs Tesla

Source: TESLA, BYD, GASGOO

November and December are typically the strongest seasonal months for China’s EV market, a common theme seen in other auto manufacturers’ deliveries for last month. December has also tended to be the strongest month for Tesla — aside from in 2022 — so the true test for Tesla will be exceeding June’s total as December has traditionally done in the past. That would represent MoM growth of ~13.6% and YoY growth of ~67.9%, a reversal back to double-digit growth after a 4-month string of weakness.

In 2021, Tesla saw similar weakness in October and November that then set up for a strong December. 2023 could follow that pattern with a strong December boosted by the refreshed Model Y and Model 3 Highland – Tesla will need to show at least 95,000 units in volume in December (or a minimum of 50% of BYD’s BEV volume) for the bullish thesis but if it misses under 90,000 then China continues to be too big to ignore, and we will look for an opportunity to buy lower. We are on the sidelines until then.

China Sales YoY Growth, BYD vs Tesla

Source: TESLA, BYD, GASGOO

I/O Fund Equity Analyst Damien Robbins previously reported last month that Gigafactory Shanghai “is essentially maxed out in terms of the volume of vehicles that it can churn out, so October’s stagnation raises more questions about how Tesla will regain market share in China. With BYD’s strong growth in Q3 and Tesla’s slide in September, the American EV maker saw its NEV market share fall more than 300 bp QoQ from 12.98% in Q2 to 9.89% in Q3.”

October’s stagnation saw Tesla’s market share deteriorate further: Reuters reports that Tesla’s “share of the country's EV market dropped to 5.78% in October from 8.7% in September.” That marks a swift decline in market share – down 1220 bp from Q2’s 12.98% in just over a quarter.

Tesla’s market share is sliding as Tesla’s deliveries are lagging and rival deliveries are growing; Tesla’s October sales grew 1% YoY compared to 30.1% YoY for the passenger EV market. For November, EV sales are estimated to increase 29% YoY to approximately 940,000, per the China Passenger Car Association. A CPCA official said that “every carmaker is making a dash to the year-end as they try to meet their sales targets.” In November, Tesla’s below-market growth rate of (-17.8%) YoY compared to 29%, is looking to set the carmaker up for further market share losses as Chinese domestic rivals’ deliveries continued to witness strong growth:

  • BYD’s NEV sales reached a record and second straight month above 300,000, with BEV sales rising 49% YoY to 170,150.
  • Great Wall’s NEV sales rose for an eighth consecutive month, rising 143% YoY to 31,824 vehicles.
  • Changan’s NEV sales increased nearly 53% YoY to 50,598.
  • GAC’s NEV sales grew 49% YoY to 50,231 for the month and 80% YoY to 490,925 YTD.

Every Thursday at 4:30 pm Eastern, the I/O Fund team holds a webinar for premium members to discuss how to navigate the broad market, as well as various stock entries and exits. We offer trade alerts plus an automated hedging signal. The I/O Fund team is one of the only audited portfolios available to individual investors. Learn more here.Learn more hereLearn more here.

BYD Matches Tesla’s BEV Market Share

Due to China’s large population and the importance of this country in terms of demand, BYD is set to surpass Tesla on global sales next quarter.

BYD’s EV growth flatlined in November on a MoM basis, with growth just below 1% from October’s levels. However, November’s tally of 301,378 vehicles (BEV+PHEV) marked a second straight month with more than 300,000 deliveries. For a direct comparison to Tesla, BEV sales increased 49% YoY and nearly 3% MoM to 170,150 units, taking Q4’s to-date total up to 335,655 vehicles. As a result, BYD is poised to overtake Tesla’s BEV sales in Q4 – BYD is on track to surpass 500,000 BEVs delivered, whereas Tesla is forecasting a volume of at least 449,000 vehicles in Q4 to reach its 1.8 million target for 2023.

BEV Market Shares, Q3

Source: TRENDFORCE

With BYD’s strong growth through Q2 and Q3, combined with a strong start to Q4, it’s also on track to soon become the top brand globally in terms of BEV market share, taking the throne away from Tesla. On a YTD basis up to Q3, Tesla held approximately 20.1% share of the BEV market, compared to BYD’s 15.9% share; however, in Q3, BYD matched Tesla’s market share at ~18%, per TrendForce data.

The team at the I/O Fund strives to be early and objective, highlighting last month for our readers that Tesla was set to lose market share to BYD as China growth stagnates. Read that analysis here.I/O Fund strives to be early and objective, highlighting last month for our readers that Tesla was set to lose market share to BYD as China growth stagnates. Read that analysis here.

For Q4, BYD is set to surpass Tesla’s delivery tally by 10% or more, based on current growth rates and seasonal strength. Some of China’s major EV brands, including BYD and Li Auto among others, “have either cut prices or increased the royalties for customers since late November to boost year-end sales,” which could help BYD further extend such a lead.

Conclusion

The main story for Tesla investors remains the margin picture, and when margins will bottom as automotive and gross margin continues to deteriorate. We outlined this in detail here: “Tesla’s Margins: How Low will They Go?”

Tesla is heading towards a weaker position in China than what mainstream media is currently reporting as vehicle deliveries in the back half of the year have been relatively weak, allowing main rival BYD to catch up rather quickly, to the point where it may overtake the top spot in terms of market share. If not in Q4, then it looks to be inevitable come 2024.

China is a core market for Tesla for production, deliveries and exports, with Gigafactory Shanghai accounting for ~52.1% of Tesla’s 1.32 million total deliveries through Q3. Though Tesla has been raising Model Y prices over the past month, this slippage in market share raises concerns that margins will continue to suffer through Q4 and into 2024.

I/O Fund Equity Analyst Damien Robbins contributed to this analysis

Please note: The I/O Fund conducts research and draws conclusions for the Fund’s positions. We then share that information with our readers. This is not a guarantee of a stock’s performance. Please consult your personal financial advisor before buying any stock in the companies mentioned in this analysis.

Recommended Reading:

  • Tesla Stock: What You Need To Know About Q1 Earnings
  • Tesla Sells 33% Of Vehicles Below Average Cost, BYD Pulls Ahead
  • Tesla’s Margins: How Low Will They Go?
  • Tesla Q2 Earnings – It’s About Margins
Posted in China Stocks, Consumer Tech, Electric VehiclesLeave a Comment on Tesla’s China Market Share Continues To Slide

Apple’s Services Growth Flywheel Continues To Strengthen

Posted on November 21, 2023June 30, 2026 by io-fund
Apple’s Services Growth Flywheel Continues To Strengthen

This article was originally published on Forbes on Nov 16, 2023,05:19pm ESTForbes Forbes on Nov 16, 2023,05:19pm EST

Apple’s Services segment was one of the brightest spots in a relatively in-line earnings report at the beginning of November, topping an $85 billion run rate as growth jumped back to the high double-digits after a string of single-digit growth. Services demonstrated that its growth flywheel continues to strengthen with multiple outlets of opportunity in sight — from AI, to further growth in the installed base, to price hikes across different Services bundles.

Services Growth Outpaces iPhone, Apple

Since fiscal 2018, Services has become increasingly important to both the top and bottom lines for Apple. The segment has seen its share of revenue rise from under 15% five years ago to 22.2% at the end of September. Since then, Services has seen its annual run rate increase from ~$40 billion to over $85 billion, on track to surpass a $100 billion run rate potentially as early as the second half FY24.

FY21 was a breakout year for Services – the segment recorded greater than 24% YoY growth and generated more than $10 billion in gross profit each quarter, as its gross margin neared 70%. Gross margin has continued to stay above the 70% range, rising as high as 72.6% in Q2 FY22.

Apple Services Revenue & Gross Profit

Source: I/O Fund

FY23 ending in September saw a full year growth rate of 7.1% YoY for $85.2 billion outpacing both iPhone and company-wide growth, with Q4 being the strongest quarter of the fiscal year with a growth rate of 16.3% YoY. The I/O Fund recently covered Apple’s earnings report more in-depth following fiscal Q4 here.

Since FY18, Apple has grown revenue at a 7.6% CAGR, meanwhile, Apple’s company-wide gross profit has grown at a 10.1% CAGR over the same period with profits partly impacted by Services’ rising contribution and expanding margin.

Compared to Apple, Services is seeing revenue and gross profit grow at much quicker rates – more than 9 percentage points higher for both metrics. Since FY18, Services revenue has grown at a 16.5% CAGR, outpacing Apple’s 7.6% growth rate as well as the iPhone’s 4.0% CAGR, due to the unevenness in revenue in between upgrade cycles – iPhone delivered YoY revenue declines in FY19, FY20, and FY23.

Services’ gross profit has expanded at a 20.1% CAGR, rising around 150% since FY18, from $24.2 billion to $60.3 billion as gross margin has expanded 10 percentage points, from 60.8% to 70.8%. This strong revenue and gross profit growth over the past five years has seen Services gain importance to Apple’s margins and its bottom line.

Services Segment Contribution to Gross Profit

Source: Apple

In FY18, Services contributed 23.7% of Apple’s gross profit, whereas today, Services contributes 36% of gross profit.

The breakdown looks like this:

As Services’ share of revenue rose from 15% to 22.2%, it helped pull Apple’s gross margin ~580 bp higher in just five years. Product gross margin – iPhone, Mac, iPad, etc. – increased just 210 bp, meaning this expansion in gross margin is primarily coming from Services.

FY21 was a breakout year for Apple’s gross margin, expanding from 38% to more than 42% because of that growth in Services. Apple is guiding for gross margin to expand further in fiscal Q1 next year, to the 45% to 46% range – an expansion of 200 to 300 bp YoY, with Services’ growth rate forecast to be in the high-teens again.

Sign up for I/O Fund's free newsletter with gains of up to 221% – Click hereClick hereClick here

Services Seeing Multiple Growth Outlets

Services growth has been broad based, with new revenue records across a range of different offerings, and the segment has multiple growth outlets to lever in the future, from growth in paid subscribers, AI, and price hikes.

CEO Tim Cook explained on Apple’s Q4 earnings call that the Services segment “achieved all-time revenue records across App Store, advertising, AppleCare, iCloud, payment services, and video, as well as the September quarter revenue record in Apple Music.” CFO Luca Maestri added that Services “reached all-time revenue records in the Americas, Europe and rest of Asia-Pacific and a September quarter record in Greater China.”

What is driving these record levels across multiple Services offerings and in every geography worldwide is solid growth in active devices and strong growth in paid subscriptions. Paid subscriptions have risen at more than 27% annually over the past five years to 1 billion by the end of FY23.

Apple Paid Subscriptions (M)

Source: APPLE

Apple has surpassed 2 billion installed devices, and “continues to grow at a nice pace and establishes a solid foundation for the future expansion of the ecosystem.” Thus, the organic growth flywheel for Services remains soundly intact – growth in installed devices driving growth in paid and transacting accounts at a higher degree.

At the start of FY18, Apple reported that it had an installed active device base of 1.3 billion devices, meaning it had a ratio of about 0.18 paid subscriptions per 1 active device. Since then, installed devices have grown more than +50% to over 2 billion, while paid subscriptions have grown nearly +360% to almost 1.1 billion, or a ratio of about 0.5 paid subscriptions per active device.

Reaching new all-time highs in its installed device base signals further growth lies ahead for Services, especially as the ratio of paid subscriptions per active device continues to rise. Other outlets of growth arise from Apple’s recent price hikes and potential monetization opportunities from AI.

Additional Levers

Apple recently enacted some price hikes for News+, Arcade, and its One bundles, with the hikes ranging from $2/mo to $5/mo. As a whole, the price hikes could generate an additional ~$5 billion in annual revenue with just a 15% attach rate to Apple’s more than 1 billion paid subscriptions — however, the price hikes could incur a small amount of churn, among more price-sensitive consumers.

In terms of AI, Apple is not releasing any details about projects in development, though it is rumored that some of the AI products Apple is working on would improve Siri and Messages’ capabilities, or add features to Keynote, Pages, and Apple Music. Apple’s large language model ‘Apple GPT’ is reportedly under development, but a commercialization route is still undetermined. The next-generation of Apple’s software, iOS 18, macOS 15, and watchOS 11, are poised to bring AI features to Apple’s devices next year, as it works to catch up in the generative AI deployment race against OpenAI and Google.

For any of its AI products, there are three routes that could boost Services revenue – adding AI features for free in an aim to boost engagement across offerings, charging a subscription fee for AI features, or increasing prices of current bundles that incorporate AI. For example, if Apple charged for a stand-alone AI subscription at a $2.99/mo price point, it could rake in ~$10.8 billion in annual revenue at a 15% attach rate to its more than 2 billion active devices; boosting the prices of all of its subscription bundles by $0.99/mo could also add more than $10 billion annually.

In a previous Forbes article “AI Could Be Apple’s Next Chapter,” my firm pointed out that: “although Apple is tight-lipped about the progress of its AI projects, the so-called Apple GPT chatbot is rumored to be more powerful than Open AI’s GPT 3.5 model, according to The Verge. Apple is spending millions of dollars a day training the large language model Ajax on more than 200 billion parameters.”

Every Thursday at 4:30 pm Eastern, the I/O Fund team holds a webinar for premium members to discuss how to navigate the broad market, as well as various stock entries and exits. We offer trade alerts plus an automated hedging signal. The I/O Fund team is one of the only audited portfolios available to individual investors. Learn more here.Learn more hereLearn more here.

iPhone Demand Uncertain, China Risks Remain

Analysts have expressed concern over the holiday launch trajectory of Apple’s new iPhone 15, hinting that supply shortages, lower levels of consumer spending, and shorter wait times suggest weaker demand. The iPhone remains Apple's main source of revenue, and a conservative fiscal Q1 guide from the company along with heightened concerns over iPhone 15 demand add to risks that iPhone revenue growth in the near-term will remain depressed, after growing just +2.6% YoY in Q4.

Other concerns arise from Apple’s concentration in China, in regard to its iPhone supply base. Bank of America warned that Apple’s iPhone “supplier base remains largely in China,” which could “create many headwinds including around production, demand, [and] competition,” given that it is “hard to move all elements out of China.”

Services remains strong and a segment to watch, but we need the iPhone to participate and come in strong too, with a lingering risk to watch around China. Without the iPhone participating, Services is not enough to carry Apple’s stock alone, especially given its current valuation trading at levels hard to sustain.

Apple PS Ratio

Source: YCHARTS

Apple is currently trading at a 7.76x P/S ratio, above its 5-year median P/S ratio of 6.59x, with the 8.0x a level that Apple has struggled to hold on to since spiking to it in 2020. Apple is also trading at a nearly 28.8x forward P/E ratio, again another valuation level that it has struggled to hold on to – since late 2021, Apple has generally pulled back to below 24x forward P/E after trading above the 28 range.

Apple PE Ratio

Source: YCHARTS

However, another risk to watch is Alphabet’s antitrust trial, as it could have direct implications for Apple in the event of a negative ruling. Alphabet’s multi-billion dollar payments to Apple for Google to be the primary search engine on Safari across Apple’s devices is at the center of the trial, and that payment is rumored to be ~$19 billion this year – a key witness mentioned during the trial that Google is paying Apple 36% of search advertising revenue it generates via Safari. Should the scale of those payments constitute monopolization of the search market, Apple could be set to lose on a lucrative Services revenue stream.

Conclusion

Services is rapidly becoming one of Apple’s most important top-line segments, and arguably is the most important for Apple’s bottom-line, given its outsized role in boosting Apple’s gross margin. Organic growth has been a strong driver of Services’ +16.5% 5-year revenue CAGR and its +20.1% 5-year gross profit CAGR, both of which outpace Apple’s growth rates by more than 9 percentage points.

Should Services continue to grow in the teens for the next five years, such as at a 14% 5-year CAGR through FY28, it would be generating approximately $164 billion in revenue, or slightly more than 30% of Apple’s projected $538.6 billion in revenue. Price hikes, introduction of AI features, or finding ways to increase engagement and boost the ratio of paid subscriptions per active device all support this long-term revenue growth outlook for the segment.

Damien Robbins, Equity Analyst at the I/O Fund, contributed to this article.

The I/O Fund was early to AI with a 45% allocation in 2023. For more in-depth research from Beth, including 15-page+ deep dives on the 10 stock positions the I/O Fund owns, subscribe here.

Please note: The I/O Fund conducts research and draws conclusions for the Fund’s positions. We then share that information with our readers. This is not a guarantee of a stock’s performance. Please consult your personal financial advisor before buying any stock in the companies mentioned in this analysis.

Recommended Reading:

  • AI Could Be Apple’s Next Chapter
  • Tesla Sells 33% Of Vehicles Below Average Cost, BYD Pulls Ahead
  • Solar Stocks Still Searching For A Bottom
  • Big Tech Stocks: Q3 Earnings Preview
Posted in Consumer Tech, Ctv, Media, Mobile, SvodLeave a Comment on Apple’s Services Growth Flywheel Continues To Strengthen

Tesla Sells 33% Of Vehicles Below Average Cost, BYD Pulls Ahead

Posted on November 14, 2023June 30, 2026 by io-fund
Tesla Sells 33% Of Vehicles Below Average Cost, BYD Pulls Ahead

This article was originally published on Forbes on Nov 9, 2023,09:23pm ESTForbes Forbes on Nov 9, 2023,09:23pm EST

BYD more than doubled Tesla’s China sales in October as Tesla’s sales slipped on a month-over-month basis, while NEV startups showed strong sales numbers across the board. China’s new energy vehicle (NEV) industry continues to exhibit solid momentum, with September seeing NEV sales rise about +22% YoY and October estimated to see around +34% YoY growth. As a whole, China is expected to once again be the primary driver of global EV sales this year, with volumes forecast to reach or exceed 8.5 million units, or more than 60% of the projected 14 million global volume.

Tesla has been in the spotlight recently — its margins have contracted significantly over the past few quarterscontracted significantly over the past few quarters as it prioritizes price cuts. China is Tesla’s most important market as it currently represents the highest remaining total addressable market (TAM), therefore the recent weakness is not something to ignore, especially as domestic rivals pick up their pace of growth.

Sign up for I/O Fund's free newsletter with gains of up to 221% – Click hereClick hereClick here

BYD Trumps Tesla in China as Sales Stagnate

BYD’s delivery numbers have shown tremendous growth in Q3 and the start of Q4, as opposed to Tesla’s stagnation as consumer demand looks to be shifting in favor of local OEMs. XPeng and Li Auto both posted record October numbers with ~300% YoY growth, while NIO saw +60% YoY growth. BYD’s increased dominance in China is more visible with sales data by model: 5 of the top 6 highest selling models in October were BYD, combining for nearly 214,000-unit volume, compared to the Model Y’s 53,249 volume for the month.

China Sales, BYD vs Tesla

Source: I/O Fund

BYD has seen steady growth in NEV and purely BEV sales since May, and since June, BYD has posted five straight record months for NEV deliveries, rising from 253,046 in June to close out Q2 to more than301,000 in October June to close out Q2 to more than301,000 in October to kick off Q4. Deliveries grew +39% YoY in October, the slowest growth rate so far this year, where monthly sales have averaged +77% YoY growth. In terms of BEV sales, for a more apples-to-apples comparison to Tesla, BYD recorded +60% YoY growth to 165,505 deliveries and exports of China-made vehicles in October – more than double Tesla’s total . At that rate, BYD is set to overtake Tesla in terms of quarterly BEV deliveries, being on track to surpass 500,000 BEVs in Q4, whereas Tesla is forecasting a volume of at least 449,000 vehicles in Q4 to reach its1.8 million target for 2023.

China Sales YoY Growth, BYD vs Tesla

Source: I/O Fund

On the other hand, Tesla’s China sales peaked in June at 93,680 vehicles, with September seeing a nearly (12%) MoM and (11%) YoY decline to 74,073 vehicles, including exportspeaked in June at 93,680 vehicles, with September seeing a nearly (12%) MoM and (11%) YoY decline to 74,073 vehicles, including exports. October saw a fractional YoY increase of just +0.6% while registering a consecutive MoM decline of (2.6%), as the OEM continues to lag the growth of the broader NEV industry.

The Profitability Picture

NIO and XPeng are struggling to find a shift to profitability with elevated levels of R&D and losses piling up, whereas Tesla is facing margin troubles, exacerbated by its reliance on China. The reason here is simple: Tesla continues to sell vehicles in China below its average cost, from Q4 2022 through Q3 2023. Currently, the base Model Y is priced around $36,200, and the revamped Model 3 saw a 12% increase in its base price to $35,800 – both still below Tesla’s average cost of ~$37,487 per vehicle in Q3.

The recently announced Model Y price hikes may help alleviate the issue, given the Model Y is accounting for just over 70% of monthly sales in China, but the past four quarters have seen China’s ASP trail average cost per vehicle by (3%) or more.

Tesla's China ASP Below Average COGS Since Q4 2022

Source: I/O Fund

  • Q1 saw Tesla deliver 137,429 vehicles in China (excluding exports) for an average ASP of $35,589.
  • Q2 saw China’s ASP rise ~$1,000 to $36,578 on a +14% QoQ rise in deliveries to 156,676 vehicles. ASP was aided by a price increase in May and a higher mix of Model Y sales.
  • Q3 saw ASP decline once more to $35,953, as deliveries slipped (12.2%) QoQ to 139,624

Although Tesla has made progress in bringing its cost per vehicle lower over the past four quarters, ASP has declined at a quicker rate due to extensive price cuts. However, the sheer volume that China contributes – just under 33% of YTD deliveries at 433,729 vehicles – combined with ASP trailing average COGS means that Tesla’s margins will likely not recover above 20% until China’s ASP shifts back above average COGS. It is important for cost of goods sold (COGS) to be below average selling price (ASP), as the difference between the two is the gross profit. In Tesla’s case, China’s ASPs being below average COGS are weighing negatively on gross profit.

We previously discussed how Tesla will likely continue to lower prices to increase its leading EV market share to stave off competition which will intensify over the next few years. In a competitive analysis framework, we projected Tesla’s Q3 operating margins to decline to a level between Honda and VW, or to 7.8% compared to most recent 9.6%. Operating margin for Q3 was 7.6%, just below our base case and above our bearish case model. For a deeper dive into Tesla’s margin story is evolving, read more here and here.to 7.8% compared to most recent 9.6%. Operating margin for Q3 was 7.6%, just below our base case and above our bearish case model. For a deeper dive into Tesla’s margin story is evolving, read more here and herehere and here.

Automotive Gross Margins

Source: I/O Fund

This is increasingly evident when looking at Tesla’s automotive gross margins. Automotive margin saw a pinch in Q2 2022 as COGS rose, before falling below 20% in Q4 2022 as China ASPs shifted below the COGS curve. Margins have fallen each quarter this year as China ASPs remains below the curve, dragging on global ASP which continues to slide as a result of price cuts.

However, BYD is showing strength in margins this year – BYD’s automotive gross margins surpassed 25% in Q3, rising from 20.7% in Q1 and from 22.8% in the year ago quarter. Automotive gross margin has also markedly improved from 15.6% in Q1 2022, an expansion of 1010 bp, while Tesla’s margins have contracted 1390 bp since peaking that same quarter at 29.65%. BYD has cut prices of some of its popular models, but not to the degree that it has become detrimental to margins.

Every Thursday at 4:30 pm Eastern, the I/O Fund team holds a webinar for premium members to discuss how to navigate the broad market, as well as various stock entries and exits. We offer trade alerts plus an automated hedging signal. The I/O Fund team is one of the only audited portfolios available to individual investors. Learn more here.Learn more hereLearn more here.

China’s Importance to Tesla

Tesla’s weaker sales numbers in China in September and October do raise some demand concerns, as these two months typically are the start of seasonal strength lasting through December. It also raises broader concerns within its margins and revenue growth, due to the outsized influence China has on Tesla’s production and deliveries.

Gigafactory Shanghai accounts for slightly more than half of Tesla’s current installed production capacity of ~1.85 million vehicles, with the plant capable of operating at a ~0.95 million annual run rate. Tesla noted in Q3 that the “Shanghai factory has been successfully running near full capacity for several quarters, and we do not expect a meaningful increase in weekly production run rate.” In Q3, Tesla sold 222,517 China-made vehicles, with 82,893 exported. On a YTD basis, Tesla sold 699,056 China-made vehicles, with 265,327 exported. That means China accounted for ~51.1% of Q3’s total deliveries and ~52.1% of the 1.32 million total deliveries YTD.

Shanghai is essentially maxed out in terms of the volume of vehicles that it can churn out, so October’s stagnation raises more questions about how Tesla will regain market share in China. With BYD’s strong growth in Q3 and Tesla’s slide in September, the American EV maker saw its market share fall more than 300 bp QoQ from 12.98% in Q2 to 9.89% in Q3.

While September’s MoM weakness could be chalked up to a production line upgrade in anticipation of the revamped Model 3, October’s MoM stagnation either points to a slowdown in production off full capacity at Giga Shanghai (annualized rate of ~0.86M vs ~0.95M max), or a build-up in China-made inventory. Neither scenario would be much of a positive for Tesla heading into China’s seasonally strong Q4, as both could suggest more demand weakness through the end of the year.

Conclusion

The main story for Tesla investors at the moment is when margins will bottom, as automotive and gross margin continues to deteriorate. China offers a major clue for when and where margins will bottom, given that Tesla relies on the country for about one-third of its deliveries and just over 20% of its revenues.

BYD is excelling at executing during this price-competitive time, with deliveries reaching a new monthly record while margins expand. On the other hand, Tesla has seen monthly sales in China stagnate, with ASP in the country sliding again in Q3. With China’s ASP currently going on five quarters below Tesla’s average COGS, the bottom for margins is still not in sight.

I/O Fund Equity Analyst Damien Robbins contributed to this report.

Please note: The I/O Fund conducts research and draws conclusions for the Fund’s positions. We then share that information with our readers. This is not a guarantee of a stock’s performance. Please consult your personal financial advisor before buying any stock in the companies mentioned in this analysis.

Recommended Reading:

  • Solar Stocks Still Searching For A Bottom
  • Renewable Energy Stocks That Benefit From $400 Billion IRA Bill
  • Tesla’s Margins: How Low Will They Go?
  • Tesla Q2 Earnings – It’s About Margins
Posted in China Stocks, Consumer Tech, Electric VehiclesLeave a Comment on Tesla Sells 33% Of Vehicles Below Average Cost, BYD Pulls Ahead

Apple Q4: iPhone Revenue Accelerates while Services Shine

Posted on November 3, 2023June 30, 2026 by io-fund

Apple posted Q4 results that were roughly in line with expectations: revenues of $89.49 billion met consensus estimates, while EPS of $1.46 beat estimates by about 5.0%. iPhone revenues accelerated sequentially to reach a September quarter record, while Services revenue also rose to a new record, reaccelerating to the high-teens after four quarters of single-digit YoY growth.

Installed devices reached a new all-time high across all geographies and products. CEO Tim Cook said Apple has its “strongest lineup of products ever heading into the holiday season, including the iPhone 15 lineup and our first carbon neutral Apple Watch models.” Supply constraints and reports of weak demand for the iPhone 15 may overshadow the strength of that lineup, but Apple is expecting iPhone sales to rise in the December quarter, while other product revenue will weigh on revenue that is forecast to be similar to last year’s numbers.

Q4 Revenue and EPS:

  • Q4 revenue of $89.49 billion marginally beat expectations of $89.28 billion, representing a YoY decline of (0.7%).
  • iPhone revenue of $43.81 billion met expectations, growing by +2.8% YoY and +10.4% QoQ.
  • Services revenue of $22.31 billion grew by +16.3% YoY.
  • GAAP EPS of $1.46, up 13.2% YoY, driven by an improvement in net margin and a (2.8%) reduction in share count. 

Margins:

  • Gross margin was 45.2%, 20 bp above management’s guidance of 44% to 45%. Gross margin improved 65 bp QoQ.
  • Operating margin was 30.1%, an improvement of ~200 bp QoQ and ~250 bp YoY. The improvement was aided by growth in gross margin and operating expenses of $13.46 billion coming in slightly below guidance of $13.5 billion to $13.7 billion.
  • Net margin was 25.6%, an improvement of ~135 bp QoQ and ~265 bp YoY. Net margin improved to the highest level since fiscal Q2 2022.  

FY23 Key Metrics:

  • Revenue declined (2.8%) YoY to $383.3 billion.
  • EPS of $6.13 improved +0.3% YoY.
  • Gross margin of 44.1% improved ~80 bp YoY from 43.3%.
  • Operating margin of 29.8% declined ~50 bp YoY from 30.3%.
  • iPhone revenue of $200.6 billion, representing a (2.4%) YoY decline from $205.5 billion.
  • Services revenue of $85.2 billion, representing a +9.1% increase from $78.1 billion. 

Cash and Debt:

Apple had $162.1 billion in cash, equivalents and marketable securities at the end of the fiscal year, with total debt of $105.1 billion. Net cash on hand was $57.0 billion.

Operating cash flow for the full year was $110.5 billion, a YoY decline of (9.5%) from $122.2 billion.

Other Key Metrics:

Q4 saw Apple record a record September quarter for iPhone sales, while iPad and Mac sales declined as Apple lapped a tough comp where it fulfilled significant pent-up demand in the year-ago quarter following factory shutdowns. Mac sales missed estimates by nearly $1 billion, declining (33.8%) YoY to $7.61 billion. Cook said the Mac should have a “significantly better quarter” in the upcoming December quarter, helped by holiday sales and the newly released M3-powered Macs.

However, both Mac and iPad revenues increased about +11.3% sequentially: Mac revenues rose from $6.84 billion to that $7.61 billion figure, while iPad revenues rose from $5.79 billion to $6.44 billion. Wearables, Home & Accessories revenues increased more than $1 billion sequentially to $9.32 billion.

For FY23, product revenue declined (5.7%) YoY to $298.1 billion from $316.2 billion in the previous fiscal year, dragged lower by a ~($10.8) billion decline in Mac revenues, with some softness in iPhone and Wearables, Home & Accessories.

Services Shine Once More

Services stole the show in Q4 after posting four consecutive quarters with YoY growth rates between 5% to 9%, with revenues rising +16.3% YoY and +5.2% QoQ to $22.31 billion. This came in nearly 4.5% above analysts' expectations for $21.35 billion.

Reaching a new all-time high in its installed device base signals further growth lies ahead for Services, especially with the recent price hikes that Apple put into effect for News+, Arcade, and its One bundles. Combined, the price hikes could entail an additional ~$5 billion in annual revenue with just a 15% attach rate to Apple’s more than 1 billion paid subscriptions.

It’s well known that Apple has one of the most loyal customer bases in the world for its products; however, it’s also fair to say that Apple also holds one of the most loyal paying subscriber bases in the world. Paid subscribers have risen at more than 27% annually from 240 million at the start of FY18 to more than 1 billion at the end of FY23. As installed devices continue to grow, paying subscribers should continue to grow hand in hand, providing a strong growth lever for Services.

Services is also seeing its contribution to Apple’s bottom line surge because of that strong growth in paying subscribers. Services contributed $0.39 to each $1 of gross profit Apple generated in Q4; in FY23, Services contributed nearly $0.36 per $1, up +8.8% from the $0.33 per $1 it added in FY22.

Another way to put that: Services contributed almost 40% of gross profit in Q4 and nearly 36% in the full year, despite only contributing ~25% of revenue in Q4 and 22.2% in the full year. That outsized influence down the line is already evident – gross margins continue to expand, rising above 45% in Q4, helping drive +8.3% YoY growth in operating income. As Services begins to approach and surpass 30% of total revenue, that contribution should continue to rise, potentially towards the 50% range.

However, one risk to watch is Alphabet’s antitrust trial, as it could have direct implications for Apple in the event of a negative ruling. Alphabet’s multi-billion dollar payments to Apple for Google to be the primary search engine on Safari across Apple’s devices is at the center of the trial, and that payment is rumored to be ~$19 billion this year. Should the scale of those payments constitute monopolization of the search market, Apple could be set to lose on a lucrative Services revenue stream.

iPhone 15 Demand Under the Microscope

Apple’s new iPhone will be under the microscope, following Apple’s weaker December quarter revenue guide, uncertainties about supply, and lingering questions about China risks.

Speaking with CNBC prior to earnings, Cook said the iPhone 15’s Pro and Pro Max models were still constrained due to elevated demand — the iPhone 15 was estimated to have received 10% to 12% more pre-orders than the iPhone 14.

However, analysts remain cautious about the supply and demand environment: BofA said in mid-October that iPhone 15 availability was improving, UBS said that contracting wait times suggested demand for the new phone looked weak, while Morgan Stanley echoed UBS’ fears, pointing to moderating delivery lead times in late October as another sign of demand weakness.

Counterpoint Research data painted a split picture for early iPhone 15 demand: the research firm said that China sales were down (4.5%) YoY relative to the iPhone 14, while US sales were showing double-digit increases.

Estimates for the December quarter were projecting +4.9% YoY growth to $122.90 billion in revenue, but Apple signaled that the one-week-shorter quarter would see similar revenues, at the $117 billion range. Apple signaled that the extra week last year “added approximately 7 percentage points to the quarter's total revenue,” so it is understandable why Apple would forecast flatter sales YoY in a 13-week quarter this year compared to the 14-week quarter last year. Management did signal that they “expect iPhone revenue to grow year-over-year on an absolute basis.”

Normalization of supply constraints to meet demand and see iPhone sales grow to more than $66 billion would be a positive, although risks remain in China, primarily from high demand for Huawei’s new Mate 60 Pro. China’s sales will be scrutinized, given that the Mate 60 Pro was estimated to have sold 1.6 million units in its first six weeks, and 400,000 units in the two weeks following the iPhone 15 launch in the country.

Revenues had declined (2.5%) YoY and (4.3%) QoQ in the Greater China region in Q4, while December quarter sales last fiscal year also failed to impress, showing a (7.3%) YoY decline. As Apple’s third largest market, generating annual revenues around $70 billion or more, another weak holiday quarter would raise concerns that Huawei could overtake Apple in terms of market share, as it is quickly encroaching on Apple based on recent data from Canalys and Counterpoint Research.

Earnings Call:

Apple’s earnings call reflected the strength of Services, while talking up the growth opportunities in emerging markets and signaling more gross margin expansion.

Apple “achieved all-time revenue records across App Store, advertising, AppleCare, iCloud, payment services, and video, as well as the September quarter revenue record in Apple Music.” CFO Luca Maestri said Apple saw “growth coming from all categories and every geographic segment,” while its “installed base of over 2 billion active devices continues to grow at a nice pace and establishes a solid foundation for the future expansion of the ecosystem.”

In addition, “transacting accounts and paid accounts grew double-digits year-over-year, each reaching a new all-time high. Also our paid subscriptions showed strong growth. We have well over 1 billion paid subscriptions across the services on our platform, nearly double the number we had only three years ago.” That suggests Apple has more than 1.1 billion paid subscriptions, or a ratio of about 1 paid subscription per every 2 active devices.

 The main takeaway from management’s commentary is that Services has many levers to drive growth, from the recent price hikes to constant increases in paid subscriptions driving record revenue across multiple offerings. At just over $85 billion in TTM revenue, the segment is poised to capture that $100 billion run rate sooner, potentially as soon as two to four quarters.

Apple guided gross margins to be “between 45% and 46%” from the coming quarter, versus the 45.2% just reported and a ~200 to 300 bp improvement YoY. Services will have a marginal impact on that expansion, but management pointed to “improved costs and improved mix” on the product side as a driver, while FX will continue to have an adverse impact on margins. Increasing gross margin from the low 43% range in FY22 to the 45% to 46% range in FY24 is no small feat at Apple’s scale.

Management added that they were “particularly pleased with our performance in emerging markets with revenue reaching an all-time record in fiscal 2023 and double-digit growth in constant currency.” Apple “achieved an all-time revenue record in India, as well as September quarter records in several countries, including Brazil, Canada, France, Indonesia, Mexico, the Philippines, Saudi Arabia, Turkey, the UAE, Vietnam and more.” iPhone sales also reached “quarterly records in many markets, including China mainland, Latin America, the Middle-East, South Asia and an all-time record in India.”

Conclusion:

Apple’s fiscal Q4 fell relatively in line with expectations, but Services shine as it surged back to double-digit revenue growth. iPhone revenues reached a September quarter record, but a weaker-than-expected December quarter guide and hints of demand weakness raise concerns about a return to growth in the upcoming fiscal Q1. Apple is showing a tremendous ability to expand gross margin at scale, which will ultimately be aided by Services in the long-run, which has multiple levers for continual growth in the double-digit range.

Damien Robbins, Equity Analyst at the I/O Fund, contributed to this article.

Recommended Readings:

  • AEHR Fiscal Q1: More Orders Likely this Fiscal Year
  • Tesla’s Margins Fall Again
  • Netflix: Cash is King and Pivot is on Track
  • CrowdStrike: Steady Growth, Strong Bottom Line
Posted in Consumer Tech, Tech StocksLeave a Comment on Apple Q4: iPhone Revenue Accelerates while Services Shine

Tesla’s Margins Fall Again

Posted on October 19, 2023June 30, 2026 by io-fund

Tesla reported Q3 earnings that missed on both the top and bottom lines. Revenue of $23.35 billion missed by $0.79 billion, while non-GAAP EPS of $0.66 missed by $0.07. Margins continued to slide, with gross margin declining ~30 bp QoQ and ~720 bp YoY to 17.9%, and operating margins falling ~210 bp QoQ and ~960 bp YoY to 7.6%. A shift in product mix and price cuts led to a lower ASP during the quarter.

We wrote at the end of August that Tesla’s Q3 operating margins can decline to a level between Honda and VW – between 7.0% to 8.5%, with Q3’s actual 7.6% coming in just shy of the midpoint there. If operating margins were to reach a level closer to 6.0%, like GM, that could be a sign they’re close to the bottom. The continual decline in margins highlights the broader concern for investors that Tesla still not provided any guidance to assess how low margins may fall. The OEM’s Q3 update stated the goal remains unchanged: “reducing cost per vehicle… while maximizing delivery volumes.”

In that regard, Tesla kicked off October with another price cut in the US after Q3 deliveries missed expectations. The cuts, for certain Model 3 and Model Y versions, took the base Model 3 price down approximately -3.1% to $38,990. Another cut to spur demand signals that the bottom still may not be in yet for margins, given that the base Model 3’s latest price point sits just ~4% above Tesla’s average COGS of $37,500 in Q3.

Revenue and EPS:

  • Revenue of $23.35 billion missed expectations by (3.3%). This represented YoY growth of +8.9%.
  • Automotive revenue of $19.625 billion grew by +5.0% YoY.
  • GAAP EPS of $0.53 declined (44.2%) YoY, driven by the decline in gross and operating margins.
  • Non-GAAP EPS of $0.66 missed expectations for $0.73, representing a YoY decline of (37.1%).

Margins:

  • Gross margin of 17.9% missed expectations for 18.0%.
  • Operating margin declined for a fourth straight quarter to 7.6%.
  • Automotive margin (excl. leasing & regulatory credits) was 15.75%, declining from 17.52% in Q2 and 26.35% in the year-ago quarter.
  • Adjusted EBITDA margin declined ~260 bp QoQ and ~710 bp YoY to 16.1%, as adjusted EBITDA fell (24.2%) YoY.
  • GAAP net margin of 7.9% represented a decline of ~290 bp QoQ and ~740 bp YoY.

Cash & Debt:

Tesla’s cash and investments rose by ~$3.0 billion from Q2 to reach $26.08 billion, driven by ~$2.19 billion in net borrowing for vehicle and energy system financing and ~$0.85 billion in free cash flow. Free cash flow declined (74.3%) YoY from $3.30 billion in the same quarter last year, impacted by a $1.79 billion decline in operating cash flow and a $0.66 billion increase in CAPEX. TTM free cash flow of $3.71 billion was at the lowest level since Q4 2020.

Operating cash flow of $3.30 billion declined (35.1%) from $5.10 billion in the same quarter last year but improved +7.9% sequentially from Q2. TTM operating cash flow of $12.16 billion reached the lowest level since Q4 2021.

Tesla reported ~$4.39 billion in total debt and finance leases, up from $2.33 billion in Q2, driven by the $2.19 billion surge in net borrowings under vehicle and energy financing.

Other Key Metrics:

Energy storage revenues increased +39.6% YoY to $1.56 billion as deployments rose +90% YoY to 4.0 GWh, and services and other revenue increased +31.7% to $2.17 billion. Energy storage posted a gross profit margin of 24.4%, while services saw a gross profit margin of 6.0%. Tesla said that “pay-per-use Supercharging remains a profitable business for the company, even as we scale capital expenditures” to expand the network further. Supercharger connector deployments increased +31.4% YoY to 51,105.

Despite the top and bottom-line misses and a miss on Q3 deliveries, Tesla critically kept its 1.8 million delivery target unchanged. That suggests at least 475,000 deliveries in Q4, a new high for Tesla and approximately +1.9% higher than Q2’s 466,140 tally. Tesla has more than 2.23 million installed annual capacity, excluding the Cybertruck in pilot production; there should be no issue on the production side to reach the 1.8 million target. Price cuts continuing already in Q4 suggest that demand may remain weak throughout Q4.

A Closer Look at Margin Troubles:

Automotive revenues increased +5.0% YoY, as weaker pricing offset a +28% YoY rise in deliveries to 435,059 vehicles. On a sequential basis, automotive revenues declined (7.1%), as deliveries declined (6.7%) from Q2. Weaker ASPs in the quarter, at approximately (3.1%) lower than Q2, contributed to that sequential decline.

A worrisome trend is emerging in both ASPs and automotive gross margins as Tesla continues to cut vehicle prices. Automotive gross margins (excluding vehicles subject to leases) fell below 16% in Q3, dropping from 17.52% in Q2 and down from 28.46% in Q3 2021, with little relief along the way down.

CFO Zachary Kirkhorn stated back in January this year that that “Tesla would not go below margins of 20% [including leasing and regulatory credits] and an average selling price of $47,000 across models.” Automotive gross margin including leasing and credits declined to 18.7% in Q3, down from 19.2% in Q2 and 21.1% in Q1. 

ASPs have fallen (16.7%) YoY and (20.1%) from a peak in Q2 2022 at ~$55,690 per vehicle to reach ~$44,493. That represented a decline of ($1,469) from Q2’s ~$45,962, more than offsetting the $421 reduction in COGS per vehicle during the quarter.

Looking forward to Q4, should an improved mix offset price cuts to leave ASPs virtually unchanged, Tesla more than likely will have to bring COGS per vehicle lower by at least ~1.5%, to reach point below $37,000, to bring automotive gross margins back above 17%. If COGS per vehicle does not fall to that degree, ASPs will need to rise by at least 1% in the face of price cuts to bring that inflection in margins.

Earnings Call:

Tesla’s earnings call highlighted the difficulties in finding a concrete bottom for margins, as the OEM continues to “invest significantly in AI,” while noting that “there will be enormous challenges in reaching volume production with the Cybertruck, and then in making a Cybertruck cash flow positive.” Therefore, “R&D expenses continued to rise due to Cybertruck prototype bills and pilot production testing combined with spend on AI technologies like full self-driving, Optimus and Dojo.” Increased CAPEX has been detrimental to free cash flow metrics, while heightened R&D will also drag on operating margins – which Tesla inadvertently signaled have yet to bottom.

Tesla said that its “Q3 operational and financial performance was impacted by planned downtimes for our factory upgrades. This was necessary to allow for further factory improvements and production rate increases. Despite such factory shutdowns, our cost per vehicle decreased to approximately $37,500. We saw sequential decreases in material cost and freight. Reducing the cost of our vehicles is our top priority.”

While cost reductions can help prop up margins, Tesla also signaled that price adjustments may continue over the next months to quarters: “as interest costs in the U.S. have risen substantially, it has required us to adjust the price of our vehicles to keep the monthly cost in parity. We’ve tried to offset such adjustments via focus on reducing costs. However, there is an inherent lag in cost reductions, which in turn impacts margins.” Elon Musk added later in the call, “if interest rates remain high or if they go even higher, it’s that much harder for people to buy the car, they simply cannot afford it.” Rates advancing higher would likely force more price reductions to keep those monthly payments relatively close to parity, while higher rates for longer could keep vehicle prices depressed for longer, thereby weighing down on margins.

Conclusion:

Margins were the major story heading into Q3’s earnings and remain the major story moving forward, as Q3’s weaker operating margin print at 7.6%, combined with declining ASPs and automotive gross margins, signal that Tesla is still not much closer to finding a bottom.

Q3’s earnings call supported that view, as Tesla pointed out that reducing vehicle costs remains a key focus but emphasized that affordability is driving price reductions as interest rates rise. Given that there has been no relief in rates, Q4 started with a ~3.1% price cut to the base Model 3 in the US alongside other price cuts.

Tesla did reiterate its 1.8 million target for the year, pointing to a possible record Q4 for production and deliveries, with more than enough installed capacity to reach that goal. While a resumption of sequential delivery growth will be a positive, the question again comes down to how many price adjustments will occur during Q4 and if margins can withstand such adjustments to find a bottom soon.

Damien Robbins, Equity Analyst for the I/O Fund, contributed to this analysis.

Recommended Reading:

  • Netflix: Cash is King and Pivot is on Track
  • Palo Alto Networks: “Firmly” GAAP Profitable
  • Enphase: Price is Low for a Global Solar Leader
  • Tesla Q2 2023 Earnings – It’s About Margins
  • ON Semiconductor: Powering the EV Highway
Posted in Consumer Tech, Electric VehiclesLeave a Comment on Tesla’s Margins Fall Again

AI Could Be Apple’s Next Chapter

Posted on October 18, 2023June 30, 2026 by io-fund
AI Could Be Apple’s Next Chapter

This article was originally published on Forbes on Oct 13, 2023,05:15am EDTForbes Forbes on Oct 13, 2023,05:15am EDT

After Nvidia added $750 billion in value this year on the backs of surging AI chip demand, investors are quickly searching for the next trillion-dollar AI winner. AI is the best investment opportunity of our lifetimes, and although Apple (AAPL) has been relatively overlooked as an AI play, the tech giant could quickly become a force to be reckoned with in the AI space. The reason for this is simple. Apple can bring AI to the consumer’s pocket by the billions, and is rumored to be sitting on one of the best AI models on the market today, with comparable performance to OpenAI’s ChatGPT.

Two Billion Devices to Lever AI

Apple’s installed active device base surpassed 2 billion last February and “reached an all-time high in every geographic segment” at the end of the June quarter, according to CFO Luca Maestri. The iPhone’s installed base also “grew to a new all-time high,” and is estimated to have nearly 1.5 billion active devices worldwide, after adding around 500 million active devices since 2019—an 11.4% compound annual growth rate since then.

Active iPhone Users Worldwide Chart

Source: I/O FUND

While installed active devices reached a new record, so did Apple’s subscriber base. CEO Tim Cook noted during Apple’s FQ3 report in August that the company hit an “all-time revenue record in Services” with “over 1 billion paid subscriptions,” which are growing at a double-digit rate. Apple has added more than65 million subscribers in the first half of this fiscal year and more than 300 million subscribers over the past two fiscal years heading into its fiscal Q4.

Apple Paid Subscription Chart

Source: I/O FUND

The opportunity for Apple to capitalize on AI arises from the combination of growth within Apple’s installed device base, along with increased engagement and adoption of paid subscriptions over time. Consumer interest in AI surged earlier in 2023 with ChatGPT garnering over100 million active users and more than 1 billion visits monthly. Apple’s installed base offers the chance to more than 10 times the number of individuals with readily available access to AI.

Sign up for I/O Fund's free newsletter with gains of up to 221% -Click hereClick hereClick here

Services Is Where AI Can Shine

Apple is witnessing a higher contribution from its services segment to both revenues and margins—the segment is approaching a $100 billion annual run rate, accounting for nearly 26% of revenue with a 70.5% gross margin.

In other words, services is contributing 41.1 cents to each dollar of gross profit, up from 34.6 cents just eight quarters ago. The segment has seen its contribution to gross profit increase steadily, rising 46% from 23.7 cents per dollar in FY18 to 34.6 cents per dollar to date in FY23. It is not out of the picture for services to soon contribute 50 cents of each dollar of gross profit as the segment surpasses $100 billion in annual revenue.

Services Segment Contribution to Gross Profit Chart

Source: I/O FUND

The importance of services to Apple’s bottom line cannot be overstated—that 70% gross margin level combined with its nearly $100 billion revenue scale has pulled Apple’s margins higher over the past few years and will likely continue to do so in the future as transacting accounts and paid accounts continue to grow to new all-time highs.

This is exactly where AI will have the most profound impact on Apple, and why the tech giant could emerge as a strong AI contender.

Google and Microsoft demonstrate the revenue potential of AI subscriptions at scale—for Microsoft’s Copilot, a 2.5% take rate of the ~382 million commercial Office 365 users would equate to nearly $3.5 billion in annual revenue, while a 10% take rate would see annual revenue reaching $14 billion, according to Macquarie.

In Apple’s case, it has nearly three times the paid subscription base as Microsoft that it could target with an AI product, via a stand-alone service or in one of its three pre-existing service bundles. Regardless of the route that Apple chooses, there remains billions in revenue potential. Offering a stand-alone AI subscription for $2.99 per month could rake in ~$10.8 billion in annual revenue at a 15% attach rate based on Apple’s more than 2 billion active devices, while boosting the prices of its subscription bundles could by $0.50 per month could add more than $5 billion annually.

Every Thursday at 4:30 pm Eastern, the I/O Fund team holds a webinar for premium members to discuss how to navigate the broad market, as well as various stock entries and exits. We offer trade alerts plus an automated hedging signal. The I/O Fund team is one of the only audited portfolios available to individual investors. Learn more here.Learn more hereLearn more here.

Apple Can Bridge the Gap with Mass-Market Consumer AI

Apple is spending millions of dollars per day in a quest to develop a conversational AI model, potentially for Siri, that would allow iPhone and iPad owners to use voice commands for automating multi-step tasks with the voice assistant. As such, Apple is uniquely positioned to both monetize and implement advanced AI in a mass-market consumer application.

Consumers, especially Millennials, are very willing to adopt and pay for such voice assistants that are as smart and as reliable as a human. According to a PYMNTS survey from April, more than 42% are willing to pay $10 or more per month for an assistant.

Although Apple is tight-lipped about the progress of its AI projects, the so-called Apple GPT chatbot is rumored to be more powerful than Open AI’s GPT 3.5 model, according to The Verge. Apple is spending millions of dollars a day training the large language model Ajax on more than 200 billion parameters.

The project could find life integrated within Siri, given the applications within automating multiple tasks and range of capabilities stemming from image and video recognition.

Apple GPT Projection

Apple's Apple GPT model is rumored to be more powerful than OpenAl's GPT 3.5, as well as Google's LaMDA, Meta's LLaMA and LLaMA 2, and Anthropic's Claude 2 model. – Source: I/O FUND

Apple noted back in 2020 that Siri had more than 25 billion requests made per month, a figure that could easily be increased with a ChatGPT-like chatbot installed across billions of devices. That is how Apple can be the first big stock in consumer driven AI uptake.

On Real Vision, I previously pointed out that “if you take a consumer-facing company like Google,” that they are in a good position because Google doesn’t “have to go out and try to get lots of consumers to adopt something new, consumers will continue to use Search, it’ll just be improved Search; advertisers will continue to use Google, it’ll just be improved ROI.”

For Apple, it’s the same case – it does not have to try to convert millions of users into a paid subscriber in the way that OpenAI does; rather, it could easily integrate an advanced conversational AI model within Siri for example, and quickly convert already-paying subscribers over to those AI services.

Damien Robbins, Equity Analyst at the I/O Fund, contributed to this article

The I/O Fund was early to AI with a 45% allocation in 2023. For more in-depth research from Beth, including 15-page+ deep dives on the 10 stock positions the I/O Fund owns, subscribe here.

Recommended Reading:

  • Apple’s Stock In Focus: More Profitable Than Banks
  • Apple Vs. The FAANGs (Technical Analysis)
  • 5 Soon-to-Be Trends in Artificial Intelligence And Deep Learning
  • Apple Bets On The Emerging Markets Growth Story
Posted in Ai Platforms, AI Stocks, Consumer Tech, MobileLeave a Comment on AI Could Be Apple’s Next Chapter

Tesla’s Margins: How Low Will They Go?

Posted on August 31, 2023June 30, 2026 by io-fund
Tesla’s Margins: How Low Will They Go?

As the I/O fund looks to position itself for the remainder of 2023. Fundamentally,  we’re avoiding ‘Crocodile Jaw’ situations where the stock price is going up but fundamentals are decelerating. This is one of the reasons we greatly reduced our Tesla position for a ~60% gain. 

Tesla stock has rallied through most of 2023 during a time when consensus was estimating sales to grow +23% y/y but earnings to decline 15%. The main driver behind the decline in earnings estimates is that Tesla has decided to lower prices to increase volumes at the expense of margins.

Starting in Q322 through Q223, operating margins have declined from 17.2% to 9.6%. Initially, Tesla cited making sure certain models qualified for the EV tax credit and later higher interest rates as the primary reasons for lowering prices.

Higher interest rates are effectively a price hike that increases monthly payments for those who finance their purchases. Tesla recently announced 84 month financing to lower monthly payments. Reducing the sales prices also helps lower monthly payments. Meanwhile, increasing EV inventory at dealerships and discounting at an industry level are likely another contributing factor.

However, the challenge of higher interest rates is not unique to Tesla. All OEMs face the same obstacles. Below are reported operating margins for the major global OEMs from Q322 through Q223. Either they were relatively stable for the Germans and Koreans or bottomed in Q123 and have improved in the case of the Japanese.

Despite this, Tesla is the one OEM whose operating margins have continued to decline.

OEM operating margins graph

 Source: Y-Charts

It’s Not Just Macro

This highlights that there are other forces at work beyond the macro. We believe it points to Tesla implementing a pricing strategy to gain market share. Taking into consideration the competitive factors at work will help in trying to decipher Tesla’s pricing strategy and how that will impact operating margins for the remainder of 2023. It is through this competitive analysis framework that we will try to parameterize how low Tesla operating margins can go.

For this analysis, we chose to focus on reported group operating margins. Although this metric includes non-EV businesses, we believe it’s the most objective and public measure to provide an apples-to-apples comparison across the auto landscape globally.

At the end of Q422, Tesla's operating margin was 16%. To provide some context, at the time this was greater than the German OEMs. Tesla had firmly positioned itself in the premium segment.

The Germans have been dealing with their own challenges integrating EV offerings, and have been trying to catch-up with Tesla. Perhaps sensing its competitive moat within the premium market was fortified, this gave Tesla an impetus to lower prices further to attack the mass market segment. In Q223, Tesla’s operating margins declined to 9.6% after enacting a series of price cuts.

Currently, this is how Tesla’s operating margins compare to its main competitors. As can be seen below, Tesla’s Q223 reported operating margins are below those of most of the major US, German, Japanese and Korean OEMs.

OEM operating margins

Source: Y-Charts

How Low Can Operating Margins Go?

Strategically, Tesla will likely continue to lower prices to increase its leading EV market share to stave off competition which will intensify over the next few years. Tesla’s electric market share peaked at 78% in 2018 and stood at 62% in 2022.   By 2026, Merrill Lynch estimates it will decline to 18%

2026 EV market share estimates

Source: Merrill Lynch

In the most recent Q2 call, both Elon Musk and Zachary Kirkhorn, former CFO, signaled Tesla‘s focus will continue to be on volumes.

Musk 

“So, I think it’s sort of, it would be — I think it — it does make sense to sacrifice margins in favor of making more vehicles because we think in the not too distant future, they will have a dramatic valuation increase.”

Kirkhorn

“We continue to work towards our goals of maximizing volumes on our vehicle business … in a way that generates the capital to continue our pace of R&D and capital investments.”

Through this competitive analysis framework, we believe Tesla’s Q3 operating margins can decline to a level between Honda and VW. Taking the midpoint, operating margins may go to 7.8% compared to most recent 9.6%. If operating margins were to reach a level closer to — or below GM perhaps — that could be sign they’re close to the bottom. This highlights the broader concern for investors in that Tesla has not provided any parameters nor guidance to assess how low margins may go. It is why we significantly reduced our position.

We have two base cases.

Base Case 1 is that Q3 operating margins are between Honda’s and VW at 7.8%.

Base Case 2 is more bearish in that they reach GM’s at 6.2%. For now, we believe Base Case 1 is the most likely. Consensus opm estimates are higher and consensus will have to revise down their Q3 and Q4 operating profit estimates if either case materializes.

tesla operating margins

In the medium term, there are reasons to be optimistic that Tesla’s strategic moves may bear fruit and its margins will rebound. In addition to lowering prices, the move from the CSS to Tesla’s NACS EV charging standard may help Tesla take market share away from those who have not yet announced plans to shift to NACS. Namely, Toyota and Honda who together have 25% automotive market share in the US. Meanwhile, Tesla deserves credit for maintaining its premium brand perception despite lowering prices. For now, the Tesla brand is almost synonymous with EVs. The refreshed Model 3  may further strengthen Tesla’s position in the minds of consumers.

Sign up for I/O Fund's free newsletter with gains of up to 221% – Click hereSign up for I/O Fund's free newsletter with gains of up to 221% – Click hereClick here

Tesla’s Price Action:

We continue to see a bifurcated market, which has been one of the leading themes in 2023. Some markets/stocks have likely put in tops, while big tech, especially those names perceived to be involved in AI, suggest another high is likely. Tesla falls into this camp, where one more high is still on the table before we have to deal with a bout of extended volatility. You can read more about our broad market analysis here.

The question for Tesla investors is whether the January low was a major low, or do we have one push lower before a major low is struck? There are some stocks, like NVDA and NFLX, for example, that will likely see similar bouts of volatility in the coming months, yet they have a high probability of making a lower high. Tesla could fall into this category.

There are two large counts that I’m tracking based on the current price information that account for these scenarios.

  • Blue – The big picture here has TSLA making a higher low in the coming period of volatility. The key to this count will be a large pullback that both holds $147 and is a 3-wave retrace. If this happens, it will be setting up a great buying opportunity.

    On a shorter-time horizon, TSLA has ended the topping region from $300 – $325. We could see one more swing into the $325 region. This will be very strong resistance to monitor, if we get another push. The August low around $213 will be very important. If we break below this level, then it is likely the top is in.

  • Red – on a shorter time horizon, the above analysis applies to both counts. Where this one differs will be in the pattern of the larger retrace.  Instead of a 3-wave retrace, it will have to be a 5-wave pattern that breaks below $147. If this happens, the odds will be quite high that we will see one more low before a major buying opportunity presents itself.
tesla chart

If you own Tesla stock, or are looking to own Tesla, we encourage you to attend our weekly premium webinars, held every Thursday at 4:30 pm EST. This week, we will discuss Tesla, as well as a handful of other AI plays – what our targets are, where we plan to buy as well as take gains.

Recommended Readings:

  • Nvidia Stock: How We Plan To Position For Q2 Earnings
  • Alphabet Stock: Search Giant Is Just Getting Started
  • Tesla Q2 Earnings – It’s About Margins
  • Renewable Energy Stocks That Benefit From $400 Billion IRA Bill
  • Apple Bets On The Emerging Markets Growth Story
Posted in Consumer Tech, Electric VehiclesLeave a Comment on Tesla’s Margins: How Low Will They Go?

Posts navigation

Older posts
Newer posts

Recent Posts

  • The IPO Glut of 2020: Why Valuations Have Gone Too Far
  • Zoom Discusses Two Important Catalysts In Q1 Earnings
  • Three Risk Management Tools the I/O Fund Offers
  • Micron Is Up 900%. Here’s Why the AI Memory Trade May Still Have Room to Run
  • Credo: Reliability Leader Aggressively Moves into Optics

Recent Comments

No comments to show.

Archives

  • June 2026
  • May 2026
  • April 2026
  • March 2026
  • February 2026
  • January 2026
  • December 2025
  • November 2025
  • October 2025
  • September 2025
  • August 2025
  • July 2025
  • June 2025
  • May 2025
  • April 2025
  • March 2025
  • February 2025
  • January 2025
  • December 2024
  • November 2024
  • October 2024
  • September 2024
  • August 2024
  • July 2024
  • June 2024
  • May 2024
  • April 2024
  • March 2024
  • February 2024
  • January 2024
  • December 2023
  • November 2023
  • October 2023
  • September 2023
  • August 2023
  • July 2023
  • June 2023
  • May 2023
  • April 2023
  • March 2023
  • February 2023
  • January 2023
  • December 2022
  • November 2022
  • October 2022
  • September 2022
  • August 2022
  • July 2022
  • June 2022
  • May 2022
  • April 2022
  • March 2022
  • February 2022
  • January 2022
  • December 2021
  • November 2021
  • October 2021
  • September 2021
  • August 2021
  • July 2021
  • June 2021
  • May 2021
  • April 2021
  • March 2021
  • February 2021
  • January 2021
  • December 2020
  • November 2020
  • October 2020
  • September 2020
  • August 2020
  • July 2020
  • June 2020
  • May 2020
  • April 2020
  • March 2020
  • February 2020
  • January 2020
  • December 2019
  • November 2019
  • October 2019
  • September 2019
  • August 2019
  • July 2019
  • June 2019
  • May 2019
  • April 2019
  • March 2019
  • February 2019
  • January 2019
  • December 2018
  • November 2018
  • October 2018
  • September 2018
  • August 2018
  • July 2018
  • June 2018
  • May 2018
  • April 2018
  • February 2018
  • January 2018

Categories

  • 5G
  • About
  • Accounting Tips
  • AdTech
  • Ai Platforms
  • Ai Platforms
  • Ai Platforms
  • Ai Platforms
  • Ai Platforms
  • Ai Platforms
  • Ai Platforms
  • Ai Platforms
  • Ai Platforms
  • Ai Platforms
  • Ai Platforms
  • Ai Platforms
  • Ai Platforms
  • Ai Platforms
  • Ai Platforms
  • Ai Platforms
  • AI Stocks
  • AI Stocks
  • Analysts
  • Application Monitoring
  • Application Monitoring
  • Applications
  • Applications
  • Applications
  • Applications
  • Applications
  • Applications
  • Applications
  • AR
  • Audit Reports
  • Autonomous Vehicles
  • Autonomous Vehicles
  • Autonomous Vehicles
  • Autonomous Vehicles
  • Autonomous Vehicles
  • Autonomous Vehicles
  • Autonomous Vehicles
  • Avod
  • Avod
  • Battery Charging
  • Bear Market
  • Bitcoin
  • Bitcoin
  • Bitcoin
  • Bitcoin
  • Bitcoin
  • Bitcoin
  • Bitcoin
  • Blockchain
  • Blockchain
  • Blockchain
  • Blockchain
  • Blockchain
  • Blockchain
  • Blockchain
  • Broad Market Today
  • Bull Market
  • Bull Market
  • Chainlink
  • Chainlink
  • Chainlink
  • Chainlink
  • China Stocks
  • Cloud
  • Cloud Infrastructure
  • Cloud Infrastructure
  • Cloud Infrastructure
  • Cloud Infrastructure
  • Cloud Infrastructure
  • Cloud Infrastructure
  • Cloud Infrastructure
  • Cloud Platforms
  • Cloud Platforms
  • Cloud Software
  • Cloud Software
  • Cloud Software
  • Cloud Software
  • Cloud Software
  • Cloud Software
  • Cloud Technology
  • Company
  • Company
  • Console Gaming
  • Console Gaming
  • Console Gaming
  • Consumer
  • Consumer
  • Consumer
  • Consumer
  • Consumer
  • Consumer
  • Consumer
  • Consumer
  • Consumer
  • Consumer
  • Consumer
  • Consumer
  • Consumer
  • Consumer
  • Consumer Tech
  • Corrections
  • Crypto Investment
  • Ctv
  • Ctv
  • Ctv
  • Ctv
  • Ctv
  • Ctv
  • Ctv
  • Ctv
  • Ctv
  • Ctv
  • Cybersecurity
  • Cybersecurity
  • Cybersecurity
  • Cybersecurity
  • Cybersecurity
  • Cybersecurity
  • Cybersecurity
  • Cybersecurity
  • Cybersecurity
  • Cybersecurity
  • Cybersecurity
  • Cybersecurity
  • Data
  • Data Analytics
  • Data Analytics
  • Data Analytics
  • Data Center
  • Data Center
  • Data Center
  • Data Center
  • Data Center
  • Data Center
  • Data Center
  • Data Center
  • Data Center
  • Data Center
  • Data Center
  • Data Center
  • Data Center
  • Data Center
  • Data Center
  • Data Center and Processing
  • Data Warehousing
  • Data Warehousing
  • Data Warehousing
  • Data Warehousing
  • Databases
  • Databases
  • Databases
  • Databases
  • Dating
  • Defi
  • Digital Ads
  • Digital Ads
  • Digital Ads
  • Digital Ads
  • Digital Ads
  • Digital Ads
  • Digital Ads
  • Digital Ads
  • Digital Ads
  • Digital Ads
  • Digital Ads
  • Digital Ads
  • Digital Ads
  • Digital Ads
  • E-Commerce
  • Earning Updates
  • Earning Updates
  • Earning Updates
  • Earning Updates
  • Earning Updates
  • Earnings Report
  • Earnings Report
  • Earnings Report
  • Earnings Report
  • Earnings Report
  • Earnings Report
  • Earnings Report
  • Earnings Report
  • ECommerce
  • Electric Vehicles
  • Electric Vehicles
  • Electric Vehicles
  • Electric Vehicles
  • Electric Vehicles
  • Electric Vehicles
  • Electric Vehicles
  • Energy Stocks
  • Enterprise
  • Enterprise
  • Enterprise
  • Enterprise
  • Enterprise
  • Enterprise
  • Enterprise
  • Enterprise
  • Enterprise
  • Ethereum
  • Events1
  • Events1
  • Exchange
  • Faq
  • Finance
  • Financial Analysis
  • Financial Analysis
  • Financial Analysis
  • Financial Analysis
  • Financial Analysis
  • Financial Analysis
  • Financial Analysis
  • Financial Analysis
  • Financial Analysis
  • Financial Analysis
  • Financial Analysis
  • Financial Analysis
  • Financial Markets
  • FinTech
  • Fundamental Analysis
  • Gambling
  • Gaming
  • Genomics
  • Glossary
  • Green Energy
  • Growth Stocks
  • Growth Stocks
  • Growth Stocks
  • Headsets
  • Headsets
  • Health Tech
  • Hydrogen
  • Identity
  • Identity
  • Identity
  • Inflation
  • Inflation
  • Inflation
  • Internet of Things
  • Interviews
  • Interviews
  • Interviews
  • Interviews
  • Investing
  • Investing
  • Ltbh
  • Ltbh
  • Ltbh
  • Ltbh
  • Ltbh
  • Macro Trends
  • Macro Trends
  • Market Trends
  • Market Trends
  • Market Trends
  • Market Trends
  • Market Trends
  • Market Trends
  • Market Trends
  • Market Updates
  • Market Updates
  • Market Updates
  • Market Updates
  • Market Updates
  • Market Updates
  • Market Updates
  • Market Updates
  • Market Updates
  • Market Updates
  • Media
  • Membership
  • Mining
  • Mobile
  • Mobile
  • Mobile
  • Mobile
  • Mobile Gaming
  • Mobile Gaming
  • Mobile Gaming
  • Multimedia
  • Music Streaming
  • NVDA | NVIDIA Corporation
  • Performance Updates
  • Pin Content
  • Podcasts
  • Podcasts
  • Podcasts
  • Portfolio
  • Premium Research
  • Press Releases
  • Press Releases
  • Productivity
  • Productivity
  • Productivity
  • Productivity
  • Productivity
  • Productivity
  • Productivity
  • Reports and Whitepapers
  • Research Services Preview
  • Resources
  • Resources
  • Semiconductor Stocks
  • Semiconductors
  • Semiconductors
  • Semiconductors
  • Semiconductors
  • Semiconductors
  • Semiconductors
  • Semiconductors
  • Semiconductors
  • Semiconductors
  • Semiconductors
  • Semiconductors
  • Semiconductors
  • Semiconductors
  • Social Media
  • Social Media
  • Social Media
  • Social Media
  • Social Media
  • Social Media
  • Social Media
  • Software
  • Software
  • Software
  • Software
  • Software
  • Software
  • Software
  • Software
  • Software
  • Software
  • Software
  • Software
  • Software
  • Software
  • Software
  • Solar
  • Solar
  • Stock Analysis PDFs
  • Stock Updates
  • Stock Updates (Blogs)
  • Supplychain
  • Supplychain
  • Supplychain
  • Supplychain
  • Supplychain
  • Supplychain
  • Svod
  • Svod
  • Svod
  • Svod
  • Svod
  • Svod
  • Tech Podcast
  • Tech Stock News
  • Tech Stock News
  • Tech Stock News
  • Tech Stock News
  • Tech Stock News
  • Tech Stocks
  • Tech Stocks
  • Tech Stocks
  • Tech Stocks
  • Tech Stocks
  • Tech Stocks
  • Tech Stocks
  • Tech Stocks
  • Tech Stocks
  • Tech Stocks
  • Tech Stocks
  • Tech Stocks
  • Tech Stocks
  • Tech Stocks
  • Technical Analysis
  • Telehealth
  • Telehealth
  • Telehealth
  • Telehealth
  • Testing Equipment
  • Testing Equipment
  • Top Tech Stock News
  • Travel
  • Trends Report
  • Tutorials
  • Uncategorized
  • Updates
  • Updates
  • Updates
  • Video
  • Video
  • Video
  • Video
  • Video Footage
  • VR
  • Webinar Alerts
  • Webinar Alerts
  • Webinars
Proudly powered by WordPress | Theme: iofund by iofund.co.uk.