Skip to content
Logo-main-white.860316a8

I/O Fund

  • Home
  • Free Stock Analysis
  • AI Stocks
  • BEST OF 2025
  • Analysts
  • Nvidia Hub
  • About
    • Case Studies
    • About Us
    • Premium Services
    • Pricing
    • Notable Wins
    • I/O Fund Reviews
    • Media
  • Contact Us

Category: Productivity

H2 2021 Cloud Report: Winners Keep Winning, Plus Okta & Auth0

Posted on July 15, 2021June 30, 2026 by io-fund

We are seeing nearly the exact same names in the Top 10 list for forward growth after the Q1 earnings reports. The good news is we picked strong companies and we didn’t abandon them when they were called Covid stocks. This is what you want although you won’t get the drama that comes with SPACs or small caps. 

We continue to like Zoom, Shopify and Datadog. Of those Zoom has the most room in terms of 1-year and 2-year forward estimates as it’s ranked quite low due to the uncertainty following its banner year last year. If we can get some revisions on those estimates with another quarter of strong reporting, then we could see the company return to all-time highs.

Right now, Zoom is ranked number #6 on current year growth at 51% and is ranked #34 for 1-year forward growth at 20% and then ranked #39 on 2-year forward growth at 17%. That’s quite the gap between current year and 1-year forward on a company that’s reported strong for many years. If the company clears Q2, the uncertainty should start to clear up. You know where we stand – winners keep winning and this product has exceptional product-market fit. We’ve covered this very in-depth on the site across many reports.

Regarding Shopify, I had said that the immense distribution that comes from reaching roughly 4.4 billion social media users across many sites, including TikTok, should not be overlooked in the noise. The combination of a strong product cracking open the pinata on this kind of distribution is what we want in our portfolio for the LTBH positions. Here’s an excerpt from the May update:

“The reason we want to increase our position in Shopify throughout the year is fairly straight forward – Shopify is now reaching billions of consumers through social media. The distribution potential of these partnerships reminds me of an avalanche trigger as Shopify will reach billions with Facebook and Tik Tok and hundreds of millions with Pinterest. Now, they only need to build out the Fulfillment Center and focus on improving their own app; although borrowing these mega size audiences is probably the fastest path to growth for our purposes.”

Datadog is a position that lets us participate in the cloud IaaS growth of Azure and AWS and Google Cloud but through a pureplay. We reviewed this company post-Covid here and also on the 1-Hour LTBH Webinar Update last month.

Twilio’s story hasn’t fully come together yet but we like the Signal acquisition very much. In an effort to get in front of the market, we held a 1- hour LTBH webinar on this company as we like to highlight stocks where the story is not fully known yet our conviction is high.

We’ve also covered Crowdstrike and entered/exited this stock. There is plenty of coverage on Cloudflare on our forum although we have not officially covered this stock. We’ve passed on Palantir due to low commercial account growth. We front run many stocks (technically, we are front running Twilio on the pivot), however, transitioning from government contracts to commercial accounts is tricky in the tech industry. This is because the product was developed and the team built with guaranteed sales and moving into a more “only the strong survive” environment, is a different skillset. We continue to monitor this company.

Notably, we are also pleased that Asana is doing well. It’s the top performing cloud stock this year, up 127% year-to-date with our position up about 100%. I can’t claim credit for this as all of the credit goes to Knox’s technical chops. Atlassian guided for negative growth sequentially and this is being revised upward quite a bit right now with some 60-day revisions up as much as 35%. However, at the roughly 21% growth that management guided for, we like Asana better for now.

Spotlight on Okta and the Auth0 Acquisition

One name that is starting to pop up in my Q1 post-earnings scans is Okta. Okta is a stock we’ve covered in the past yet shied away from during budget constraints in Covid. You can access our prior research here.

Okta

Okta gets an honorable mention for moving back into the top 10 list for both the 1-year and the 2-year forward revenue estimates. In fact, right now it’s estimated to be a percentage point higher than Crowdstrike on the forward estimates. This isn’t organic as it’s due to the Auth0 acquisition, which we discuss in detail below.

Okta: Product Summary

As mentioned, we’ve covered Okta with an in-depth analysis published last year. I’d like to review a few key points from that analysis before we talk about Auth0.

In the previous analysis, we discussed the importance of IAM systems as it allows for the administration of user access across an enterprise and also ensures compliance. This is critical because 60% of data breaches are caused by an organization’s own employees. By having one digital identity for employees and customers, a company can easily modify and monitor a digital identity to allow access to the appropriate assets and in the right context.

IAM became more complicated once employees began to use their own devices and as companies transitioned to the cloud. This is because there was no longer a perimeter. Today there are on-site employees, off-site contractors, hybrid cloud environments, software-as-a-service applications, bring-your-own-device users, UNIX, Windows, Mac, iOS, Android – and soon there will be billions of machine-to-machine connections (internet of things) communicating through APIs. 

Okta is an independent IAM provider that allows customers to integrate with any application or scalable platform. Because Okta is best-in-breed, the company can win over Chief Security Officers (CISOs) that want flexibility and who want to avoid vendor lock-in (i.e., Microsoft). IAM allows access to critical assets, ad not only are switching costs high but CISOs will want a vendor that lets them sleep well at night.

The solution Workforce Identity comprises the majority of the business and simplifies the way an organization’s employees, contractors and partners connect to applications and data from any device (as discussed above). You can think of these as internal employee uses. New Products from Okta include FastPass, which allows for password-less login across multiple devices.

The Customer Identity Cloud enables organizations to transform their own customer’s experience making use of API-level access and seamless customer experiences. This is more external. Dynamic Scale helps enterprises handle traffic bursts up to 500,000 authentications per minute.

Here are the six technologies that IAM comprehensively covers:

  • API security: Allows for single sign-on (SSO) access for B2B ecommerce and API integrations.
  • Customer identity and access management (CIAM) enables organizations to capture and manage customer identity and profile data
  • Identity Analytics (IA) creates risk profiles for user behaviors and manages risk profiles.
  • Identity-as-a-Service (IDaaS) provides single-sign on and identity management as a software service
  • Identity Management Governance (IMG): Helps to minimize risk of data breaches and improves end user productivity
  • Risk-based authentication (RBA): Allow for variation of single-sign on and two-factor authentication

The Auth0 Acquisition

Okta closed on the Auth0 acquisition in May for $6.5 billion.

Auth0 is in the Identity-as-a-Service space (IDaaS) and offers an identity platform suite that supports single sign-on (SSO) through a centralized authentication server. To illustrate, you use single sign-on when you use the same username and password for the I/O Fund website as the I/O Fund forum. It allows you to be authenticated securely through an API.

The company is able to detect password compromises in real-time by checking against a database of hundreds of millions of breached credentials. The compromised user is then notified by email or text and Auth0 can restrict access until the password is reset. The API authentications are integrated with Microsoft Azure, Facebook, Twitter, WordPress, GitHub and Paypal.

Although there are many competitors in the startup scene, Auth0 can claim it’s prevented millions of malicious attempts with up to 1 billion transactions every day and 4 billion logins per month.

The dashboard for administrators offers control over user account provisioning and deletion, and offers full visibility into history and logs. Auth0 also offers personalized user targeting that enables control over features like social logins and multi-factor authentication. There is also automation through rule builders.

Auth0 and Okta are competitors in the customer identity space and are typically both evaluated by customers. The result will be better pricing power and a stronger product when going up against Microsoft on IAM. Okta’s primary source of revenue has been Workforce Identity. Auth0 acquisition will help strengthen the Customer Identity segment and will diversify Okta across both markets for IAM.

Here's how the two work together. What’s being illustrated is that the Workplace Identity often leads to a cross-sell on Customer Identity with lifetime spend of $17 million.

 Source: Investor Presentation

The last private valuation for Auth0 was $1.9 billion when the company raised a $120 million round. The round was led by Salesforce Ventures likely for the Customer 360 product that Salesforce has, which enables a universal identity and first-party data collection through the sign-on process. From there, audiences can be segmented and personalized experiences can be created (similar to our Twilio discussion on Segment). It would make sense that Okta acquired Auth0 to prevent Salesforce from competing with Okta.

Auth0 is a developer-centric company, similar to Twilio. The company has won over developers with its easy-to-use drop-in identity management solution for authentication APIs. The issue with Okta not being developer-centric and competing more at the Microsoft level is that developers prefer to work with companies that offer more support for the SMB-level. The Auth0 acquisition helps with this quite a bit. Okta is more of a sales-driven culture for the enterprise than a developer-centric focus.

Okta has stated they’d like to court developers for advanced use cases, such as the use of biometrics for authentication. Not only is the use of biometrics very complex but it needs to be properly implemented by developers. The top-down approach Okta uses is not well suited for this, yet the bottoms-up approach from Auth0 is well suited.

Financials

Okta is a $1 billion run rate company with the most recent quarter posting $251 million in revenue. This represents an increase of 37% year-over-year. The remaining performance obligations (RPO) was $1.89 billion, for an increase of 52%, with current RPO expected to be recognized this year up 45% compared to the year-ago quarter. Most bullish analysis will focus on RPO growth.

The adjusted earnings the company reported was EPS of ($0.10) compared to ($0.06) in the year-ago quarter. The bearish side to Okta is the ongoing lack of profitability. The company’s losses are increasing in terms of percentage of revenue on a GAAP basis from 36% to 29% of total revenue. On an adjusted basis, the operating losses were 6% of total revenue, a slight improvement from 7% last year.

This is a graph from Okta’s Investor Presentation helps demonstrate the regress:

These losses steepen with the Auth0 acquisition with adjusted EPS for next quarter of ($0.36) to ($0.35) and for fiscal year 2022 of ($1.16) to ($1.13). Forward guidance includes the Auth0 acquisition with total revenue of $295 million to $297 million, or 47% to 48% year-over-year. Last fiscal year, the adjusted EPS was $0.11

To be fair, the free cash flow margin is at 21% and this has improved. The company has $2.5 billion in cash and cash equivalents. This helps the company to satisfy the Rule of 40, which helps to sift through the many key metrics in the cloud and SaaS vertical to establish what companies have a healthy top line combined with a healthy bottom line. There is a great write-up here from Scale Ventures who has specialized in cloud startups for twenty years. They discuss why this is an important rule for public companies. Here’s an excerpt:

The Rule of 40 states that, at scale, a company's revenue growth rate plus profitability margin should be equal to or greater than 40%. SaaS management teams are often driving towards either rapid growth or increased profitability, and the Rule of 40 has become a construct for framing the balance of these two phenomena. Given that increased investment (whether from external or internal sources) is usually required to drive growth, rapid expansion and strong profitability are usually at odds with each other, and finding the right mix between the two can be tricky. a company's revenue growth rate plus profitability margin should be equal to or greater than 40%. SaaS management teams are often driving towards either rapid growth or increased profitability, and the Rule of 40 has become a construct for framing the balance of these two phenomena. Given that increased investment (whether from external or internal sources) is usually required to drive growth, rapid expansion and strong profitability are usually at odds with each other, and finding the right mix between the two can be tricky. 

One of the more interesting slides from Okta’s Auth0 Investor Presentation is the chart showing the 2018 Cohort’s Contribution Margin:

My only concern with the above chart is that Okta has been in business for about twelve years, and therefore, there should be at least ten cohorts with high contribution margins yet the company is still unprofitable.

The company is forecasting a minimum of 35% growth each year through 2026 for revenue of $4 billion. The key drivers will be Customer Identity segment with Auth0, growth in the enterprise customer base, expanding partnerships and international expansion.

We will be keeping Okta on our radar for any re-acceleration in revenue or increased forward guidance as the 35% minimum growth is a solid baseline.

With Auth0, the company is now guiding for fiscal year growth of 45% to 47% year-over-year. There was some criticism from an analyst on the earnings call because Okta did not break up the organic growth in the guidance. The losses are expected to be in the range of adjusted EPS ($1.16) to ($1.13).

Addressable Markets and Valuations

Auth0 was valued at $1.9 billion last July and Okta is paying $6.5 billion, or a 350% increase. The all-stock deal dilutes shareholders by 20%. Notably, Auth0 will be issued shares at $276.21

Okta is known for being downgraded due to valuation concerns. Despite the company having average performance during the 2020 due to Covid, it’s still in the top 10 on forward P/S. By average performance, the 40% range was overshadowed by many other cloud stocks seeing outsized performance. The digital transformation did not show up for Okta in a big way.

Sometimes you can squeeze out a 40 forward P/S but that doesn’t leave too much room in Okta’s current valuation. We will need to see more post-acquisition as we don’t want to front run this right now. If it was in the 20s, we likely would bite.

In the most recent earnings report, Okta stated the identity’s market addressable market was at $80 billion. If we break this down, we find the identity access management (IAM) market was at $12.3 billion in 2020 and will reach $24.1 billion by 2025 for a CAGR of 14.5% during the forecast period of 2021 to 2025. There is another forecast of 13.2% CAGR for IAM between 2018 and 2026 from $9.5 billion to $24.76 billion.

According to Okta in the most recent earnings call, customer identity TAM is $30 billion.

Of the key markets, health care is expected to be the fastest growing market driven by the need to prevent unauthorized users from accessing patient information. Healthcare organizations experience 5 times more attacks than financial institutions.

Asia Pacific is the region expected to drive the most growth with North America holding the largest share.

Conclusion:

Okta is firmly back on radar. What we want to see from this company is increased guidance following the Auth0 acquisition. The baseline of 35% forward growth is an excellent baseline to work from as any increase from here will help the stock quite a bit. There is strategic value to diversification and cross-selling in your customer base. For Okta, the acquisition adds developers plus strengthens their fastest growing segment (customer identity).

For now, the company get honorable mention, and if we see the right set-up, we will take it, but only if we see the right setup. Taking the number two position on 1-year and 2-year forward is a key reason as to why Okta is back on our radar. To be candid, the bottom line is a bit ugly for a company this age and at these growth levels (i.e., not hyper growth), so let’s see if the cross-selling improves this.
Posted in Application Monitoring, Cloud Infrastructure, Cloud Software, Productivity, Stock Updates (Blogs)Leave a Comment on H2 2021 Cloud Report: Winners Keep Winning, Plus Okta & Auth0

Asana Setup (5/20/21) – up 85% in a month

Posted on July 1, 2021June 30, 2026 by io-fund
Asana Setup (5/20/21) – up 85% in a month

Asana is the best performing cloud stock this year. The I/O Fund discusses how they identified this opportunity by using a blend of fundamentals and technicals to remain with the stock through the growth selloff. I/O Fund also added to the position in May for an 85% gain in under a month.

In February, the I/O Fund entered Asana (ASAN) and we held this position through the growth rotation, On May 20, we added to Asana (at $33.25) as a momentum play and held a webinar explaining our entry.

  • It was confirmed that Asana was outlining a common uptrend pattern that we see with tech growth.
  • Others, such as Roku, Datadog, Nvidia (overlapping uptrends), have followed this pattern as well.
  • We saw some significant bullish patterns within the volume, which typically leads a breakout. We were getting evidence that “smart money” was accumulating shares at these levels.
  • On top of our entry at $33.25, and identifying another buying opportunity at $34.50, we alerted subscribers that a breakout above the all-time high ($44.00) would also be a good entry point.

On June 18, we trimmed a third of our Asana position at $55, since our first target was met. That’s a solid 65% return in under a month.

Knox Ridley is the Portfolio Manager of I/O Fund. He uses a blend of technical analysis and risk management to achieve some of the best returns on Wall Street. He holds weekly webinars to discuss his trades setups. When he enters and exits stocks, he also sends real-time trade notifications to subscribers on the premium site.some of the best returns on Wall Street. He holds weekly webinars to discuss his trades setups. When he enters and exits stocks, he also sends real-time trade notifications to subscribers on the premium site.

Posted in Cloud Software, ProductivityLeave a Comment on Asana Setup (5/20/21) – up 85% in a month

Fiverr Q1 Update

Posted on May 13, 2021June 30, 2026 by io-fund

I covered Fiverr here in November 2020 as part of our free newsletter.  In this report, I made the case that the trends we were seeing from Fiverr were not dependent on Covid, but rather accelerated by the pandemic. 

I argued that these trends would be sustained post-pandemic and that the shift to a more remote and flexible workforce was permanent, especially in younger generations.  Six months later, lockdowns have eased amidst the vaccination rollout, but we continue to see positive momentum in Fiverr’s platform.

I/O Fund is looking for signs of high-level business performance among indiscriminate selling in growth tech. When the value rotation ends, I believe FVRR is one of the stocks poised to benefit most. Moving forward, FVRR is unlikely to see triple digit revenue growth again. However, consensus projections show 40% revenue CAGR over the next three years, with tremendous growth on the bottom line as the company improves profitability. 

Below I examine Q1 results and guidance, evidence of increased usage and engagement of the platform, and valuation.

Q1 Results and 2021 Guidance      

Fiverr announced Q1 results on May 6, comfortably beating top and bottom line estimates while also raising guidance.  Revenue came in at $68.3M in the quarter, representing an acceleration to 100% YoY growth.  Non-GAAP EPS of -$0.01 beat by $0.10, while adjusted EBITDA improved to ($0.7M) compared to ($2.9M) in Q1 ‘20. 

Active buyers grew 56% YoY to 3.8M, an acceleration from the 45% growth rate Fiverr announced last quarter.  Spend per buyer came in at $216, representing 22% YoY growth.  Take rate improved 10 basis points YoY to 27.2%, while the company also announced an impressive 84.1% gross margin. 

Fiverr guided for $74M in revenue for Q2 (+57% YoY) and positive EBITDA of $6M.  For the FY 2021, Fiverr raised revenue guidance to $305M at the midpoint.  The company is now expecting YoY revenue growth of 61% in 2021 versus previous guidance for a 48% YoY growth rate.  The FY outlook came in 6% above consensus estimates.  Management also guided for positive adjusted EBITDA of $22M at the midpoint, representing 142% full year EBITDA growth. 

Continued Momentum

In the company’s Shareholder Letter, Fiverr management talked about its expectation for continued strength and an elevated spend level that will be sustained well into the future.  The platform saw its most ever monthly app downloads in March 2021, reaching 215,000 downloads from US app stores (+57% YoY).  US monthly active users grew 40% YoY in March 2021, representing Fiverr’s highest ever monthly growth rate.

The Fiverr app is currently ranked 31st in “Business” on Apple’s app store and 22nd on Google Play.  When I covered Fiverr on November 20, 2020, the app had a ranking of 39th in “Business” on Apple’s app store and 26th on Google Play.  This data indicates that we are seeing continued strength from Fiverr’s platform into mid-May, even as over 32% of the US population is now fully vaccinated and over 45% of the population has received at least one dose.       

We continue to see evidence that Fiverr’s platform is performing better than ever as lockdowns ease.  Global internet and engagement trends from Alexa show Fiverr’s site currently ranks 139th in traffic and engagement over the past 90 days.   


Source: Alexa

Fiverr’s ranking has improved 79 spots from mid-February, and is currently sitting at peak traffic levels.   

Over the last 6 months, total visits to Fiverr have trended upwards and the platform is currently near peak levels with 60.6M average daily visits (+3% from 11/20).  Fiverr ranks 530th globally in total visits according to SimilarWeb.    

Source: SimilarWeb   

In comparison to my coverage of Fiverr in November 2020, we continue to see evidence of increased usage and engagement.  The trends towards adaptation of remote work and shifting businesses online are examples of lasting changes brought about by the Covid-19 pandemic.  A key component of the “New Economy” includes more remote and flexible work, where Fiverr continues to show it will be a key beneficiary.

Valuation

FVRR stock has historically commanded a premium valuation as the company has an exceptional revenue growth rate, 84.1% gross margins, and is already profitable on the bottom line.  FVRR stock currently trades at 16.0x EV/NTM revenue after reaching a peak valuation of above 40x EV/NTM revenue in early 2021. 

The sell off in high multiple stocks has hit FVRR hard and the stock is over 50% off all-time-high prices of $336.  16.0x EV/NTM revenue is the lowest forward valuation FVRR stock has traded at in the last 9 months.     

Conclusion

We are unlikely to see a triple digit revenue growth rate again from Fiverr as the company now faces tougher comps. But consensus projections show expectations of 62% YoY growth in 2021 and a 40% revenue CAGR over the next 3 years.  Analysts are also expecting tremendous growth on the bottom line as Fiverr ramps up profitability, with consensus projections for EPS of $2.09 in FY 2023 compared to the $0.29 FY 2020 EPS Fiverr just announced.        

When the value rotation eventually ends and we see a rotation back to high growth tech stocks, FVRR is one of the stocks poised to benefit the most.  We are looking for signs of high-level business performance during the indiscriminate selling in tech, and Fiverr continues to show why its business is performing better than ever. 

Disclosure: I am long FVRR; I/O Fund is long FVRR

Posted in Cloud Software, Productivity, Stock Updates (Blogs)Leave a Comment on Fiverr Q1 Update

Zoom Video Stock: Will History Repeat?

Posted on April 9, 2021June 30, 2026 by io-fund
Zoom Video Stock: Will History Repeat?

This article was originally published on Forbes on April 9, 2021, 12:35am EDToriginally published on Forbes on April 9, 2021, 12:35am EDT

Last year, I called Zoom Video a “pegasus” because the company stood out from the dime-a-dozen unicorns that have come out of Silicon Valley. Zoom has illustrated rare financial strength from its IPO through today due to exceptional product-market fit.

The term unicorn was first used to describe a startup with a valuation of a billion dollars or more. There have been hundreds of unicorns since the term was coined by Ailene Lee of Cowboy Ventures. However, there has been only one tech company on the public markets that has illustrated the financial strength that Zoom Video has in both its top line and bottom line.

Critics will say Zoom required Covid to generate these numbers, yet one look at the S-1 filing immediately disproves this theory. The market is overlooking Zoom’s long history of category-leading growth, which is discussed in detail below.

In the analysis, I also elucidate my thoughts on “exceptional product-market fit” and Zoom’s product strength pre-covid, during covid, and what the company will do to double its TAM in the coming year.

Please also note, per the analysis below, the I/O Fund has closed its position in Bandwidth and allocated more to Zoom. I explain why Bandwidth remains a solid choice yet we see more upside in Zoom due to the company’s sub-Top 20 valuation.

During the September 2019 selloff in cloud, which saw 40% to 50% drawdowns in many solid cloud names, I made sure to hammer on my thesis that cloud is a secular trend insulated from geopolitical risks and economic drawdowns. My thesis was proven correct by Covid as cloud software performs well in extreme economic climates because it reduces costs when budgets are constrained, and increases productivity, which is important during times of economic expansion.

This year is very unique for cloud software because many stocks are guiding for less than 40% revenue growth. We are not surprised to see lower valuations following the Q4 earnings reports as the market holds its breath to see how cloud will perform following tough comps from Covid. The Q1 reports are necessary to shed light on what companies will be the leaders coming out of the unusual year of 2020.

There is only one way forward for SMBs and enterprises — adopting cloud IaaS, platforms, and software. Traditional IT is expensive and will only hinder a company from taking advantage of AI and 5G. Competitively it can be very harmful to not transition to cloud right now, as I’ve emphasized in my past reports.

My overarching thesis about cloud software’s resiliency extends to other names, yet this analysis focuses on Zoom Video as it’s one the strongest stocks on the market in terms of its historic top line growth, strong margins, incredible free cash flow and growing profitability. I believe the market is making a mistake by dropping Zoom from the top 20 for cloud software valuations. Zoom is and lay out the reasons below.

Zoom is more than Web Conferencing

The market’s biggest misperception about Zoom is that it’s a web conferencing app. The company is more than two years into developing products and services that broaden its use beyond web conferencing with Zoom Phone launching in January of 2019, yet the market has priced Zoom for only one path (web conferencing). The company has since launched Zoom Rooms, a virtual marketplace Zoom Apps, and OnZoom. The company coined the term hardware-as-a-service because Zoom expects to disrupt nearly every area of telephony.

Last August, I pointed out that Zoom’s hardware-as-a-service products allowed companies to replace legacy systems by consolidating software and hardware for one consistent experience. ServiceNow made headlines last year when they chose Zoom Phone to replace their business phone lines by stating, “Going forward, with the addition of Zoom Phone, we’re getting a head start on an even more robust experience with Zoom — one-touch communication and collaboration features, plus Zoom-connected conference rooms.”

Zoom’s partner program saw significant expansion in 2020. Partner sales bookings increased more than 7x year-over-year. Over 20% of international business bookings in the past quarter were driven by Zoom’s partner ecosystem, and Zoom’s Master Agent business was the fastest growing in history for Master Agents AVANT and Intelisys.

Notable partnerships include carriers such as British Telecom, Lumen Technologies, and Orange Business Services. Zoom’s Distributor Partner Program includes Carahsoft Technology Corp. in the U.S., Nuvias Unified Communications in Europe, eLink Distribution AG in DACH, West Telco in LATAM and EMEA, SYNNEX/Westcon in LATAM, SB C&S in Japan, and FVC in the Middle East and Africa.

Master agents AVANT Communications and Intelisys, a ScanSource company, both reached $1 million in monthly recurring revenue (MRR) prior to the one-year anniversary of their partnerships with Zoom. Zoom also added six new Master Agent partners: AppSmart, Bridgepointe, eLink Distribution, PlanetOne, Sandler Partners, and Telecom Consulting Group (TCG).

Last year, Zoom saw growth of use cases in telemedicine, virtual events, and health and fitness after revamping its partnership program for independent software developers. The company supports more than 200 partners through its open API and SDK and expects to see further growth as new industries and markets are developed on top of Zoom.

Zoom also recently announced a multi-year partnership with Formula One, following a successful collaboration in 2020 on the Virtual Paddock Club, which offers VIP sports experiences. As part of the expanded partnership agreement, Zoom is working with Formula 1 to deliver unified communications and new business and hospitality experiences for on-site and virtual guests, including live updates from “legends of the paddock” and Paddock Club Business Lounges set up in Zoom Rooms.

Forward CAGR & Product-Market Fit

The analyst estimates for Zoom are 29.8% CAGR over the next three years through fiscal 2024. This makes little sense as the company has had a net retention rate of 130% over eleven consecutive quarters. This means analysts are essentially guiding for an increase in churn/downgrades and these projections assume Zoom will not add any new customers.

Zoom revenue estimate trends graph

The analyst estimates for Zoom are 29.8% CAGR over the next three years through fiscal 2024. I/O FUND

As stated, management from cloud software companies are not giving analysts much for forward guidance as it’s better to play this transitional period safe. Regardless, the projections don’t match Zoom’s incredibly strong track record.

First, there is no other cloud software stock that has made the leap from enterprise to consumer. Zoom was the top app by number of customers and unique active users this past year. Yet, it is also the preferred enterprise video conferencing app and ranked among the most popular workplace apps overall, according to Okta’s 2021 Business Network Report.

We see further evidence of Zoom’s customer approval across both consumer and enterprise as the security concerns last year were quickly forgiven as the management moved quickly to respond. In Q4, Zoom Phone was the fastest growing product line quarter-over-quarter. During the most recent earnings call, Zoom announced expansions into Zoom Phone by Zoom Meetings customers Equinox, Universal Music Group, and University of Southern California. The company expects strong growth for Zoom Phone going forward with a strategy of selling into the existing install base.

For product-market fit, you need the top line to grow rapidly and for the bottom line to strengthen. This is not the only indication but it simplifies the many variables. Before I go over the recent financials, I want to emphasize that Zoom was already outperforming its category per the S-1 filing that I covered in April of 2019.

The chart below provided by Alex Clayton of Spark Capital shows how Zoom compares to other cloud software companies that had a subscription revenue run-rate of $100M in their disclosure period with the graph indexed to the quarter where they crossed $100M.

Cloud softwares subscription revenue run-rate

Not only was Zoom the fastest growing cloud software IPO from $100 million onward in terms of run rate but also grew 108% in their last quarter YoY compared to a median of 38% in 2018 for the companies pictured above. ALEX CLAYTON OF SPARK CAPITAL

Source: Alex Clayton, Spark Capital

Not only was Zoom the fastest growing cloud software IPO from $100 million onward in terms of run rate but also grew 108% in their last quarter YoY compared to a median of 38% in 2018 for the companies pictured above. Zoom was also the most efficient in terms of customer acquisition cost, with a median payback period of 9 months compared to the median of 30 months.

Below is how Zoom stacked up to other popular cloud software stocks at its IPO:

Cloud software revenue growth at IPO

How Zoom stacked up to other popular cloud software stocks at its IPO. I/O FUND

There’s a catch to the graph illustrated above — Snowflake was only 6 years post-launch while Zoom was 8 years post-launch. Therefore, when we adjust growth rates for age of company, we see Zoom is the #1 company in terms of financial strength in cloud software:

cloud software revenue growth in years

We see Zoom is the #1 company in terms of financial strength in cloud software. I/O FUND

There’s more … Zoom was profitable at the time of IPO while the majority of cloud software companies are not profitable many years after their IPO. Not only is Zoom the strongest IPO in cloud’s history but it was also profitable. Not one other company was profitable at IPO … and only Shopify is profitable now from the list although this occurred many years after Zoom if we adjust for age of company.

Hopefully, this helps the critics see that Zoom has always been best in its class — and cloud software is not an easy category to lead with top performers such as CrowdStrike, Snowflake, Shopify and Slack (a very sticky product) coming from this category.

Doubling TAM

Founded in 2011, Zoom previously described itself as a leader in modern enterprise video communications. The CEO states that Zoom is enabling greater effectiveness in human-to-human interactions over a distance with use cases that are not possible with legacy systems. The key words here are “not possible with legacy systems.”

Zoom’s ongoing goal will be to disrupt all legacy systems with cloud-native communications — and this means every possible method of communication that is not currently done on the cloud and/or is currently on the cloud but is too cumbersome of a process due to walled gardens.

According to Gartner, by 2022, 65% of meeting solutions users will take advantage of SIP/VoIP-based audio-conferencing tools. This is up from 20% in 2017, while 40% of meetings will be facilitated by virtual concierges and advanced analytics. Here we see Gartner had already predicted audio-conferencing to grow substantially prior to Covid.

The global web conferencing market is expected to grow from $12.58B in 2020 to $19.02B by 2025, at a CAGR of 8.6%, according to Valuates, which offers market research reports.

web conferencing market size

The global web conferencing market is expected to grow from $12.58B in 2020 to $19.02B by 2025, at a CAGR of 8.6%, according to Valuates, which offers market research reports. VALUATES REPORTS

The exact size for the video communications market varies considerably depending on the source. This is because the market is very new. According to research from Markets and Markets, the video communications market is expected to grow an average of 8% per year to nearly $20 billion by 2023, with another report expecting that the industry will register a CAGR of 9.2% from 2018 to 2025. However, IDC pegs Zoom’s future addressable market much higher at $43 billion, as cited in a previous Zoom earnings call.

If we go with the more modest addressable market size of $20 billion, then Zoom Phone will double TAM as telephony is forecast to grow to $23 billion by 2024, per the Q4 fiscal 2021 report. While doubling TAM, Zoom Phone was the company’s fastest-growing product line quarter-over-quarter, according to the report, and executives expect to see strong growth in FY2022.

Some analysts claim the domestic market is close to saturation, and Zoom will have to look for more opportunities in overseas markets. This is unlikely as communications is both account based and usage based, not to mention hybrid work-from-home is the consensus among surveys of executives with only 29% stating the office will return to five days in the office per week.

Zoom sees international expansion as a major opportunity. In the first-quarter fiscal 2020, APAC and EMEA revenue grew a combined 127% year-over-year. As such, Zoom plans to add local sales support in further select international markets over time and also use strategic partners and resellers to sell in international markets.

Revenue from APAC and EMEA collectively represented about 20% of Zoom’s revenue for the quarter and management noted that it could be the beginning of a sizable opportunity to bring the Zoom platform to other regions.

Why Zoom Went Viral and Will Again …

The agnosticism of Zoom compared to Google and Microsoft means the company has the opposite goal of big tech: rather than lock users into a walled garden, Zoom created a flawless and viral mechanism where users can share web and audio-conferencing links without needing to login. Zoom exploited big tech’s weakness — the walled garden — which requires logins and a cumbersome user workflow.

Many critics think the catalyst for the virality was Covid, yet my premium site had stated this mechanism was a viral feature many months prior to the pandemic. “Viral mechanic” means the spread of growth across users as a built-in mechanism to the product. The first Zoom user in an office naturally evangelizes the product by inviting more people to a conference with a simple link. The users who are invited do not need to sign up for Zoom, and the experience is much better than other conferencing solutions that require many steps to join a conference and are not in HD.

The best growth in tech products occurs when the product multiplies across users exponentially. This is why social media reported incredible growth — one user invites many users to the platform with a simple link. Zoom is an example of the “sum of its parts is greater than the whole.” Its success is based off many micro improvements to video conferencing that adds up to a serious advantage over the competitors.

Cisco was the main competitor that Zoom disrupted as CEO Eric Yuan was a former engineer at WebEx before it was acquired by Cisco. Zoom has a “bottoms-up” viral customer base, which means junior employees evangelize the service at the company. These are often some of the most loyal customers. For instance, 55% of $100,000 or higher revenue customers were started with a single employee’s free trial. This is an important insight to the traction of the product.

Zoom’s virality with web conferencing is important because I expect the same team (and for the same reasons) to create a frictionless and viral method to replace all forms of legacy communications.

Zoom’s Current Quarter & Forward Growth

In most recent quarter, Zoom reported Q4 revenue of $882.5M, representing growth of 369% YoY, beating expectations by $71.54M. Non-GAAP EPS of $1.22 beat by $0.43 and GAAP EPS of $0.87 beat by $0.39.

GAAP income from operations was $256.1M, up 2327% year-over-year. Non-GAAP income from operations was $360.9M, up 839% YoY.

For the full year, total revenue was $2,651.4 million, up 326% year-over-year. GAAP income from operations for the fiscal year was $659.8M, compared to GAAP income from operations of $12.7 million for fiscal year 2020. GAAP operating margin was 24.9% and adjusted operating margin was 37.1%.

Please note, when you see this level of bottom-line growth, it means Zoom is spreading organically and not needing to pay for its growth. This is extremely rare in Silicon Valley and other tech startup hotbeds, as growth marketing is a tactic used to grow the top line at the expense of the bottom line.

Remaining performance obligation was up 189% year-over-year from $604 million to $1.75 billion with the company expecting to realize 70% of this amount in the upcoming year. This means before the fiscal year even began, the company will already have $1.22 billion of revenue in the pipeline of the $3.7 billion projected for the year.

growing future revenue under contract

Remaining performance obligation was up 189% year-over-year from $604 million to $1.75 billion with the company expecting to realize 70% of this amount in the upcoming year. ZOOM

Non-GAAP net income for the fiscal year was $995.7M, after adjusting for stock-based compensation expense and related payroll taxes, expenses related to charitable donation of common stock, acquisition-related expenses, and undistributed earnings attributable to participating securities. Non-GAAP net income per share was $3.34. Non-GAAP net income was $101.3 million, or $0.35 per share.

Net cash provided by operating activities was $1,471.2M for the fiscal year, compared to $151.9M last year. Free cash flow, which is net cash provided by operating activities less purchases of property and equipment, was $1,391.2 million, compared to $113.8 million last year.

Zoom provided the following guidance for fiscal year 2022:

· Total revenue for Q1 is expected to be between $900.0M and $905.0M vs $835.35M consensus

· Non-GAAP income from operations is expected to be between $295.0M and $300.0M.

· Non-GAAP diluted EPS is expected to be $0.96 at the midpoint versus $0.70 consensus

For the full year, total revenue is expected to be $3.770B versus $3.5 consensus, representing growth of approximately 30% YoY, and non-GAAP income from operations is expected to be between $1.125B and $1.145B.

Full fiscal year non-GAAP diluted EPS is expected to be between $3.59 and $3.65 versus $2.96 consensus, with approximately 311 million non-GAAP weighted average shares outstanding.

In the last three months, 20 analysts set 12-month price targets for Zoom, according to data from E*Trade. The average price target was $472.41, with a low of $360 and a high of $610 representing 98% upside from the current price.

Finally, it’s worth mentioning that the Zoom app is still #1 on the business charts in the App Store.

At the end of first-quarter fiscal 2020, the company had roughly 58,500 customers (with more than 10 employees), up 86% year over year. Zoom has a strong partner base that includes companies such as Salesforce, and these partnerships will be instrumental in future growth. Zoom ended the last fiscal year with more than 467,000 customers with more than 10 employees, up approx. 470% from the same quarter last fiscal year, according to the report.

Bandwidth

One reason we closed our position in Bandwidth is that we feel work-from-home should have been a bigger catalyst for Bandwidth, with major customers including Zoom, Google, Microsoft enterprise, Skype, RingCentral and Square. If there was ever a year that a Tier 1 provider should have seen rapid growth with these customers, last year would have been the year. Instead, for the full year 2020 we see Bandwidth with total revenue of $343.1M, up 48% YoY, versus Square (for example) which reported total net revenue of $9.50B, up 101% YoY for the full year 2020.

Bandwidth is a communications platform-as-a-service (CPaaS) company that offers voice, messaging and 911 APIs built on the company’s Tier 1 network. Although Bandwidth competes in a similar area as Twilio and Messagebird, the company is distinguished by owning its network and by offering competitive pricing and a stripped-down version of voice and SMS.

The company works with the very largest VoIP and video/audio conferencing companies including Google, Microsoft, Skype, Zoom and Ring Central. The work-from-home trend has benefited Bandwidth’s customers. There is a potential for another catalyst, which is the expansion into Europe. This is important as Europe in particular has proven to be a major market for VoIP due to various country codes in close proximity.

Bandwidth is overshadowed by competitors, including Twilio and Messagebird. Five9 is also in the adjacent space of the cloud contact center (top of the stack as a complete solution)

The difference between these companies is important to understand. Twilio enables communications for mobile applications, such as voice or text. When you text or make a call inside of a mobile application, you are likely using Twilio’s APIs. The company works with over 1,000 mobile carriers in over 150 countries for voice and text/SMS services. The features that come pre-packaged with Twilio are ideal for companies who want to cut down on development time, such as startups or pureplay apps. Examples include customer service calls on Zendesk and messaging home owners inside the Airbnb app.

However, large companies in the video and phone conferencing space (including business apps), with a primary focus on communications, are unlikely to incorporate an expensive third-party for out-of-the box development. As a network carrier, Bandwidth undercuts Twilio on pricing with cheaper outgoing and incoming calls plus free incoming SMS. This option is entirely focused on voice and SMS while its customers develop any additional features in-house. Twilio costs $1 for a dedicated number while Bandwidth costs $0.35 per dedicated number. This is why Bandwidth is the network provider for Google, Microsoft enterprise apps and Skype, and also Zoom.

On the flip side, Bandwidth makes a fraction of a penny for every call or message that is sent over the Tier 1 network. Therefore, Bandwidth’s revenue is not up to par with Twilio’s at about $280 million compared to $1.5 billion.

The issue may be that what Bandwidth offers is more commoditized between the various telephone networks and also cellular. Therefore, the better investment may be in the full product stack, like what Zoom offers.

More on Bandwidth’s Financials …

Excluding the acquisition of Voxbone, which closed last quarter, Bandwidth’s standalone CPaaS Q4 YoY revenue growth was 53%. Tailwinds include political messaging and factors related to Covid-19. Political messaging and Covid-related usage contributed 19 points to the company’s Q4 YoY growth rate, according to the report.

Where dedicated, daily user behavior within enterprises around VoIP and cloud native conferencing apps may have been many years out, covid-19 has sped this up. The addressable market growth was estimated to be about $1.7 billion in 2017 to $6.7 billion in 2022 for this market. Yet, we think one issue with Bandwidth having lagging growth for this category is there was too much competition for Bandwidth to increase its market share.

The recent quarter was impressive with 82.3% revenue growth yet the previous quarters were in the 30–40% range. Despite these normal comps, the company is guiding for 58% growth year-over-year for the March quarter.

Within total revenue, CPaaS revenue was $98.1M, up 84% YoY. Other revenue contributed the remaining $14.9 million for the quarter. Other revenue was $8.6 million in the same period last year. Total, CPaaS, and Other Revenue include $17.5M, $16.6M and $0.9M respectively from Voxbone starting on Nov. 1, 2020, the date of the acquisition.

Adjusted gross profit was $55.8M, compared to $31.1M for Q4 2019. Adjusted gross margin was 49% compared to 50% for Q4 2019.

Adjusted net income was $3.5M, or $0.13 per share, based on 27.2 million weighted average diluted shares outstanding. This compares to a Non-GAAP net loss of $(0.5)M, or $(0.02) per share, based on 23.5 million weighted average shares outstanding for the fourth quarter of 2019. Adjusted EBITDA was $8.3M, compared to $1.2M in Q4 2019.

Total revenue for the full year of 2020 was $343.1M, up 48% year-over-year. Gross profit for the full year 2020 was $157.9M, compared to $107.6 million in 2019. Adjusted gross profit for the full year of 2020 was $169.1M, compared to $114.4M in 2019. Adjusted gross margin was 49% for the full year of 2020 and 2019.

In the last three months, five ranked analysts set 12-month price targets for Bandwidth, according to date from E*Trade. The average price target is $210, with a low of $200 and a high of $227 for an upside of approx. 95%.

On the bullish side, Canaccord Genuity raised its price target from $175 to $225 after Bandwidth’s acquisition of Voxbone, stating the purchase: “accelerates Bandwidth’s international expansion plans and creates a stronger position in the global $18B CPaaS market.”

JMP raised BAND from $180 to $206, favoring the deal “because it accelerates Bandwidth’s international expansion in a way that is accretive to its non-GAAP gross margins and non-GAAP net income.”

Conclusion:

Inertia matters with tech growth. The companies that grow rapidly tend to continue to do well long-term. Zoom has been dropped out of the top 20 in terms of valuation for the cloud software category and is now cheaper than before the pandemic, which led to some of the most remarkable earnings reports of any stocks we have covered. Due to the low valuation and the company having plans to double its TAM quickly, among other reasons, we have closed Bandwidth in favor of a larger position in Zoom.

Sign up for Analysis on the Best Tech Stocks

I’m an industry insider who writes free in-depth analysis on public tech companies. In the last 12 months, I predicted Facebook’s Q2 crash, Roku’s meteoric rise, Uber’s IPO flop, Zoom’s IPO success, Google’s revenue miss and more. Be industry-specific. Know more than the broader markets. Sign up now. I look forward to staying connected.

If you are a more serious investor, we have a premium service that offers institutional-level research and entry/exit options. This membership offers a competitive edge in identifying growth opportunities and reducing risk in the tech sector. Learn more here.premium service that offers institutional-level research and entry/exit options. This membership offers a competitive edge in identifying growth opportunities and reducing risk in the tech sector. Learn more hereLearn more here.

Join other tech investors who receive weekly stock tips:

Posted in Cloud Software, ProductivityLeave a Comment on Zoom Video Stock: Will History Repeat?

H1 2021 Cloud Software Update

Posted on February 17, 2021June 30, 2026 by io-fund

315fa45c-80d5-4932-b910-c1d1a6dbed9d_H1-2021-Cloud-Software-Update.pdf

H1 2021 Cloud Software Update

Don’t forget about cloud software!

In the excitement about SPACs and the flood of IPOs that have listed recently, it'd be easy to forget about the tried-and-true. 

Quick Note on the Current Climate … 

My main thesis about cloud has not changed: it's secular and insulated from geopolitical risks and economic drawdowns. Generally speaking, cloud software reduces costs for enterprises and SMBs. Therefore, the category is more insulated from economic drawdowns. You can read more about my views on cloud’s resiliency here. 

There's a caveat to this, which is that the market is flooded with cloud software solutions and tools – both in the public markets and private markets. This is because cloud software has a low barrier to entry. The costs to develop cloud software and go-to-market is very low compared to hardware or a solution that requires specialty engineers, like AI, ML, robotics, etcetera. Venture capitalists are drawn to cloud software because it's relatively cheap to create, and the margins are healthy due to recurring subscription revenue. 

The window of time that you have to be wary is between years 8 and years 12 for a software company. Prior to year 8, it's common for software and new tech startups to report rapid growth. VCs know this and are taking companies public sooner to capitalize off momentum traders (and trading machines), that indiscriminately pile into companies with high growth rates. 

In this case, a VC firm can see a very large exit and move onto another company while the public markets sort out the long-term growth rate and the company's ability to scale. Every startup looks strong at the beginning of the marathon but which ones endure past mile 13? VCs don't have to worry about this as the goal in today's market is to exit before the marathon is half-over.

The ramp-up period for startups is exciting because the product finds early adopters. Can the product sustain long-term after year 8 and continue to take market share? This is a much more complex question. Private investors exit before the long-term viability of a company surfaces and (us) public investors have to extrapolate the longerterm trajectory.  

Consider the fact that 9 out of 10 startups fail. If you’re a VC, you’re going to get the startup to the public markets as fast as possible to get your exit. If the company fails or the growth slows down, as it does for most tech startups, then it's of no importance as the exit was made. Because of this dynamic (that startups are essentially experiments) and there are many new SPACs bringing to market roughly 165 unvetted companies, I believe we will see a string of failures at the peril of public investors. According to these statistics, we could see 148 fail out of the 165, or on the low-end, 132 of the 165 fails. The low-end is the 80% failure rate for VC-backed companies indicated by the statistics. 

SPACs are not inherently wrong (and David pointed out a few benefits compared to IPOs). However, young companies fail very frequently and the public markets are becoming the exit grounds for pre-revenue companies. This piece is new and public investors aren’t prepared for the high failure rate that is a daily reality in the private markets. 

That’s a bit of a tangent to say we will continue to have plenty of exposure to cloud in our portfolio as a hedge against any high-fliers we take. The fact that cloud is out of favor in the market right now is not a concern to us because we know cloud has a resilient growth rate. 

We also want to communicate that we are well-diversified. We have exposure to SPACs and small caps, but we use cloud and semis as a safe haven. I think these comments will become more apparent as we move through the year. Basically, I am contrasting why cloud deserves attention right now despite the fact speculative trading in SPACs and Momentum has been in the driver’s seat.  

Regarding valuations — I've stressed this point with companies like Snowflake because we will see more of this as time goes on and investors need to be careful of merely providing exits for VCs at sky-high valuations. Being patient is an important tool in a retailer's arsenal when a valuation is high. 

Please keep in mind, that we discouraged readers from buying Zoom Video when trading in the forward P/S range of 50 despite owning this stock at a lower cost basis. Therefore, I am not singling out Snowflake but instead using it as an example to illustrate why we have not bought this excellent company as "growth at any price" can lockup your money for a few quarters while the financials catch up to the valuation. This is exactly what has happened with Zoom Video (it took a long breather) although the forward P/S is much more reasonable now.

Our Focus: Product-Market Fit and Valuations

For our portfolio, cloud is a hedge as valuations may fluctuate, but growth will march onward for the companies with product-market fit in this resilient category. The best illustration of product-market fit is Shopify and Zoom Video as both their top and bottom lines prove they are efficiently meeting market demand. 

An example of a company that I have picked on for not having product-market fit is Uber and Lyft as they must subsidize rides. The market price that customers will pay is lower than its operational costs. The market may still move the stock based on the promise of autonomous vehicles or robotaxis but today's financials do not suggest there is product-market fit. 

Opendoor has a similar issue. The financials are upside down as the more the company makes, the more the company loses, and this is inherent to the current business model (not a one-time event or the cost to scale). 

Opendoor was hoping to charge 10% in commissions which is about 4% more than Realtor fees for the convenience of buying the house in cash. The market will not pay this extra 4% and Opendoor is forced to match Realtors at 6% commissions. Like Uber, the price does not cover the operational costs. However, we are in a period of historic liquidity and QE. The market may pile in based off sentiment or other speculative reasons (we’ve entered this stock ourselves and it’s performed well), but the financials today do not show a company that has achieved product-market fit. 

You could argue Fubo does not have product-market fit as seen in the financials. The cost of licensing the content does not cover the cost of operations. So, why am I invested? Because this is the yearthe year for CTV ads and OTT live content so we think the trend is so early and so massive that we are comfortable taking a flier on this company. I’ve said before that OTT live sports is the holy grail and cable networks/media conglomerates will do what it takes to own this transition. There are many market forces at play here and Fubo is centered perfectly in the middle. Therefore, this is an investment in the trend of Live Sports OTT. 

Product-market fit is important to this discussion because finding the gems will protect us from any downside in the market. Even if the market temporarily sells-off in certain names, we can rest easy if we stick to quality. 

The best examples of product-market on the public markets are the FAANGs – where the top line defies the odds, and the bottom line continues to deliver. There are others in the $200B+ market cap range that illustrate this: Salesforce for CRM, Adobe for design and its developer moat, Nvidia for the CUDA platform and its developer moat, etc. Sticking with these companies through market ups and downs did well for early investors. 

Cloud investing was fairly predictable in the previous years because there were clear winners in terms of forward growth. Due to tougher comps, nearly half of all cloud stocks guide between 20% and 40% with very few above this range and priced dearly if they are (see the chart below).

The other factor we will be considering as we move into 2021 is valuation. There is a disconnect in a few names where the market has not been perfectly efficient. Below, we pull out a few names that have room and rely on Knox for any breakouts in valuation. 

As was posted on the forum last week, those with room in valuation include Bandwidth, Asana and Crowdstrike. We are also pleasantly surprised to see Kingsoft Cloud having quite a bit of room although some of this likely represents the risk in China. In the Macro section, you'll see that China's Cloud IaaS is set to take off with Alibaba surpassing Google Cloud for the number three spot. We think this foreshadowing growth for Kingsoft.

Macro Outlook:

The big takeaway from the cloud market going into 2021 is that hybrid work-from-home is here to stay. The market is pricing cloud productivity software as a temporary COVID tailwind but the analysis shows a permanent shift that will accelerate this year. 

According to IDC, the cloud market will grow at a CAGR of 15.7% through 2024 to become a $1 trillion market in 2024. This forecast includes software-as-a-service (SaaS), platform-as-a-service (PaaS), and infrastructure-as-aservice (IaaS). 

The research firm also states that by 2021, 90 percent of enterprises will be relying on a mix of onpremise/dedicated private clouds, multiple public clouds and legacy platforms. Therefore, IDC predicts this to be the year of multi-cloud, which we covered in our Microsoft earnings report write-up here. We see multi-cloud as the first step towards edge computing to where servers from various hyperscalers or CDNs work cooperatively to deploy 5G workloads. 

On a trailing basis, cloud spending grew from $183 billion in 2018 to $233.4 billion in 2019. This puts the $1 trillion prediction into context as IDC calls for roughly 400% growth over the next five years. In 2019, SaaS accounted for $148 billion, or about 64% of the public cloud market.   

SaaS dominating the IT spend for cloud is important because it means there will be many winners in this category as it marches onward to the $1 trillion mark.

According to IDC, more than half of the global revenue in the PaaS and IaaS markets was captured by AWS (33.6%) and Microsoft (18.0%) leaving 34.90% for the rest of the market. 

This is not the case with SaaS where the rest of the market captured 73.9% and the top two vendors, Salesforce and Microsoft, caught 7-8%. 

This is also important for perspective as smaller companies own the SaaS market while Big Tech dominates IaaS and PaaS. Therefore, there is a solid opportunity for investors in cloud software now and into the future. The graph below helps to visualize the opportunity for smaller players:

Source: IDC 2019 Report

According to Gartner, worldwide public cloud spending will grow 18% in 2021 to total $304.9 billion. Relative to overall IT spend, cloud still has a long runway and is projected to make up 14.2% of total global enterprise IT spend in 2024 compared to 9.1% in 2020. 

Gartner’s survey indicates that there is still quite a bit of growth ahead despite the harder comps the cloud software leaders face in 2021. The data shows that 70% of organizations using cloud services plan to increase their spending, stating “the proportion of IT spending that is being allocated to cloud will accelerate even further in the aftermath of the COVID-19 crisis.”  

The analyst firm points towards mobility, remote working and hybrid workforces as trends that will lead to further market growth. 

Source: Gartner CIO Survey

In the graph above, we see survey respondents and Gartner forecast an increase in work-from-home. Meanwhile, the market has been cautious about cloud software post-vaccine, which may be unwarranted with hybrid workforces. 

Here is what Gartner states, “For example, customers and citizens shifted their activity online during the lockdown, but that shift will increase, not reverse, in 2021.”

Forrester’s recent survey showed similar results with 47% of North American managers anticipating a permanently higher rate of full-time remote employees and 53% of employees wanting to work from home postpandemic. 

Although budgets will only increase 2% in 2021, according to Gartner, CIOs' top priorities are digital workplace technologies to support work-from-home, and then AI/ML, robotic process automation (RPA), distributed cloud and multi-experience platforms.

Forrester states 35% of companies will double down on workplace AI with one in four workers supported by automation either directly or indirectly by the end of 2021. B2B sellers will rely on AI and automation with predictions that 60% will rely on tools with these functionalities embedded.  

The analyst firm also states the hyperscale cloud market will “return to hypergrowth” of 35% to $120 billion in 2021. This is up from the original prediction that cloud IaaS would grow 28%. The analyst firm also predicts Alibaba will take the number three spot instead of Google Cloud. 

Adopting serverless apps and containers will continue to grow with increased demand for multi-cloud container development platforms and public-cloud container/serverless services. Forrester also believes a leading trend will be disaster recovery moving to the public cloud. 

Cloud Stocks for H1 2021

I wrote my first thematic PDF on cloud in December of 2019 during an intense cloud sell-off. The First Trust Cloud Computing ETF (SKYY) had posted 22% returns YTD at time of writing in December and closed the year with 24.55% returns for full-year 2019.

Last year, cloud performed much better due to its fundamental, secular strength during COVID with the SKYY ETF closing out with 57.41% returns in 2020. 

We covered many cloud names at their lows during Q3 and Q4 2019 due to our thesis that cloud is insulated and secular. At the time, we pointed out that cloud services were expected to grow 4.5 times more than the IT industry and that future growth through 2022 would be 3 times higher than IT (page 3 from this report).

I believe we are here again in a very similar spot. The market thinks cloud is going to be stunted and forward guidance isn't saying otherwise. However, the analyst firms are predicting we will accelerate and are raising forecasts. We will side with Gartner, IDC and Forrester who do a particularly great job in the cloud category. 

Prior to COVID, our thesis was this: “cloud software is more sheltered from overseas economies, supply chains, trade wars and shifting government policies” and “truly, there is few safer places to invest in technology if the trade war resumes or we see the recession that many economists are predicting.” 

My thesis this year is that work-from-home and hybrid work environments will be the new norm which will keep cloud growth steady and that AI and ML will be another catalyst. You simply can’t compete with AI and ML with on-premise servers and software. Edge computing and 5G is another accelerant for cloud IaaS, PaaS and software. 

Below are the top 35 cloud stocks listed by revenue growth that we consider to be in our universe. The top 10 are shaded in yellow. 

In a Motley Fool podcast, I had said that this would revert to about a 30 forward P/S and we are here now.


Some Conclusions:

•       Kingsoft Cloud has a compelling risk/reward ratio as the company will deliver Snowflake-level revenue at rock-bottom valuation.

•       Bandwidth has the ingredients to pass the pack of cloud stocks stuck in the sub-40% growth range. Let’s see if the company can do this – and if the valuation will finally match its potential. 

•       Asana is not in our top 10 due to competition across productivity tools, but we see room here in the valuation. This will be something Knox spearheads as he sees the right setup including this one from last week.

•       Crowdstrike and Zscaler are both leaders in revenue growth and EPS growth. 

•       Zoom Video and Shopify are both strongest in terms of a large base in EPS and we think the products will perform well in the face of tough comps this year. 

•       This year is very unique for cloud software because so many stocks are sub-40% growth and tightly ranked (see the chart above). We are not surprised to see mixed-reactions to the earnings reports as the market is holding its breath to see what the covid comps will be for the March quarter.  

•       We are not too concerned about the market taking a breather or responding to uncertainty. There is only one way forward for SMBs and enterprises (which is adopting cloud IaaS, platforms and software).

Traditional IT is expensive and will only hinder a company from taking advantage of AI and 5G. Competitively it can be very harmful to not transition to cloud right now as we've seen in my past reports citing McKinsey.

•       The last time I talked about cloud on the Motley Fool podcast, I thought valuation was a serious risk as we saw many names trading in the 50 forward P/S range whereas 30 forward P/S is the mean for highgrowers and 20 P/S is the mean for average growers. 

•       Now that we have reverted to the mean, we plan to allocate for cloud while the trend is out of favor. 

My Top 10:

We stand by Zoom Video and Shopify as the relationship between the top-line and the bottom-line proves product-market fit. We understand there will be harder comps this year but these companies are releasing new products to grow market share and continue to be centered in important trends. These were strong companies prior to COVID and we thnk they will be strong companies post-COVID.

Crowdstrike and Zscaler are stocks that David follows closely and are the best positioned cybersecurity companies to benefit from the growing security spending cycle.  The Covid-19 pandemic and the Sunburst hack uncovered a number of major gaps, highlighting the need for organizations to transform their legacy security architectures.  Credit Suisse’s recent CIO survey suggests that security spending is the top spending priority in 2021, even more so than in July.    

Kingsoft Cloud and Bandwidth are both undervalued in terms of forward-growth. China's cloud IaaS should be in the breakout year as Alibaba takes over Google Cloud as number three. Bandwidth is centered in the hardwareas-a-service trend, which may not be as exciting as EVs or SPACs but is essential to the digital transformation we've seen this past year and a hybrid work environment.

We could not be more bullish on Twilio’s long-term trajectory. The company has a moat in cloud communications for native apps and the management is taking on the omni-channel marketing to increase the addressable market. Should the management pull this off (and we think they will), then Twilio is setting up to be a leader in marketing and sales data with Adobe/Salesforce long-term potential.

Datadog has auspicious positioning for hybrid cloud and multi-cloud. The three analyst firms agree that the public cloud is going to accelerate this year and we want exposure. The market taking a breather does not affect our conviction and we think DDOG is the best way to participate in the growth of Azure, AWS and Google Cloud plus the trend towards multi-cloud (which also directly relates to edge computing).

Teladoc’s low forward P/S (comparatively) is a mystery as this is a mega-trend that will be unstoppable as artificial intelligence continues to merge with health care. We can't think of an industry more ripe for disruption as health care costs have risen 400% in the last decade while wages have stagnated. AI and genomics are able to cure terminal diseases, although TDOC is centered in the first problem (health care costs).

DocuSign is a steady performer with solid top-line and solid bottom-line growth. The market tends to overlook this one, but we like DocuSign as the primary choice for legal, real estate and financial industries. There is very little room for competitors as DocuSign delivers a superior product that can become the universal standard. We do not think the world will reverse to paper.

We continue to want exposure to telehealth and so have allocated to Amwell as an 11th position in cloud.

Posted in Cloud Software, Cybersecurity, Productivity, Stock Analysis PDFsLeave a Comment on H1 2021 Cloud Software Update

Beating Smart Money & Bloomberg Video

Posted on September 23, 2020June 30, 2026 by io-fund
Beating Smart Money & Bloomberg Video

I realize you have a choice in the newsletters you subscribe to and my way of saying thanks is to offer original analysis. Most newsletters will wait for breakouts and price momentum and then backfill the analysis. This creates a few issues from my perspective. The first is that conviction gets shaky when basing investments on price only as it requires a herd mentality to remain in a stock. The best gains come from getting in front of the herd. The second issue is that many tech companies go through periods of high growth yet can’t sustain this long-term unless there is excellent product market fit. Momentum investors and trend followers struggle most when it comes to FAANG-like gains because they can’t determine the true gems from those that are simply doing what most tech does (disrupt a market for a period of time).   

Case Study: Zoom Video

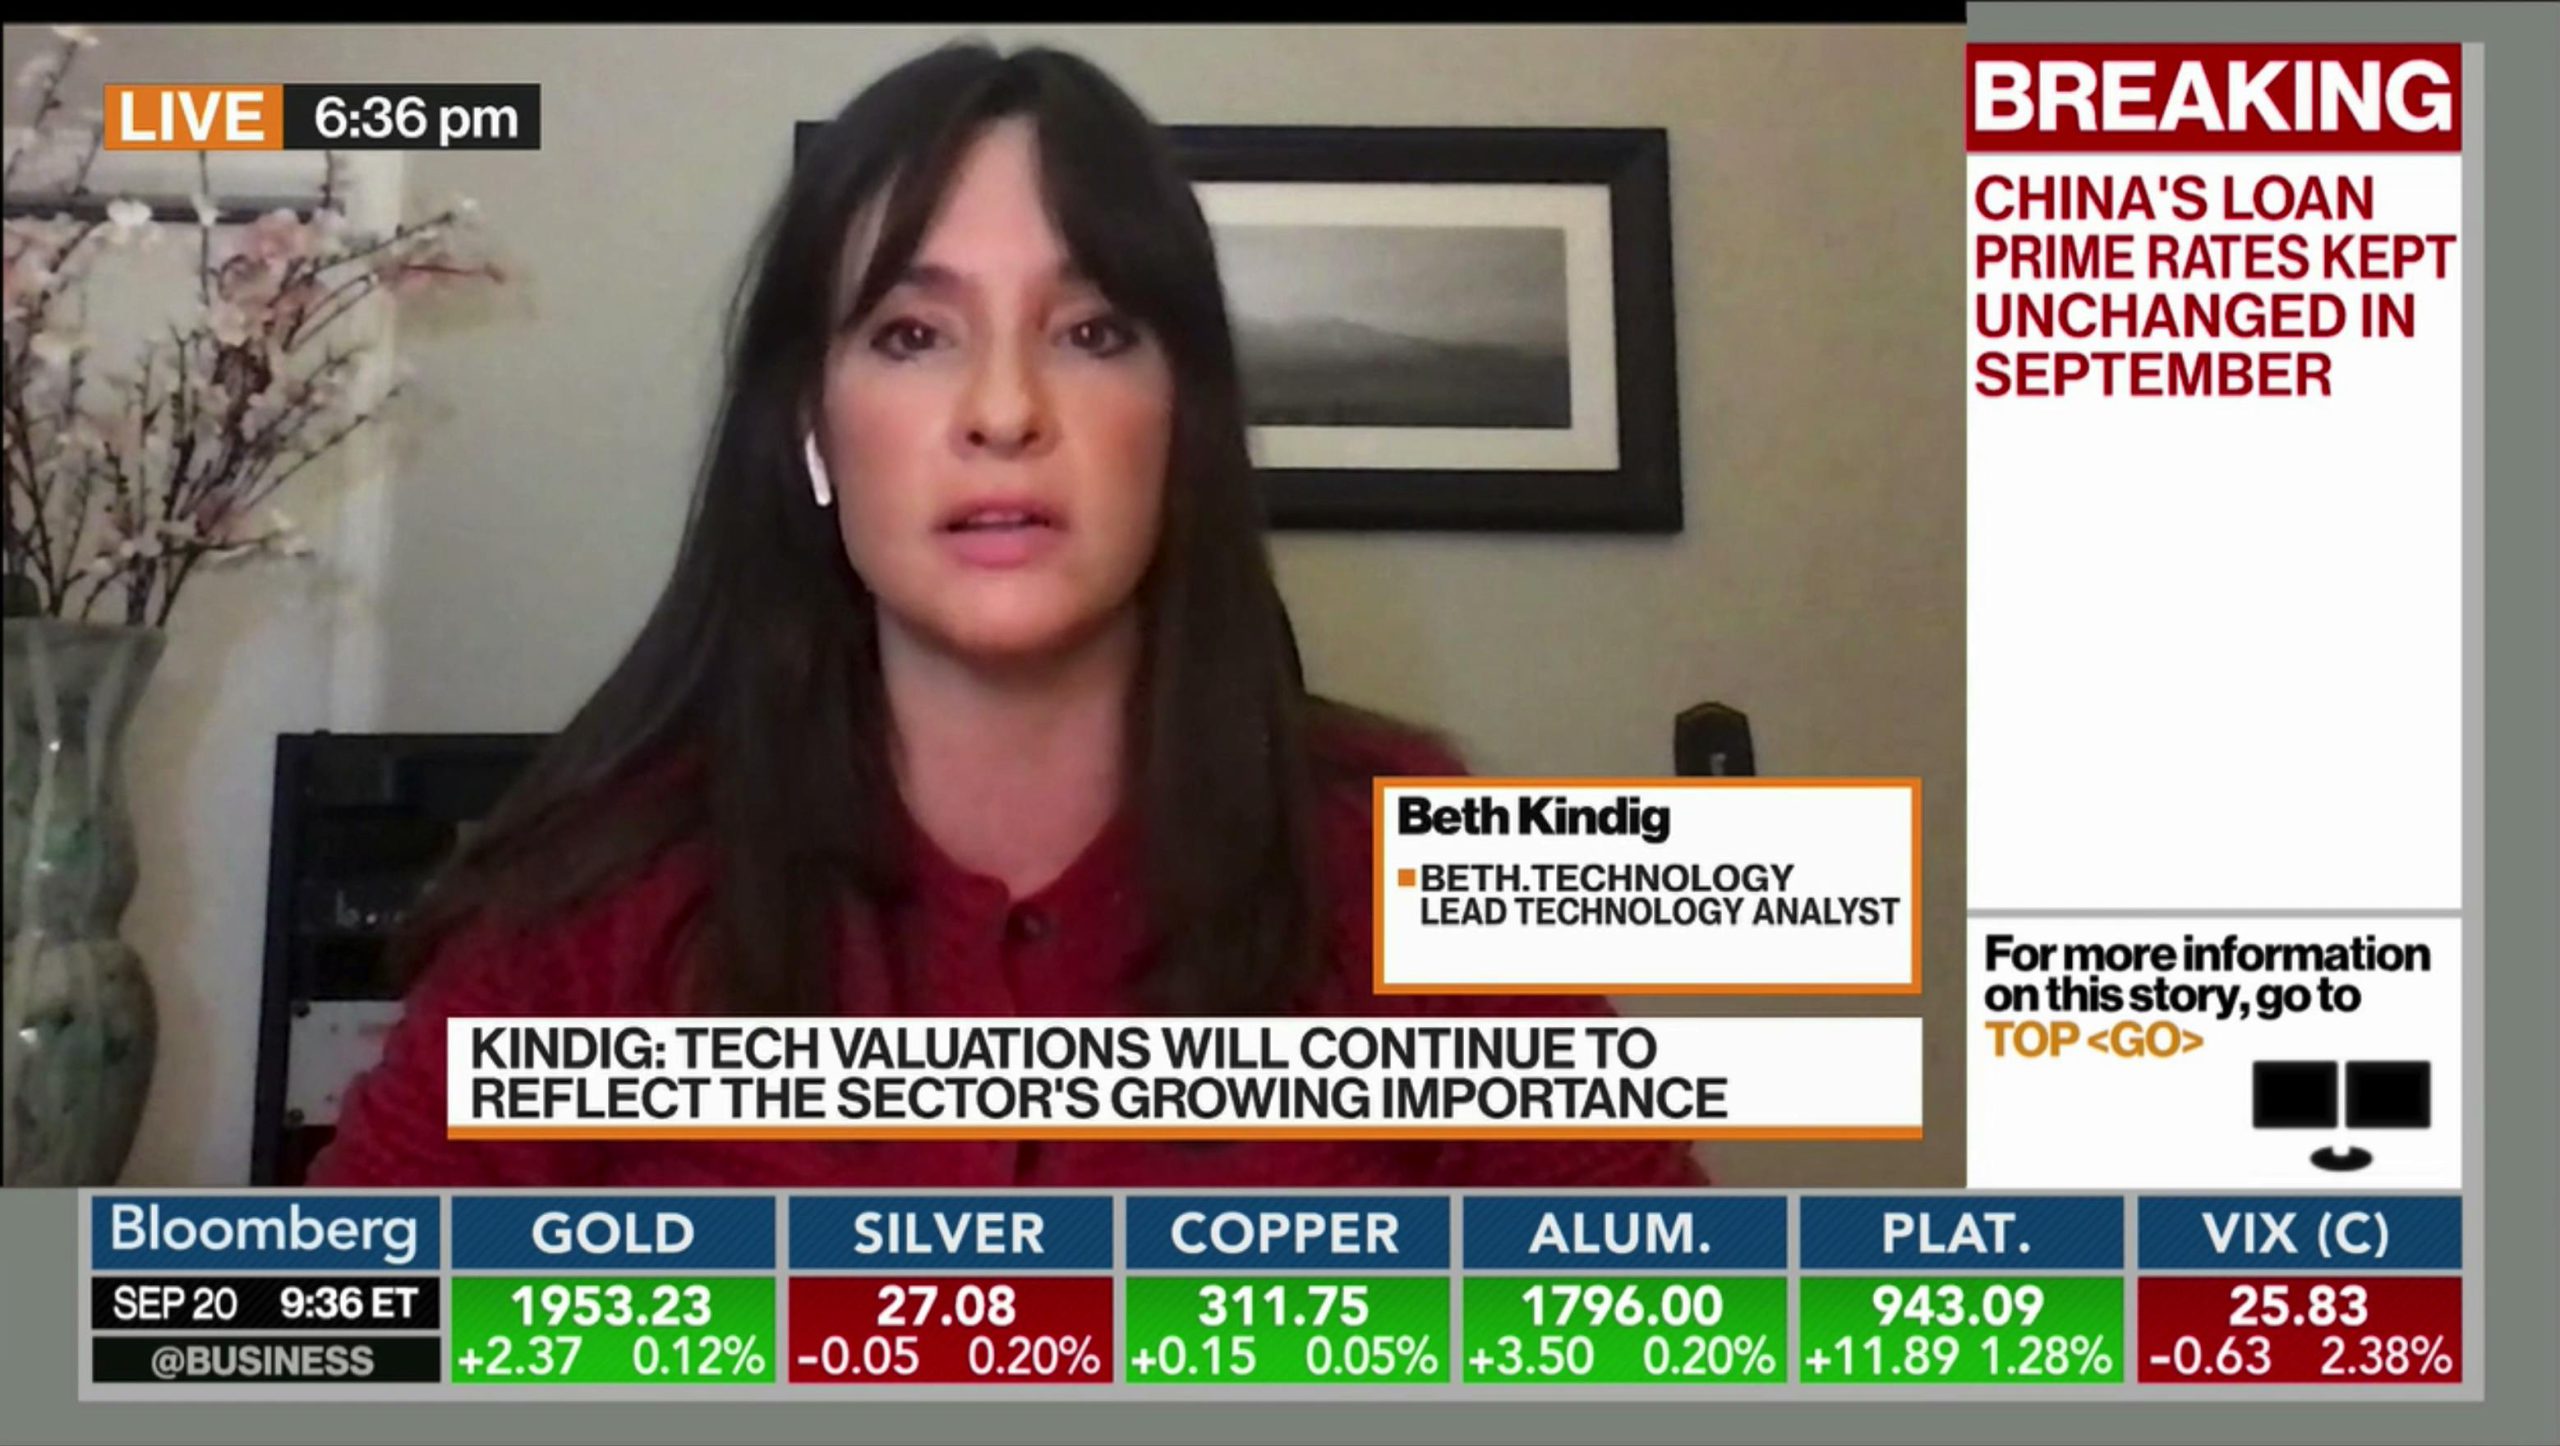
On a recent Bloomberg interview, I discussed Zoom Video as the stock that is “sitting right under everyone’s nose” due to growth that we haven’t seen in my lifetime or yours and likely won’t see again over the next decade.

Tech Sector Is Only Going to Grow: Beth Kindig

Access Bloomberg Video here.

This is a stock tip I released in the wake of the coronavirus shut-downs on April 3rd. There was a lot of noise in the market at that time due to the bull/bear market tug-o-war. I said, “If Silicon Valley unicorns are rare, then Zoom Video is a Pegasus.” The company then went on to accelerate from 78% year-over-year growth to 169% year-over-year analysis to 355% year-over-year growth. Keep in mind, I wrote this and maintained conviction even as the market began to question Zoom Video’s security issues.

We track institutional money flows by large volume spikes accompanied with a long candle pattern. We got out first indication that smart money was buying Zoom in bulk as indicated by the black arrow.

Case Study: Bandwidth

Bandwidth is a stock I covered on August 13th with a thesis around archaic telecom hardware becoming eradicated during and following the pandemic. I stated, “One trend I am monitoring closely for the more permanent effects is the disruption of telecom hardware systems through cloud-native communications” while spelling out why everything from SMBs to enterprises would seek to cut their telecom bills. From there, I wrote why I thought Bandwidth could out-perform long-term due to a solid list of customers, including Zoom, Google, Cisco, Microsoft, Skype, RingCentral and Square. I also discuss how Twilio is different from Bandwidth as this is a comparison that often comes up despite there being key differences at the product level.

This trend is still early yet we recently saw large institutional spikes in the stock. This is a great example as to why product-first analysis is key and how I try to give this to my free newsletter readers to help get them in front of trends the market may be overlooking.  

Notice the large volume spike below accompanied with a large candlestick.


In conclusion, thanks again for being a newsletter subscriber. We hope to deliver more original analysis in the months and years to come.

Warm regards,
Beth

p.s. If you’re not a free newsletter subscriber yet, you can sign up here.

Posted in Cloud Software, Interviews, Multimedia, Productivity, VideoLeave a Comment on Beating Smart Money & Bloomberg Video

Zoom Video Analysis From Long-Time Bull

Posted on April 2, 2020June 30, 2026 by io-fund
Zoom Video Analysis From Long-Time Bull

I recently discussed Zoom Video and its continued phenomenal rise. In the face of a global pandemic, the company has become the top performing stock on the NASDAQ this year with over 130% gains, or nearly a 160% spread with the 30% market decline.

From there, the stock has continually commanded the highest price-to-sales in the cloud software category and was able to hold its opening IPO price of $62 as support even when the market dumped cloud software last September with 30-40% drawdowns across the board.

So what’s Zoom’s secret?

Zoom’s easy access and URLs is the foundation of Zoom’s success. This is what we call product-market fit and why analysis on tech stocks should start with the product to maximize returns.

Product-market fit is what led me to call Zoom Video the best IPO of the year in 2019, why I encouraged investors to know their winners during the cloud selloff, and why we reiterated a buy signal on my research site when Zoom Video was at $65.

Read the full article here.

Zoom Video is a company where valuation defies logic. Zoom’s enterprise value/sales of 66 is the highest EV/Sales of any U.S. tech company valued at more than $500 million. The forward PE ratio is 260, although some of this reflects a company newly profitable.

Prior to going public, Zoom Video (ZM) had been doubling its revenue for the past three years and did this again for the fourth year. The company posted 100%+ revenue growth, climbing from $60M in revenue for fiscal 2017 to $330M in revenue for fiscal 2019. This is with gross profit margins in the high 70% to low 80% range.

Additionally, quarterly revenue also grew 78% same-quarter year ago to $188.3 million. Adjusted EPS was $0.15 compared to $0.04 EPS in the year-ago quarter. Q4 GAAP income grew 92% YoY to $10.6 million with adjusted non-GAAP income growing 292% YoY to $38.4 million. And total revenue grew 88% year-over-year to $622.7 million and revenue grew at a CAGR of 117% from FY 2017 to FY 2020.

Meanwhile, Zoom Video’s forward guidance shows a more tempered growth rate as the company approaches the $1 billion annual run rate. The median revenue estimate for Zoom Video is 48% growth in fiscal 2021 to $921.8 million and 39% growth in fiscal 2022. Management guidance for revenue is slightly lower than the consensus at $910 million in the mid-range for fiscal 2021. The median EPS guidance for FY 2021 is $0.45 and for FY 2022 is $0.58.

Finally, it’s worth mentioning that Zoom is outperforming both Google Hangouts and Microsoft Skype. The app is currently the second most downloaded mobile app, behind TikTok, according to app-analytics firm Sensor Tower. Citing data from tracking company Apptopia, The New York Times reported that close to 600,000 people had downloaded the iOS app in a single day earlier this month.

Read the full article here.

Posted in Cloud Software, Productivity, Top Tech Stock NewsLeave a Comment on Zoom Video Analysis From Long-Time Bull

Datadog Premium Research

Posted on January 14, 2020June 30, 2026 by io-fund

509d3f81-5ab0-47d8-b044-88c293b4f7b5_Datadog-Premium-Research.pdf

Datadog Premium Research

Fundamentals

Following its IPO in September, Datadog reported revenue that was up 87.8% year-over-year at $95.9 million compared to analyst expectations of $87.73 million. The revenue growth was higher than the 79.5% reported earlier in the year. 

Company guidance for Q4 revenue is between $101 million and $103 million. Full year revenue is expected to be between $350 million and $352 million. Forward 1-year revenue is expected to be around the $500 million mark.

This places Datadog second to Crowdstrike for estimated forward revenue growth in the cloud software category. 

However, it bears mentioning, Datadog is closer to profitability than any other cloud software company (among those currently reporting negative EPS). Datadog hovers near profitability with non-GAAP operating margin of 0.7% and non-GAAP EBIT of $0.6 million. GAAP operating margin is negative -4.4%. Free cash flow is negative $3.7 million. 

Full year non-GAAP EPS is estimated at negative -$0.12 to -$0.11. 

Datadog went public in September and is trading at 34 times the midpoint on its full-year guidance of $351 million. If other IPOs in 2019 are any indication, the expiration of the lock-up period on March 17th will likely see some level of adjustment in valuation. 

Addressable Market

The broad infrastructure monitoring market is quite nuanced with many players specializing in various aspects of cloud and IT. The broad addressable market will be worth $34 billion by 2024. It requires further effort, however, to break this down into the areas that Datadog directly serves. 

According to IDC, the global APM market reached $4.3 billion in 2018, posting 13.4% growth from 2017. The fastest growing companies during 2018 was AppDynamics at 42% market share and New Relic at 35% market share. The market is expected to grow annually by 11.84% over the next several years. 

Datadog is expanding into network performance monitoring with a current addressable market of $2 billion. The log management market (as a standalone) is worth $1 billion. 

Conservatively, Datadog’s addressable market is around $8 billion to $10 billion. For optimists, (such as the Jefferies’ analyst who stated Elastic’s market was around $40 billion), you could look at the $34 billion IT infrastructure monitoring market especially since Datadog does help monitor on-premise.

The $8-$10 billion market is sufficient enough for Datadog to continue its 65% growth with current revenue of $350 million. The company would only have to claim 5-10% of the market to be a breakout stock.

Product Overview

Datadog is a cloud-based monitoring and analytics company that offers infrastructure monitoring and has expanded into application performance monitoring (APM). The company aggregates metrics and events across the full infrastructure and application stack for a single point of view.

Datadog began as an infrastructure monitoring tool in 2010 and expanded into APM in 2016 with the public release in February of 2017 for full stack observability. 

Application performance monitoring assures applications and websites run as expected with optimal speeds across mobile platforms, cloud-native infrastructures, virtualized and containerized servers, etcetera. APM also assures that the application is performing as it should, backend processes are executing as they should, including transaction processing, and detects bug or errors in the application code, in the application server, website front end, a slow query, or a slow network.

Distributed application environments can cause numerous bottlenecks and it can be challenging to figure where the bottleneck is coming from. Meanwhile, slow speeds can cause customer drop-off. 

APM performs the following functions:

•       Digital user experience monitoring: determines if there is slowness, errors or downtime that could lead to a loss of revenue

•       Transaction profiling: analyzes the transaction flow to isolate the cause

•       Code-level diagnostics: According to DZone, 43% of application performance issues come from code. Diagnostics help to identify the line of code or query causing the issue.

•       Deep-dive analysis: Looks beyond code at the server and application infrastructure for problems such as insufficient memory or long wait times

•       Infrastructure monitoring: similar to deep drive analysis, ideally infrastructure monitoring is part of the APM package to monitor slow network connections or virtualization bottlenecks.

Competitors

There are a few 800-lb gorillas in the space, such as New Relic, AppDynamics (Cisco) and CA Technologies owned by Broadcom. Dynatrace is also considered a leader in APM and is a private company. 

Datadog lists New Relic, AppDynamics and Dynatrace as their main competitors.  

Source: IDC APM Market

New Relic

New Relic was founded in 2008 and entered the market with a SaaS-only APM solution. The products have expanded since then to include Infrastructure, Synthetics, Browser, Mobile and Insights for analytics. 

The company has expanded into monitoring Kubernetes containers and microservices monitoring (important for automation and machine learning) and now has a presence in Europe although global geographic coverage is a weakness for New Relic. Another weakness is the lack of on-premise.

New Relic’s most recent acquisition was SignifiAI for incident management, which occurred in February 2019. The company is also focused on root cause analysis including predictive anamoly detection, topology-enhanced operational event correlation, and automatic deployment tracking. 

Annual revenue of $479 million is expected to grow to $591 million revenue in the current fiscal year ending in March. Forward 1-year revenue is estimated at $693 million. New Relic is distinguished by its profitability, with EPS of $0.24 in the last quarter and current fiscal EPS of $0.64. 

App Dynamics

AppDynamics offers both on-premise and SaaS-based APM. Cisco bought AppDynamics for $3.7 billion. According to Gartner, App Dynamics revenue is in the $500 million range+ from sales of APM suites in 2018 (this matches IDC’s data). In an effort to improve its machine learning capabilities, Cisco acquired Perspica in 2017 for a purchase price of $3.7 billion. Perspica helps to surface issues by applying machine learning to large amounts of operations data. Instead of analyzing data after it’s in the database, this helps to analyze the data real-time as it’s being ingested. 

AppDynamics weakness is also its strength: Cisco. The revenue is likely reflective of Cisco’s market dominance in networking, yet many APM-specific customers are more apt to go with a smaller, specialized company that is solely focused on APM.

Dynatrace

Dynatrace’s analytics are sold as a package rather than as separate modules with analytics offering real-time topology and AI algorithms to detect anomalies, business impact and root cause across users, applications and infrastructure. The product roadmap includes expanding into multi-cloud and hybrid cloud and using purposebuilt AI to perform root cause analysis faster.

Dynatrace is a premium solution and is priced higher than other APM products.

Catalysts

Hybrid Cloud

I’ve covered the strengths of hybrid cloud in-depth with my Microsoft coverage over the past 1-2 years. Essentially, hybrid cloud allows companies to keep their most sensitive data on-premise while sending less sensitive workloads to the cloud for real-time data processing. Microsoft’s lead in hybrid cloud is what caused me to predict the Pentagon would choose Microsoft over Amazon, as well as Azure’s ongoing growth despite AWSdominance, as Amazon has been focused on cloud-only while ignoring the needs of Fortune 500 companies and others who are more cautious with intellectual property and first-party data.

Read my analysis on Microsoft being a hybrid clod leader here and why this is an important cloud market.

Datadog serves hybrid cloud customers and allows for monitoring of both environments. New Relic, on other hand, is SaaS-only (or cloud only). From my perspective, the most growth will come from hybrid over the next few years as the majority of companies today have resisted sending data to another company’s servers and must eventually choose a solution to remain competitive on AI and ML. 

In my opinion, the future growth of hybrid is an important catalyst and market opportunity for Datadog. You can read more about Datadog’s hybrid offering here.  

Network Performance Monitoring

Network performance monitoring is a potential catalyst for Datadog in 2020. Although the addressable market is quite small at around $2.1 billion, the cross-selling with customers could strengthen Datadog’s revenue growth.  

The company launched network performance monitoring in November of 2019 to expand on infrastructure monitoring and application monitoring. By monitoring virtualized networks, the product helps to increase performance optimization and reduce costs by looking for more optimized network patterns and to quickly find the source for network issues.  

For instance, if a cluster is saturating the network capacity, this monitoring tool helps to pinpoint the root cause. There are also topology and traffic flow tools to visualize network connections. 

Competitors in network performance monitoring include Netscout, Riverbed, Viavi and Extra Hop. Again, it’s about the cross-selling with the other products that Datadog provides rather than competing in network performance monitoring as a standalone product.

Technical Analysis

By Knox Ridley

Like many new IPOs, Datadog (DDOG), with just 4 months of price action to analyze, is showing a series of overlapping, corrective patterns, signaling uncertainty by the market. 

In November of 2019, Datadog hit an all-time high of $44, just before a near 25% drawdown took it down to $33.15. Since bottoming, it’s been in an overlapping uptrend, attempting to repair the damage done.   

Using basic Technical Analysis, we have a clear picture of where DDOG is, and what hurdles it needs to clear to regain higher prices. Starting with the upward trend lines that are highlighted in the blue, we can see a clear trend in price that is supported by a rising MACD and RSI. In other words, the momentum is building with price, which indicates a healthy trend. If we see a break of these trend lines in unison, expect Datadog’s price to test the recent low around $33. 

If we see these trendlines broken, the red retrace levels offer likely targets, based on basic rules of symmetry and Fibonacci levels. My main target will be around the $31 region if this scenario unfolds, which coincides with the

78.6% retrace level and the 100% extension of the initial move down. However, we could see it bottom at the 61.6% retrace level around $33, or to hit the 127.2% extension around $29-$28. This is my justification of the yellow target box, which I will watch closely if DDOG fails to breakout. 

Just above Datadog’s current price is a heavy clusters of Fibonacci prices that coincide with the $40-$42 region. With momentum fading, shown in the declining RSI and MACD, as well as negative divergence between price and the RSI, the probability of Datadog breaking this region is low. 

However, if this resistance is broken on heavy volume, expect an acceleration in price due to the high level of short interest in the current float, sitting around 25%. As price moves against shorts, especially breaking a region as significant as the $42 price level, they will cover their positions, creating a rush of buying pressure, which in turn, pushes the price higher at a rapid pace.

Elliott Wave – Scenario 1

The above chart offers my primary Elliott Wave count, which suggests another leg down. This would put us in the early stages of the final (C) wave down. The evidence I use to support leaning towards this count is as follows:

 –          The (B) wave up is slightly overlapping, which is what we see in corrective moves.

–          The declining internals in RSI and the MACD recently discussed are fading, and showing divergences as well. 

–          The heavy concentration of Fibonacci levels around $40-$42. 

–          The general fact that the market is heavily stretched and due for a correction. 

Expect the (C) wave to retest the last low around $33. If this scenario unfolds, my likely target will be around the $31 region, which is a concentration of significant Fibonacci levels and basic symmetry. I will likely be a buyer around the levels outlined in the yellow target box between $33-$28. 

Elliott Wave – Scenario 2

This is my alternative game plan, if DDOG can break through the $42 region with heavy volume. If this happens, we will have a clear 5-waves up, which would tilt the probability that we are in a 3rd wave higher. If that is the case, I would likely go long, with tight stops, which I will update if this scenario unfolds.

Please note, Datadog’s lock-up expires March 17th, 2020. We expect to see some price volatility following this date.

Posted in Cloud Software, Productivity, Stock Analysis PDFsLeave a Comment on Datadog Premium Research

Slack Update: Earnings Have to Be Perfect

Posted on December 2, 2019June 30, 2026 by io-fund

Slack currently has negative sentiment surrounding the company and the stock. We’ve seen a few instances where Slack is lumped in with the IPO unicorns this year, such as Uber, Lyft and WeWork. We believe this is unwarranted, but regardless, this is the information being reported. Meanwhile, we see companies with more positive sentiment experiencing deep sell-offs around the earnings report.

Keep in mind, Slack’s growth has been slowing – from 82% last year to 47-52% growth year-over-year over the past couple of quarters. Revenue came in at $145 million compared to $140.7 million expected by analysts with reported EPS negative 14 cents compared to expected EPS of negative eighteen cents. The stock dropped 16% following its last earnings report.

Slack is guiding for third-quarter revenue of $154 million to $156 million. Judging by the reactions to previous earnings reports this quarter, Slack’s report has to be perfect to not accompany a sell-off.

Could Slack have a surprise earnings report? Yes, it could, but right now it’s a coin toss. It’s a gamble to own Slack right now based the stock trading at the bottom for slightly more returns. The other option is to wait for a breakout confirmation for slightly less returns. There has been institutional interest on both the long and short side of Slack, which has established the current trading range as well as important price targets for breakouts (more on this below).

Many analysts are focused on Microsoft Teams, which is a mistake for a few reasons. Microsoft has dominated business communications for thirty years with an estimated 400 million users on Microsoft Outlook. I assume Microsoft Teams will leverage this user base and sign-up many more users than the 20 million that Teams currently has. Slack’s addressable market is primarily the non-Outlook users (although many users have both Outlook and Slack). The addressable market is hard to exactly quantify but there are 100 million Mac users and 70 million G-suite users. Slack’s addressable market should be somewhere in this range of alternative OSs and productivity tools.

Workplace chat applications are very early but will replace other enterprise and small-to-medium business communications moving forward. This is an important trend to watch as Slack’s engagement is unheard of, with the application open 9 hours per day and boasts engagement of 90 minutes per day – compared to Facebook at 58 minutes, Instagram at 53 minutes and YouTube at 40 minutes per day. These social companies monetize through advertising, but in time, Slack should be able to charge companies for the usage once the trend breaks out.

We know from Microsoft’s user base of only 20 million, or 5% of their addressable market, that we are dealing with a very early trend. Slack will continue to be on our watchlist regardless of what the earnings come in at.

Technical Analysis

By Knox Ridley

Slack’s downtrend does not seem to be over just yet. It bottomed at $19.54 and has been range bound between the $20 and $23 range. There are heavy buyers at both regions, so it will probably take an earnings surprise to break the range.

Based on the current structure of the most recent uptrend, it is obviously corrective in that it overlaps. We do not have a clear 5 waves up, and until I see that, I would be cautious of any bottom.

Furthermore, the MACD is approaching its own resistance, which it will need to break through to further confirm a new uptrend. The RSI is making lower highs while price is hitting the $23 resistance zone, indicating that the momentum is fading as well. And, the volume is fading as we approach the $23 region.

All of these factors are pointing towards another retest of the $20 support region. Even if we do get a much deserved breakout, until Slack shows a clear impulsive 5-waves up off the bottom, and clears through the above retracements with heavy volume, I’d be cautious and expect one more leg lower before we finally get a real buying opportunity for the long haul.

Please note: The I/O Fund conducts research and draws conclusions for the Fund’s positions. We then share that information with our readers. This is not a guarantee of a stock’s performance. Please consult your personal financial advisor before buying any stock in the companies mentioned in this analysis.

Posted in Cloud Software, Productivity, Stock Updates (Blogs)Leave a Comment on Slack Update: Earnings Have to Be Perfect

How to pick long-term stock winners in cloud computing

Posted on September 13, 2019June 30, 2026 by io-fund
How to pick long-term stock winners in cloud computing

Cloud software stocks suffered a reversal that has produced losses of close to 50% from record highs.

The story for those stocks hasn’t changed, but the valuations have, and that could be a good thing for investors who know what they own.

The biggest risk for investors in cloud stocks isn’t the losses that have pummeled prices over the past two weeks, but rather the big reversal that may scare them away from the sector. It’s painful to watch large declines in stocks, yet nobody wants to miss out on a potential 10-bagger either. When the market rewards, and penalizes, all cloud software stocks equally, with little differentiation, it’s prudent to choose a select group that has compelling stories for a buy-and-hold strategy.

An investing adage is to buy when others are fearful. I would say to buy when others can’t differentiate among companies. Clearly, from what we saw over the past two weeks, a broad range of companies are being lumped together, with little recognition as to which are the winners.

To put it simply, this is a great time to know what you own as the story for these stocks is much deeper than the simple descriptor of “cloud software.”

In the graphic above, the orange line represents the First Trust Cloud Computing ETF SKYY, +0.12% which holds about 60 positions, all of which dominate the cloud space. The light-blue line is the Consumer Staples Select Sector ETF XLP, +0.41%, which tracks the consumer staples sector, a group that’s thought to be impervious to recessions. Those have historically been the laggards in this long, growth-driven bull market. The dark purple line is the benchmark S&P 500 Index SPX, +0.29%.

Before the stock market correction in May, cloud stocks were the leader in the market, while the staples were trailing. However, since that first correction, and up till today, there’s been a reversal. Over the past week high-growth leaders in this bull market, mostly cloud, have taken big hits.

For example:

Workday WDAY, -1.26% is down 25% from its high. Twilio TWLO, +3.08%, down 26%. Okta OKTA, -0.20%, down 22%. Zoom ZM, +1.02%, down 27%. MongoDB MDB, -1.57%, down 29%. PagerDuty PD, -0.38%, down 47%. (All prices are current as of 2 p.m. Eastern time Sept. 11.)

Cloud software categories

To start, cloud software needs to be broken up into categories to look more closely at the markets they serve. Here are some examples:

• Twilio is at the intersection of communications and mobile.

• CrowdStrike CRWD, +0.80% and Okta are security companies.

• PagerDuty simplifies operations, and Workday simplifies human resources and the finance department.

• Alteryx AYX, -0.74% and Splunk SPLK, +0.02% are big data analytics.

• Salesforce CRM, +0.43% is customer relationship management (CRM), but the market it serves is the sales and marketing industry.

• Zoom simplifies communications for enterprises and business-to-business (B2B), as does Slack WORK, +1.47%.

• Veeva Systems VEEV, -0.08% serves the life sciences and pharmaceutical industry.

Twilio has more in common with Skype, and even Verizon VZ, +0.50% and AT&T T, -0.93%, than it does with Okta. Workday has more in common with SAP and Oracle ORCL, -4.26% than it does with Alteryx. Yet, cloud stocks experienced a categorical black swan as if they all serve the same markets.

What this means is that some investors don’t understand these companies. The viability of a company’s product and how it fits the market is not factored into the investments, and this is creating a window of opportunity for investors who take the time to study individual stocks.

Valuations

The more logical explanation is that there was a clearance sale for overpriced stocks, and the common denominator in the sell-off was high valuations. However, the issue with this theory is that some of the companies will go on to be big winners, and higher price-to-sales (P/S) or enterprise-value-to-sales (EV/S) ratios are warranted because of the enormous markets they serve in contrast with their small size.

For instance, Zoom’s P/S and EV/S are gut-wrenching (no argument there), but the company’s revenue growth is unusual. You’d be hard-pressed to find triple-digit revenue growth for eight straight quarters in the stock market. The prospects of disrupting Cisco and other enterprise telecommunications at a $22 billion market cap is worth more than other companies that are serving smaller, more saturated markets. Zoom’s rapid growth, which is unprecedented, makes it hard to pinpoint a fair valuation.

Workday is another example of a company that carries high P/S and EV/S ratios, in this case twice as high as its large competitors, Oracle and SAP. In this scenario, you get a pure-play option that is moving quickly on machine learning to reduce the overhead required in human resources and finance departments. What Workday’s software aims to do, which is to reduce the number of employees needed in those departments, delivers a value that is worth many times over the cost of the software. If Workday is successful, the company will be worth much more than two times its current market cap, whereas, Oracle and SAP are essentially defending territory.

See: Beth Kindig runs a forum on tech stocks where she answers readers’ questions.

Splunk has P/S and EV/S ratios of eight compared with Alteryx’s 24 and 22, respectively, yet both were affected by the sell-off despite being in similar markets. Splunk should have held steady if this was a clearance sale on high valuations.

The evidence doesn’t point to a rational reason for the sell-offs. Some stocks are priced high, but knowing which ones deserve to be is going to be more important than ever.

Also Read: Okta Earnings: More to Squeeze From Valuation?

How to evaluate cloud software

• The larger the market, the safer the investment. Can every enterprise employee in the world use the product for maximum scale? Does the product solve a pain and reduce overhead for businesses? These will outlast the more niche markets and products that are considered a convenience. To illustrate, if you are providing software for office communications that replaces office telecom equipment, not only is your product a necessity but it will be the solution to high telecom bills during a time when costs are being cut. There are numerous examples of fulfilling a (non-negotiable) necessity while reducing costs in the cloud software category.

• Ignore earnings estimates. Many estimates were lowered this past year, and when companies “beat” earnings estimates, they were actually declining year-over-year, sometimes substantially. Apple AAPL, -0.23% is a prime example of this. The stock continues to reach all-time highs and “beat earnings” despite two straight quarters of negative growth and mere 1% growth in the most recent quarter. That may work for Apple, but smaller-cap companies that are declining won’t last long, especially in a value rotation. Another example is Okta, which I believe had weakening fundamentals yet beat earnings estimates. Okta is now one of the hardest-hit cloud software stocks over the past two weeks, with a 22% drop since the end of August.

• We hear a lot about competitive moats, yet high switching costs is a protective buffer that serves two purposes: It locks in subscription revenue and staves off competitors. Often, switching from a cloud software provider will cost a customer time and resources. Look for companies that have high switching costs.

My prediction is this may be one of the last cycles when tech is considered less safe than value stocks. As the market will find out (the hard way), cloud software is actually very safe. It is insulated from trade wars and overseas manufacturing issues. It reduces costs for enterprises, which is ideal for a recession. Lastly, cloud software is at the beginning of a rapid growth cycle compared to its counterparts in tech — such as mobile, e-commerce and advertising — which are reaching saturation, are finding themselves in the cross hairs of anti-trust and are susceptible to consumer spending changes.

The best companies in the category of “cloud software” will continue to post rapid growth regardless of economic conditions, and the investors who run from this sector will suffer bigger losses from missed opportunities than investors who know their winners.

This article appeared on MarketWatch September 12th, 2019.MarketWatch September 12th, 2019.

Posted in Cloud Software, ProductivityLeave a Comment on How to pick long-term stock winners in cloud computing

Posts navigation

Older posts
Newer posts

Recent Posts

  • The IPO Glut of 2020: Why Valuations Have Gone Too Far
  • Zoom Discusses Two Important Catalysts In Q1 Earnings
  • Three Risk Management Tools the I/O Fund Offers
  • Micron Is Up 900%. Here’s Why the AI Memory Trade May Still Have Room to Run
  • Credo: Reliability Leader Aggressively Moves into Optics

Recent Comments

No comments to show.

Archives

  • June 2026
  • May 2026
  • April 2026
  • March 2026
  • February 2026
  • January 2026
  • December 2025
  • November 2025
  • October 2025
  • September 2025
  • August 2025
  • July 2025
  • June 2025
  • May 2025
  • April 2025
  • March 2025
  • February 2025
  • January 2025
  • December 2024
  • November 2024
  • October 2024
  • September 2024
  • August 2024
  • July 2024
  • June 2024
  • May 2024
  • April 2024
  • March 2024
  • February 2024
  • January 2024
  • December 2023
  • November 2023
  • October 2023
  • September 2023
  • August 2023
  • July 2023
  • June 2023
  • May 2023
  • April 2023
  • March 2023
  • February 2023
  • January 2023
  • December 2022
  • November 2022
  • October 2022
  • September 2022
  • August 2022
  • July 2022
  • June 2022
  • May 2022
  • April 2022
  • March 2022
  • February 2022
  • January 2022
  • December 2021
  • November 2021
  • October 2021
  • September 2021
  • August 2021
  • July 2021
  • June 2021
  • May 2021
  • April 2021
  • March 2021
  • February 2021
  • January 2021
  • December 2020
  • November 2020
  • October 2020
  • September 2020
  • August 2020
  • July 2020
  • June 2020
  • May 2020
  • April 2020
  • March 2020
  • February 2020
  • January 2020
  • December 2019
  • November 2019
  • October 2019
  • September 2019
  • August 2019
  • July 2019
  • June 2019
  • May 2019
  • April 2019
  • March 2019
  • February 2019
  • January 2019
  • December 2018
  • November 2018
  • October 2018
  • September 2018
  • August 2018
  • July 2018
  • June 2018
  • May 2018
  • April 2018
  • February 2018
  • January 2018

Categories

  • 5G
  • About
  • Accounting Tips
  • AdTech
  • Ai Platforms
  • Ai Platforms
  • Ai Platforms
  • Ai Platforms
  • Ai Platforms
  • Ai Platforms
  • Ai Platforms
  • Ai Platforms
  • Ai Platforms
  • Ai Platforms
  • Ai Platforms
  • Ai Platforms
  • Ai Platforms
  • Ai Platforms
  • Ai Platforms
  • Ai Platforms
  • AI Stocks
  • AI Stocks
  • Analysts
  • Application Monitoring
  • Application Monitoring
  • Applications
  • Applications
  • Applications
  • Applications
  • Applications
  • Applications
  • Applications
  • AR
  • Audit Reports
  • Autonomous Vehicles
  • Autonomous Vehicles
  • Autonomous Vehicles
  • Autonomous Vehicles
  • Autonomous Vehicles
  • Autonomous Vehicles
  • Autonomous Vehicles
  • Avod
  • Avod
  • Battery Charging
  • Bear Market
  • Bitcoin
  • Bitcoin
  • Bitcoin
  • Bitcoin
  • Bitcoin
  • Bitcoin
  • Bitcoin
  • Blockchain
  • Blockchain
  • Blockchain
  • Blockchain
  • Blockchain
  • Blockchain
  • Blockchain
  • Broad Market Today
  • Bull Market
  • Bull Market
  • Chainlink
  • Chainlink
  • Chainlink
  • Chainlink
  • China Stocks
  • Cloud
  • Cloud Infrastructure
  • Cloud Infrastructure
  • Cloud Infrastructure
  • Cloud Infrastructure
  • Cloud Infrastructure
  • Cloud Infrastructure
  • Cloud Infrastructure
  • Cloud Platforms
  • Cloud Platforms
  • Cloud Software
  • Cloud Software
  • Cloud Software
  • Cloud Software
  • Cloud Software
  • Cloud Software
  • Cloud Technology
  • Company
  • Company
  • Console Gaming
  • Console Gaming
  • Console Gaming
  • Consumer
  • Consumer
  • Consumer
  • Consumer
  • Consumer
  • Consumer
  • Consumer
  • Consumer
  • Consumer
  • Consumer
  • Consumer
  • Consumer
  • Consumer
  • Consumer
  • Consumer Tech
  • Corrections
  • Crypto Investment
  • Ctv
  • Ctv
  • Ctv
  • Ctv
  • Ctv
  • Ctv
  • Ctv
  • Ctv
  • Ctv
  • Ctv
  • Cybersecurity
  • Cybersecurity
  • Cybersecurity
  • Cybersecurity
  • Cybersecurity
  • Cybersecurity
  • Cybersecurity
  • Cybersecurity
  • Cybersecurity
  • Cybersecurity
  • Cybersecurity
  • Cybersecurity
  • Data
  • Data Analytics
  • Data Analytics
  • Data Analytics
  • Data Center
  • Data Center
  • Data Center
  • Data Center
  • Data Center
  • Data Center
  • Data Center
  • Data Center
  • Data Center
  • Data Center
  • Data Center
  • Data Center
  • Data Center
  • Data Center
  • Data Center
  • Data Center and Processing
  • Data Warehousing
  • Data Warehousing
  • Data Warehousing
  • Data Warehousing
  • Databases
  • Databases
  • Databases
  • Databases
  • Dating
  • Defi
  • Digital Ads
  • Digital Ads
  • Digital Ads
  • Digital Ads
  • Digital Ads
  • Digital Ads
  • Digital Ads
  • Digital Ads
  • Digital Ads
  • Digital Ads
  • Digital Ads
  • Digital Ads
  • Digital Ads
  • Digital Ads
  • E-Commerce
  • Earning Updates
  • Earning Updates
  • Earning Updates
  • Earning Updates
  • Earning Updates
  • Earnings Report
  • Earnings Report
  • Earnings Report
  • Earnings Report
  • Earnings Report
  • Earnings Report
  • Earnings Report
  • Earnings Report
  • ECommerce
  • Electric Vehicles
  • Electric Vehicles
  • Electric Vehicles
  • Electric Vehicles
  • Electric Vehicles
  • Electric Vehicles
  • Electric Vehicles
  • Energy Stocks
  • Enterprise
  • Enterprise
  • Enterprise
  • Enterprise
  • Enterprise
  • Enterprise
  • Enterprise
  • Enterprise
  • Enterprise
  • Ethereum
  • Events1
  • Events1
  • Exchange
  • Faq
  • Finance
  • Financial Analysis
  • Financial Analysis
  • Financial Analysis
  • Financial Analysis
  • Financial Analysis
  • Financial Analysis
  • Financial Analysis
  • Financial Analysis
  • Financial Analysis
  • Financial Analysis
  • Financial Analysis
  • Financial Analysis
  • Financial Markets
  • FinTech
  • Fundamental Analysis
  • Gambling
  • Gaming
  • Genomics
  • Glossary
  • Green Energy
  • Growth Stocks
  • Growth Stocks
  • Growth Stocks
  • Headsets
  • Headsets
  • Health Tech
  • Hydrogen
  • Identity
  • Identity
  • Identity
  • Inflation
  • Inflation
  • Inflation
  • Internet of Things
  • Interviews
  • Interviews
  • Interviews
  • Interviews
  • Investing
  • Investing
  • Ltbh
  • Ltbh
  • Ltbh
  • Ltbh
  • Ltbh
  • Macro Trends
  • Macro Trends
  • Market Trends
  • Market Trends
  • Market Trends
  • Market Trends
  • Market Trends
  • Market Trends
  • Market Trends
  • Market Updates
  • Market Updates
  • Market Updates
  • Market Updates
  • Market Updates
  • Market Updates
  • Market Updates
  • Market Updates
  • Market Updates
  • Market Updates
  • Media
  • Membership
  • Mining
  • Mobile
  • Mobile
  • Mobile
  • Mobile
  • Mobile Gaming
  • Mobile Gaming
  • Mobile Gaming
  • Multimedia
  • Music Streaming
  • NVDA | NVIDIA Corporation
  • Performance Updates
  • Pin Content
  • Podcasts
  • Podcasts
  • Podcasts
  • Portfolio
  • Premium Research
  • Press Releases
  • Press Releases
  • Productivity
  • Productivity
  • Productivity
  • Productivity
  • Productivity
  • Productivity
  • Productivity
  • Reports and Whitepapers
  • Research Services Preview
  • Resources
  • Resources
  • Semiconductor Stocks
  • Semiconductors
  • Semiconductors
  • Semiconductors
  • Semiconductors
  • Semiconductors
  • Semiconductors
  • Semiconductors
  • Semiconductors
  • Semiconductors
  • Semiconductors
  • Semiconductors
  • Semiconductors
  • Semiconductors
  • Social Media
  • Social Media
  • Social Media
  • Social Media
  • Social Media
  • Social Media
  • Social Media
  • Software
  • Software
  • Software
  • Software
  • Software
  • Software
  • Software
  • Software
  • Software
  • Software
  • Software
  • Software
  • Software
  • Software
  • Software
  • Solar
  • Solar
  • Stock Analysis PDFs
  • Stock Updates
  • Stock Updates (Blogs)
  • Supplychain
  • Supplychain
  • Supplychain
  • Supplychain
  • Supplychain
  • Supplychain
  • Svod
  • Svod
  • Svod
  • Svod
  • Svod
  • Svod
  • Tech Podcast
  • Tech Stock News
  • Tech Stock News
  • Tech Stock News
  • Tech Stock News
  • Tech Stock News
  • Tech Stocks
  • Tech Stocks
  • Tech Stocks
  • Tech Stocks
  • Tech Stocks
  • Tech Stocks
  • Tech Stocks
  • Tech Stocks
  • Tech Stocks
  • Tech Stocks
  • Tech Stocks
  • Tech Stocks
  • Tech Stocks
  • Tech Stocks
  • Technical Analysis
  • Telehealth
  • Telehealth
  • Telehealth
  • Telehealth
  • Testing Equipment
  • Testing Equipment
  • Top Tech Stock News
  • Travel
  • Trends Report
  • Tutorials
  • Uncategorized
  • Updates
  • Updates
  • Updates
  • Video
  • Video
  • Video
  • Video
  • Video Footage
  • VR
  • Webinar Alerts
  • Webinar Alerts
  • Webinars
Proudly powered by WordPress | Theme: iofund by iofund.co.uk.