Skip to content
Logo-main-white.860316a8

I/O Fund

  • Home
  • Free Stock Analysis
  • AI Stocks
  • BEST OF 2025
  • Analysts
  • Nvidia Hub
  • About
    • Case Studies
    • About Us
    • Premium Services
    • Pricing
    • Notable Wins
    • I/O Fund Reviews
    • Media
  • Contact Us

Category: AI Stocks

Palantir Stock 2026 Forecast: Is Its High Valuation Sustainable?

Posted on January 15, 2026June 30, 2026 by io-fund
Palantir Stock 2026 Forecast: Is Its High Valuation Sustainable?

Palantir’s stock has defied gravity, delivering steady performance that no other AI software stock has come close to matching (yet). For investors, the Palantir thesis is two-fold: the company must continue to scale its Commercial segment after posting multiple quarters of over 50% growth, while also sustaining a high valuation. Both matters and the bar is undeniably high. 

What separates Palantir, however, is not simply growth, but capability. The differences matter as unlike traditional AI-enabled database or business intelligence competitors, Palantir can operate effectively even when data sets are incomplete or fragmented—situations where most models struggle. In that regard, traditional business intelligence companies require a complete data set, whereas Palantir can handle situations where one isn't available. You can think of the competitive advantage as actionable depth, as Palantir has described it: “the reasoning that goes into decision-making, not just data.”    

Palantir’s Artificial Intelligence Platform (AIP) integrates generative AI with operational data and workflows, and, when combined with Palantir’s other platforms, Foundry and Apollo, it provides an AI service mesh that can run hundreds of microservices, scale compute via its Rubix engine, and orchestrate updates through Apollo.   

Additionally, Palantir’s knowledge graph, referred to as Ontology, is a distinct advantage. The graph offers better context than a large language model would on its own – or as Palantir states, it’s “the reasoning that goes into decision-making.” Palantir made key upgrades to AIP with the introduction of AI-forward-deployed engineers (FDEs) and the AI Hivemind, and brought Ontology to the edge, enabling deployment on mobile devices. 

Palantir Stock leads the AI software pack, delivering one of the best reports across tech in Q3. Revenue accelerated nearly 15 points sequentially to almost 63%, with strong growth in key metrics and a 28-point acceleration in US Commercial revenue to 121% YoY. The Artificial Intelligence Platform (AIP) is driving most of the Commercial growth, as there was a clear revenue inflection when AIP launched in mid-2023. 

The company reported strong key metrics, with net retention rate (NRR) expanding six points sequentially to 134%. Over the past two years, NRR has risen an impressive 27 points, and Palantir noted that AIP is continuing to drive existing expansions and new customer conversions. On the other hand, Palantir’s forward P/S ratio trades at an outstanding 67.5.   

Below, I discuss what you need to know about Palantir, and the hotly debated stock. 

New Product Upgrades – AIP FDEs, Hivemind and Edge Ontology 

Palantir made a handful of upgrades to its AIP and Ontology in Q3, unveiling AIP forward-deployed engineers (FDEs) in beta, AI Hivemind, and Edge Ontology, all aimed at accelerating AI deployment with its customers.  

AI FDEs builds upon Palantir’s take on software engineers, the forward deployed engineer, which sit at the intersection of software, sales, and platform engineers, embedding within customer teams to closely develop and tailor AI software and solutions directly to their needs. Palantir now brings this to AIP, with the AI FDEs being its AIP-native deployment AI agent that “understands how to connect to data sources, how to integrate and transform data, how to create ontologies and functions and build applications.” AI FDEs function in conversational commands, allowing customers to easily turn requests into autonomously executed Foundry operations. 

Palantir says the AI FDEs are increasing productivity for customers, noting that at one customer, two of its human FDEs utilized AI FDEs to migrate to a legacy data warehouse in five days, a task which Palantir says would normally have taken up to two years.

mid

AI Hivemind is a new tool within AIP that Palantir says will orchestrate a “swarm of dynamically generated agents to tackle hard problem solving, idea generation refinement and executable proposal generation that is integrated with Ontology and therefore aware of the context of your enterprise.” Palantir says the tool was developed to help government clients solve extremely complex problems with classified data (such as generating intricate mission plans), but it has already been tested by commercial clients to help “identify bottlenecks to their supply chain, proactively developing possible solutions and then leveraging AI FDE to code that up into an actual solution.” 

Edge Ontology is Palantir’s new, lightweight Ontology that allows it to run on mobile devices, letting customers build mobile apps or embedded software for hardware such as robots or drones. Edge Ontology is also fully integrated with AIP. While Palantir was very thin on details, it’s likely tied to its existing partnership with Qualcomm, where the two brought Ontology to edge devices powered by Qualcomm’s Dragonwing processors. This partnership focused on the industrial, auto and manufacturing sectors, and remote and offline environments. 

Together, the new product upgrades reflect Palantir’s dedication to continuously improve its platform and help customers consistently solve problems daily. Financially, the three new upgrades can help accelerate deployments and adoption of AIP, help secure more (and potentially larger) contracts, and tap into new markets such as IoT at the edge. 

Financials 

Revenue Accelerates Nearly 15 Points to 63% YoY 

Palantir reported $1.18 billion in revenue in Q3, up by an impressive 18% QoQ and beating estimates by 8.4%, driven by unwavering momentum in US Commercial. On a YoY basis, revenue growth accelerated 14.8 points to 62.8% YoY, the largest sequential acceleration to date and marking Palantir’s highest growth rate since going public. Over the last nine quarters, topline growth has accelerated ~50 points, from just 12.7% in Q2 2023, a rare feat to accomplish. 

For Q4, Palantir guided revenue up 60.6% YoY to $1.327 to $1.331 billion, well ahead of estimates for 44.2% growth to $1.19 billion. While this does represent a marginal deceleration at face value, this sequential deceleration is in line with trends from previous quarters.  

Chart showing Palantir (PLTR) year-over-year revenue growth over nine quarters, reaching a record 62.8% in Q3 2025, the highest since IPO, highlighting acceleration driven by Palantir’s Artificial Intelligence Platform (AIP).

Palantir (PLTR) Revenue YoY Growth: 9-Quarter Acceleration Hits Record 62.8% in Q3 2025, marking the highest growth rate since its IPO. This chart highlights the unprecedented revenue acceleration driven by Palantir’s Artificial Intelligence Platform (AIP).   

Source: Company IR 

For the full year, Palantir raised its revenue outlook to $4.396 to $4.40 billion, pointing to YoY growth of 53.5% at midpoint, a sharp acceleration from 29% growth in 2024. To put in perspective the strength of this acceleration, Palantir had initially guided for just 30.9% growth to $3.76 billion in revenue back in Q4 2024; growth is now more than 22 points faster.  

Impressive 28 Point Acceleration in US Commercial Revenue to 121% YoY 

Palantir’s US Commercial segment is generally seen as the primary vector for its AIP-driven growth, with robust momentum only accelerating further in Q3.   

US Commercial revenue grew 29% QoQ and 121% YoY to $397 million in Q3, accelerating from 93% YoY growth in Q2. Since the start of the year, US Commercial growth has accelerated 50 points, and since the start of 2024, growth has accelerated 81 points.  

Chart illustrating US commercial revenue acceleration by 28 percentage points, reaching 121% year-over-year growth and totaling $397 million in Q3 2025, highlighting strong performance and market expansion.

US Commercial Revenue accelerated by 28 percentage points to 121% YoY growth to $397 million.  

Source: Company IR 

For the full year, Palantir significantly boosted its US Commercial growth outlook to >104% YoY, up from 85% previously. This corresponds to revenue of $1.433 billion, up from $1.302 billion previously.  

Key metrics for the segment were very strong: TCV closed (total contract value) surged 342% YoY to a record $1.31 billion, and TTM TCV was $3.8 billion, up 217% YoY. Remaining deal value (RDV) rose 199% YoY and 30% QoQ to $3.63 billion. US Commercial deals closed of >$1 million were up 2X YoY and deals closed of >$5 million were up 5X YoY. 

Palantir Key Segments – Government and Commercial Revenue 

Q3 also marked the first time Commercial growth outpaced Government segment growth since Q2 2024, fueled by the robust momentum and sharp acceleration in US Commercial as discussed above.   

Commercial revenue rose 21.5% QoQ and 73% YoY to $548 million, a 26-point acceleration from 47% YoY growth last quarter. International Commercial revenue was ~$151.7 million in Q3, up ~10% YoY and 5% QoQ. 

Government revenue rose 14.5% QoQ and 55% YoY to $633 million, a six-point acceleration from 49% YoY in Q2. Government remained Palantir’s largest segment at ~53.6% of revenue. US government revenue was up 52% YoY and 14% QoQ to $485.9 million, while International Government revenue was ~$146.8 million, up nearly 66% YoY and 16% QoQ. 

Other Key Metrics – NRR Expands, Strong Customer Growth 

Palantir had a handful of other strong key metrics that support strong revenue growth continuing despite the sharp acceleration the company delivered in Q3.   

Palantir’s net retention rate (NRR) expanded six points sequentially to 134%, and over the past two years, NRR has risen an impressive 27 points, with Palantir noting that AIP is continuing to drive existing expansions and new customer conversions. Palantir also continued to emphasize that NRR does not include revenue from new customers acquired over the last twelve months, and accelerating momentum in quarterly deals closed supports more upside to NRR in 2026. 

Chart showing Palantir stock’s Q3 net retention rate accelerating by 600 basis points sequentially to 134%, highlighting strong customer growth and engagement trends.

Palantir stock’s Q3 Net Retention Rate accelerated by 600 basis points sequentially to 134% in Q3. 

Source: Company IR

For Palantir’s AIP, which connects frontier models directly to enterprise data streams, this creates a surge in data that Palantir can then contextualize and provide value for decision making for its customers. There is already more evidence below the headline figures that Palantir is benefiting from increasing enterprise AI adoption, such as Palantir’s quarterly deals closed. Palantir closed 201 deals of >$1 million in Q3, up 30% QoQ; this was a sharp acceleration from 13% QoQ growth in Q2. Palantir also signed more deals in all its cohorts (>$1M, >$5M and >$10M) in Q3 than it had in Q2.  

To put deal growth in the context of NRR, Palantir has signed 629 >$1M deals over the last twelve months, up more than 61% from 390 in the same period last year – with none of these new deals appearing yet in NRR. 

Chart showing Palantir’s quarterly deals closed accelerating sharply to 30% sequential growth in Q3, up from 13% in Q2, highlighting strong momentum in deal activity.

Palantir’s quarterly deals closed accelerated sharply to 30% sequential growth in Q3, up from 13% in Q2. 

Source: Company IR 

However, there were a few blemishes within key metrics – billings growth decelerated from 53.5% YoY in Q2 to 48.8% YoY in Q3 to $1.23 billion, with QoQ growth also decelerating from 21.8% QoQ to 11.2% QoQ. RPO growth decelerated from 77% YoY and 27% QoQ in Q2 to 66% YoY and 8% QoQ in Q3 at $2.60 billion. 

Margins – Q3’s Rule of 40 of 114%, from 94% in Q2 

Margins strengthened considerably in the quarter, with adjusted operating margin surpassing 50% with more expansion guided for Q4. Palantir’s Rule of 40 score (revenue growth + adj operating margin) expanded to a wild 114%, up from 94% last quarter and 68% last Q3.  

Chart showing Palantir’s Rule of 40 score accelerating to 114% in Q3, up from 94% in the previous quarter and 68% in Q3 2024, highlighting strong profitability and growth performance.

Palantir’s Rule of 40 score accelerated to 114%, from 94% last quarter and 68% in Q3 2024.   

Source: Company IR 

Gross margin was 82% in Q3, up one point QoQ and two points YoY, while adjusted gross margin was 84%, up two points YoY and QoQ. 

GAAP operating margin was 33%, an impressive 6 point QoQ and 17-point YoY expansion. Adjusted operating margin was 51%, breaking past 50% for the first time and up 5 points QoQ and 13 points YoY. For Q4, Palantir guided for adjusted operating margin to be 52%, showcasing its ability to drive strong margin expansion alongside swift revenue acceleration. Full year adjusted operating margin guidance was raised from 46% to 49%.  

GAAP net margin was 40%, up 7 points QoQ and 20 points YoY. Adjusted net margin was 45%, up 5 points QoQ and 12 points YoY. Palantir is one of the few, if not only, tech companies to have 40% GAAP net margins with revenue growth accelerating above 60%. 

Adjusted EPS grew by 110% 

Palantir reported $0.18 in GAAP EPS in the quarter, up 200% YoY, while adjusted EPS was $0.21, beating estimates by 25.5% and rising 110% YoY. Palantir’s adjusted EPS is expected to grow 64.1% YoY to $0.23 in Q4 and 59.4% YoY to $0.21 in Q1 2026. 

For FY25, Palantir is expected to earn $0.72 in adjusted EPS, up 76.7% YoY and then 39.5% YoY to $1.01 in FY26. 

Strong Balance Sheet 

Palantir stock has strong cash flows, though cash flow margins dipped on a YoY and QoQ basis. Q3 operating cash flows grew by 20.9% YoY to $507.7 million for a 43% margin, down from a 54% margin in Q2 and 58% in the year ago quarter.  

Adjusted free cash flow grew by 24.3% YoY to $539.9 million for a 46% margin, down from 57% in Q2 and 60% in the year ago quarter. Palantir raised its adjusted free cash flow guidance for the year to $1.9 to $2.1 billion, or a 45.5% margin, up from a 42.8% margin previously. 

Cash and marketable securities totaled $6.4 billion and debt remained zero. 

Valuation 

To many investors on social media, Palantir’s valuation remains a hot topic, with it blowing past norms and reaching the upper echelons of the stratosphere for what is considered ‘typical’ for SaaS stocks. Put it this way — how often do you see a software company re-accelerate revenue from 13% growth a couple of years to 60% in nine quarters organically and sustainably, while increasing both profitability and cash flows.  

Palantir is now trading at a forward P/S ratio of 67.5, making other best-of-breed cloud stocks like CrowdStrike and Cloudflare cheap at 24.7 and 23.4, respectively. On the bottom-line, it is trading at a forward P/E of 176.5, slightly below Snowflake’s forward P/E ratio of 180.4 and higher than Cloudflare’s and CrowdStrike’s forward P/E ratio of 155.3 and 126.6, respectively.  

Source: YChartsYCharts 

Given Palantir is trading at a forward P/S ratio of 67.5, there are certainly easier stocks to own in 2026. Within AI, specific niches are booming such as AI networking, AI energy and AI memory plays that are trading far lower than Palantir. 

Recently, Palantir was upgraded by Citi as it believes that the commercial and government super cycle is coming this year. Analyst Tyler Radke said, “We are upgrading PLTR to Buy/High-Risk from Neutral and raising estimates and our target price to $235.” He further added, “Shares have minted spectacular returns over the last few years as a vicious growth acceleration and equally impressive margin expansion has 'broken' traditional rule-of-40 and valuation frameworks. Despite our 2025/26 revenue numbers up 10%+ since mid-year, the stock is ~flat. Our upgrade is premised on the view that 2026 is poised to be another year of significant positive estimate revisions, with recent CIO + industry conversations suggesting AI budget and use cases are accelerating in the enterprise. We also see significant tailwinds in the Government, driven by accelerating defense budgets and modernization urgency.” 

Conclusion 

Palantir delivered one of the strongest earnings reports across the tech sector in Q3, with revenue growth of nearly 63% and a strong 28-point acceleration in its AI-driven US Commercial segment. Since the start of 2025, revenue growth has accelerated more than 23 points, with US Commercial revenue accelerating 50 points. Trends in other key metrics such as NRR and quarterly deals closed remain robust, although billings and RPO growth decelerated in the quarter. However, what Palantir has to contend with is an extended valuation, in uncharted territory even by its own measures, and where the market will ultimately price its shares. 

Our Premium members received a 15,000 word report outlining the Top 15 AI Stocks for Q4 of 2025 with many stocks seeing higher returns in Q4 than Palantir. Our Premium members will be receiving the Top 15 AI Stocks for Q1 2026 in January plus technical setups for potential entries. Sign up now to find out which AI stocks rank higher than Palantir. Join now.Top 15 AI Stocks for Q4 of 2025 with many stocks seeing higher returns in Q4 than Palantir. Our Premium members will be receiving the Top 15 AI Stocks for Q1 2026 in January plus technical setups for potential entries. Sign up now to find out which AI stocks rank higher than Palantir. Join now.

Royston Roche and Damien Robbins, Equity Analysts at I/O Fund contributed to this analysis.

Please note: The I/O Fund conducts research and draws conclusions for the company’s portfolio. We then share that information with our readers and offer real-time trade notifications. This is not a guarantee of a stock’s performance and it is not financial advice. Please consult your personal financial advisor before buying any stock in the companies mentioned in this analysis. I/O Fund may own stocks pictured in the charts.

Recommended Reading:
  • Top 10 Tech Stocks of 2025: How the AI Trade Defied the Skeptics
  • Broadcom Stock: The Silent Winner in the AI Monetization Supercycle
  • The AI Revenue Leader Nobody Is Talking About—Second Only to Nvidia Stock
  • AI Stocks & Nvidia: I/O Fund’s 2025 Tech Media Highlights
Posted in AI StocksLeave a Comment on Palantir Stock 2026 Forecast: Is Its High Valuation Sustainable?

Top 10 Tech Stocks of 2025: How the AI Trade Defied the Skeptics

Posted on January 8, 2026June 30, 2026 by io-fund
Top 10 Tech Stocks of 2025: How the AI Trade Defied the Skeptics

The stock market in 2025 was a high-stakes tug-of-war between geopolitical tensions and the AI trade. Headlines were dominated by the DeepSeek fears, trade wars, tariffs, and persistent whispers of the AI bubble. However, the AI trade proved to be more than just hype; it became a cornerstone of the market. Defying the skeptics, the market wrapped up another year of growth with the Nasdaq-100 index finishing up 20.2%, the S&P 500 rising 16.4%, and the Dow Jones Industrial Average gaining 13% in 2025. 

We think it’s important to pause and draw parallels among the stocks that performed well in 2025 to form an opinion on what might perform well in 2026, as many of the year’s top performers shared similar fundamental improvements or had similar thematic tailwinds, such as AI. 

Below, we review the top 10 tech stocks of 2025, selected based on their price action, fundamentals, and presence within leading tech themes. Choosing a top 10 means many great stocks were left off this list, yet this sample helps form conclusions about how 2025 shaped up versus past years, centered on leading, core thematic opportunities. 

Read about our Top 5 Stocks from 2024 here, 2023 here and from 2022 here – many of which went on to lead the following years.here, 2023 here and from 2022 here – many of which went on to lead the following years. 

SanDisk (SNDK): The S&P 500’s Top Performer of 2025  

SanDisk has claimed the crown as the S&P 500’s top performer, delivering a stunning 559.4% return that outpaced the broader market by a wide margin. The storage pioneer, which launched the first solid state drive (SSD) in 1991, is now capitalizing on the exponential demand for AI flash storage products. Western Digital bought SanDisk in 2016 and spun it off in February 2025. The rally this year was fueled by a "perfect storm" of strong fundamentals and technical catalysts: a massive spike in demand for AI flash storage and the stock’s inclusion in the S&P 500 index in November. The latter triggered a wave of mandatory buying from index-tracking funds, catapulting the stock to the top of the leaderboard. 

SanDisk’s revenue growth has accelerated over the last three quarters, primarily driven by the strong demand for flash storage in AI data centers. AI workloads require massive volumes of high-performance, reliable storage, directly boosting demand for the company’s NAND flash products. In addition, the company is benefiting from a tightening memory market and has recently raised the NAND flash prices by a significant 50% for November.

mid

The company’s Q3 revenue grew by 22.6% YoY and 21.4% QoQ to $2.31 billion. The revenue growth accelerated by 14.6 percentage points from 8% growth reported in Q2. SanDisk had also reported an acceleration in Q2 revenue growth by 8.6 percentage points. The company’s Q4 guidance of $2.60 billion implies a YoY growth of 38.6% and 12.7% QoQ, marking the fourth consecutive quarter of YoY revenue growth acceleration, reflecting robust AI-driven demand and improved pricing. 

SanDisk reports 22.6% year-over-year revenue growth in Q3 2025, highlighting accelerating momentum as data center demand fuels the AI storage super cycle

SanDisk reported 22.6% YoY revenue growth in Q3 2025, signaling accelerating momentum as the data center demand boosts AI storage super cycle 

Source: Seeking Alpha 

The company’s margins have also expanded sequentially this year on higher memory prices and better product-margin mix, though margins were down YoY in Q3. The company also guided strong margins for the next quarter, with gross margins expected to expand 12 percentage points QoQ and 9.5 percentage points YoY to 41.8%, primarily reflecting higher prices. Strong free cash flow generation enabled SanDisk to reach a net cash position, six months ahead of its February Investor Day target. 

SanDisk’s rally this year has been underpinned by genuine fundamental improvement, including accelerating revenue and expanding margins. While index inclusion increased the upside, the company’s pricing power and exposure to AI-driven storage demand suggest its performance is grounded in durable fundamental tailwinds. 

Bloom Energy (BE): Solving the AI Data Center Power Bottleneck 

Bloom Energy emerged as one of the standout stocks of 2025, with a return of 291.2%. The market increasingly recognized its strategic role in addressing one of AI’s biggest bottlenecks: reliable, scalable power. Bloom Energy is a beneficiary of surging AI data center demand, particularly as hyperscalers race to procure clean energy amid grid capacity constraints, as its fuel cells are very efficient and are currently producing 10x power within the same footprint than produced previously a decade ago. 

Major highlights include signing a deal in July with Oracle to supply fuel cells for Oracle’s Cloud Infrastructure data centers. Similarly, in October, the company announced a $5 billion strategic partnership with Brookfield Asset Management to become the preferred on-site power provider for Brookfield's global artificial intelligence factories. Due to robust AI demand, the company also plans to double factory capacity to 2 gigawatts a year by the end of this year.  

Bloom Energy’s Q3 revenue grew by 57.1% YoY and 29.4% QoQ growth to $519.1 million, accelerating 37.6 percentage points from the previous quarter’s YoY growth of 19.5%. The company’s fourth consecutive record revenue was driven by strong demand for its fuel cell technology powering AI data centers.  

Chart showing Bloom Energy’s record revenue turnaround from a –17.5% decline in Q3 2024 to 57.1% growth in Q3 2025, driven by strong demand for fuel cell technology powering AI data centers

Bloom Energy (BE) is reporting record revenue driven by strong demand for its fuel cell technology powering AI data centers. The chart illustrates a significant turnaround from a (–17.5%) decline in Q3 2024 to 57.1% growth in Q3 2025. 

Source: Company IR 

Bloom Energy’s margins are improving, primarily driven by operational efficiency, product cost improvements, and operating leverage. Bloom Energy is fundamentally transforming into a stronger company, as its GAAP operating margins were previously deep in the red, in double digits. Similarly, the company reported positive operating cash flows and free cash flows in Q3, after reporting negative cash flows in the first two quarters of the year. Strong cash flows are expected in Q4, further boosting investor optimism.  

Western Digital (WDC): #2 Best Performer of S&P 500 Driven by AI HDD Demand  

Western Digital stock sprang a major surprise, ranking as the second-best performer in the S&P 500 index with a return of 282.3%. The company’s CEO, Irwing Tan, highlighted the company’s niche during the Q3 earnings call, “Data is the fuel that powers AI and it is HDDs that provide the most reliable, scalable and cost-effective data storage solution, playing a vital role in storing the ever-increasing zettabytes of data created by the AI-driven economy.” The company is benefiting from robust demand from hyperscalers for its higher-capacity hard disk drives. Western Digital has solid visibility, and 5 of its large customers have placed purchase orders covering all of 2026, while one of its largest hyperscale customers has signed an agreement covering all of 2027. 

The company’s Q3 revenue grew by 27.4% YoY to $2.82 billion. The AI-related demand has turned the company’s fortunes, and it has reported its fourth consecutive quarter of YoY growth after a dull run of 10 consecutive quarters of negative growth. Margins are witnessing a turnaround, with gross margins improving by 710 basis points YoY and 250 basis points QoQ to 43.5%. The improved gross margin was primarily driven by a better product mix, higher-capacity drives, and cost controls. Operating margin also improved by 1300 basis points YoY and 200 basis points QoQ to 28.1% driven by operating leverage. AI initiatives have also led to gains in manufacturing productivity. Western Digital increased its dividend by 25% to $0.125 per share during Q3 results and the company’s inclusion in the Nasdaq-100 index also boosted the stock price in the last quarter of the year. 

Chart showing Western Digital’s Q3 revenue growth of 27.4%, fueled by strong hyperscaler demand for high-capacity hard disk drives, the most cost-effective solution for massive AI-generated datasets

Source: YChartsYCharts 

WDC Q3 revenue grew by 27.4% as it benefited from robust demand from hyperscalers for its higher-capacity hard disk drives, the most cost-effective solution for massive AI-generated datasets. 

Micron (MU): The Nasdaq-100's Top Performer of 2025 

Micron is the top-performing stock in the Nasdaq-100 index, posting a return of 239.1%. Technically, it ranks second, as Western Digital was added to the index on December 22; however, Western Digital traded for only one week after its inclusion.  

Micron is no longer tied to consumer device cycles. Instead, high bandwidth memory (HBM) has led to higher margins and multi-year supplier agreements, resulting in a leveraged approach to participate in the AI infrastructure buildout. We discussed in depth in our article, Micron Stock Up 120% YTD: What the HBM Memory Leader Plans for 2026, that the historically cyclical memory market is seeing a newfound resurgence from AI that is strong enough to transform commoditized hardware into a secular trend as the AI economy is built out.  AI servers use more DRAM and NAND than traditional servers, relying heavily on high-bandwidth memory (HBM) for training and inference.   

Micron topped analysts' estimates in each of the four quarters reported in 2025, benefiting from the AI-driven memory super cycle. Micron’s FQ1 revenue ending November grew by 56.7% YoY and 20.6% QoQ to a record $13.64 billion, accelerating by 10.7 percentage points from 46% growth reported in the previous quarter. The company’s gross margins improved 17.6 percentage points YoY and 11.3 percentage points QoQ to 56%, driven by an improved product mix and better pricing due to a supply-demand imbalance. Micron also reported record adjusted free cash flow of $3.9 billion, exceeding the prior record free cash flow in FQ4 2018 by over 20%. Management anticipates record revenue, margins, and free cash flows in the next quarter and FY2026, further reinforcing confidence in the durability of Micron’s AI-driven growth trajectory. 

Chart showing Micron’s FQ1 revenue surge to 56.7% year-over-year growth, driven by record High-Bandwidth Memory (HBM) demand for next-generation AI accelerators in the AI-driven memory super cycle

Micron’s FQ1 revenue accelerated to 56.7% YoY growth as it benefits from the AI-driven memory super cycle, driven by record High-Bandwidth Memory (HBM) demand for next-gen AI accelerators.  

Source: YChartsYCharts 

This past year has proven that HBM memory is a component multiplier when compared to GPUs in the hardware stack, as HBM scales faster than GPUs on a per-system basis. Each generation of GPU, from Hopper to Blackwell to Rubin, requires more memory capacity and bandwidth per chip. Therefore, there is compounded effect, as the number of GPUs rises combined with each GPU system requiring more HBM per package.   

I/O Fund has a history of buying stocks at low prices. Our Nvidia’s first entry was at $3.15 in December 2018, and since then, we have been able to issue buy alerts around major lows – including $10.85 on October 13th, 2022, as well as $94.48 on April 4th, 2025, and again at $87.99 on April 7th, 2025. We discuss key technical levels in our weekly webinars for Advanced Market Signals Tier members.  

Subscribe to Advanced Market Signals to get real-time trade alerts for every entry and exit, portfolio access, and join weekly live webinars. Join now.Subscribe to Advanced Market Signals to get real-time trade alerts for every entry and exit, portfolio access, and join weekly live webinars.Advanced Market Signals to get real-time trade alerts for every entry and exit, portfolio access, and join weekly live webinars. Join now.Join now.

Robinhood (HOOD): Among the S&P 500’s Top Performers of 2025 

Robinhood stock continued its bull run, rising 203.5% in 2025. Along with strong results, the company’s new products, such as Prediction Markets that allow users to trade on event outcomes across politics, sports, and economics, have been very successful. Prediction markets have become the company’s fastest-growing product line by revenue ever, with 11 billion contracts traded by more than 1 million customers. Furthermore, Robinhood accelerated its global expansion by acquiring crypto exchange Bitstamp for $200 million in June and announced in May that it will buy Canadian crypto platform WonderFi for $179 million, thereby gaining critical regulatory licenses and a robust infrastructure to scale its digital asset services internationally. Robinhood stock received an additional tailwind from passive index-fund buying after its inclusion in the S&P 500 in September 2025. 

Robinhood’s Q3 revenue grew by 100% YoY to a record $1.27 billion, driven by 129% YoY growth in transaction-based revenues. The company’s net deposits in the quarter were a record $20.4 billion, and Robinhood Gold subscribers reached a record 3.9 million, up 75% YoY. In Q3, two more businesses, Prediction Markets and Bitstamp, surpassed $100 million in annualized revenue, taking the total to 11 business lines. Based on October volumes, Prediction Markets is on a $300 million run rate. Robinhood has also consistently delivered GAAP profitability, with net income growing 271% YoY and 44% QoQ to $556 million in Q3. Robinhood’s 2025 stock performance reflects a company that has successfully evolved into a diversified, profitable financial platform with multiple high-growth revenue streams. 

Chart showing Robinhood’s record Q3 2025 revenue of $1.27 billion, a 100% year-over-year increase driven by a 129% jump in transaction-based revenues

Robinhood (HOOD) Record Q3 2025 Revenue: 100% YoY Surge to $1.27 billion. This chart illustrates a massive revenue doubling, driven by a 129% jump in transaction-based revenues.  

Source: Seeking Alpha 

Digital Turbine (APPS): AI Ad-Tech Top Performer of 2025  

Ad-tech company Digital Turbine’s stock rose 195.9% in 2025 after three years of negative returns. Digital Turbine’s revenue growth has accelerated in recent quarters, with the company returning to positive year-over-year revenue growth in Q1 2025 after a prolonged period of declines. The company’s margins have also turned around, and it reported its first positive operating margin in Q3 in about 3 years. Digital Turbine also refinanced its debt in September 2025, thereby extending its debt maturities.   

The company’s Q3 revenue grew by 18.2% YoY to $140.4 million, accelerating by 7.2 percentage points from 11% growth in the previous quarter. The company benefited from strong advertising demand and international growth, and management also highlighted meaningful progress on its first-party data and AI-driven machine learning platform during the earnings call, laying the groundwork for better targeting and improved returns on investment for advertisers.    

The company reported an operating profit of $6.5 million compared to a loss of (-$13.5 million) in the same period last year, its first operating profit in about three years. Digital Turbine’s adjusted EBITDA also grew by solid 78% YoY to $27.2 million, driven by strong operating leverage. Due to improved visibility, management also increased the full-year revenue and adjusted EBITDA guidance for FY2026, ending March 2026. 

Chart showing Digital Turbine’s Q3 revenue growth of 18.2% year-over-year to $140.4 million, accelerating from 11% in the previous quarter, driven by AI-powered ad-tech demand

Source: YChartsYCharts 

Digital Turbine (APPS) Revenue Breakout Signals AI Ad-Tech Turnaround: Q3 revenue grew by 18.2% YoY to $140.4 million, accelerating by 7.2 percentage points from 11% growth in the previous quarter. 

Palantir (PLTR): The S&P 500’s Standout AI Software Leader of 2025 

Palantir joins the list of I/O Fund's Top Tech Stocks for a third-year running, with shares rising 135% in 2025. I/O Fund’s editorial previously pointed out that Palantir was “one of the rare few that sees AI drive both real returns for its business and real value for its customers,” as it continues to crush its software competitors in AI-related growth.   

Palantir’s Artificial Intelligence Platform (AIP) has driven a significant revenue acceleration following its launch, with profitability also expanding – a rare combination for growth software stocks. AIP is a cloud-agnostic and model-agnostic platform that connects AI with existing systems and operations. AIP goes beyond what LLMs can deliver on their own by embedding models in workflows and logic. The value creation comes from being able to work with incomplete datasets through the ontology layer, while also offering a level of reasoning that goes far beyond analysing the data itself.    

Palantir has capitalized on the AI software opportunity at hand via AIP’s unique value proposition, its scalability, and versatility. AIP’s scalability and flexibility continue to attract larger and more ambitious commercial engagements. In the software universe, Palantir is in rare territory, as one of the few cloud stocks seeing meaningful AI growth across multiple key metrics.  

The company’s revenue growth has accelerated over the last 9 quarters. Q3 revenue grew by 62.8% YoY and 17.7% QoQ to $1.18 billion. Revenue growth accelerated 14.8 percentage points from 48% in Q2, the largest sequential acceleration to date and marking Palantir’s highest growth rate since going public. The strong growth was driven by unwavering momentum in US Commercial segment, generally seen as the primary vector for its AIP-driven growth, with revenue accelerating by 28 percentage points to 121% YoY in Q3.  

Margins strengthened considerably in Q3, with an adjusted operating margin of 51%. Palantir’s Rule of 40 score (revenue growth + adj operating margin) expanded to a wild 114%, up from 94% last quarter and 68% in Q3 2024.   

Chart showing Palantir’s nine-quarter revenue acceleration reaching a record 62.8% year-over-year growth in Q3 2025, the highest since IPO, powered by its Artificial Intelligence Platform (AIP)

Palantir (PLTR) Revenue YoY Growth: 9-Quarter Acceleration Hits Record 62.8% in Q3 2025, marking the highest growth rate since its IPO. This chart highlights the unprecedented revenue acceleration driven by Palantir’s Artificial Intelligence Platform (AIP).  

Source: YCharts YCharts 

GE Vernova (GEV): Powering the AI Grid with 98.7% Return 

GE Vernova is part of the spinoff that General Electric first announced in 2021 and later completed in 2024. The company is the world’s largest gas turbine supplier, at 25% ahead of Schneider at 24%. GE Vernova is a major beneficiary of the increasing energy requirements from the global AI infrastructure build-out, positioning the company as a key beneficiary of this secular trend. The stock rose 98.7% in 2025. 25% of global electricity was generated using the company’s equipment. Due to a sudden surge in AI-related electricity demand, turbine orders are vastly outpacing demand, and the company’s order book is sold out through 2028. 

The stock also got a boost after the company’s 2025 investor update. The company raised the by 2028 revenue outlook to $52 billion from the prior $45 billion. Similarly, the adjusted EBITDA margin was raised to 20% from the prior 14%, and cumulative 2025 to 2028 free cash flow was raised to over $22 billion from the prior over $14 billion. GE Vernova expects to grow total backlog from $135 billion to $200 billion by year-end 2028, including doubling the size of electrification backlog from $30 billion to $60 billion. The Board of Directors also increased the share repurchase authorization from $6 billion to $10 billion and doubled the annual dividend to $2 per share. 

The company’s Q3 revenue grew by 11.8% YoY to $10 billion. Operating margin improved on a YoY basis and came at 3.7% compared to (-4%) in the same period last year. The company also announced that it will acquire the remaining 50% stake in Prolec GE, its joint venture with Xignux for $5.275 billion and the transaction is expected to close in mid-2026.

Chart showing GE Vernova’s Q3 revenue growth of 11.8% year-over-year to $10 billion, surpassing analysts’ expectations and driven by the AI Energy Supercycle

GE Vernova (GEV) Q3 revenue grew by 11.8% YoY to $10 billion beating analysts' expectations and growth was driven by the AI Energy Supercycle. 

Source: YChartsYCharts 

#9: Dominating the AI Optical Interconnect and EML Market 

This little-known optical technology supplier became a must-own AI beneficiary in 2025—surging 339.1% as Nvidia’s Blackwell rollout and explosive data-center demand rewrote its growth and profitability story. The company supplies components for datacom transceivers and optical interconnects. It has a differentiated technology that has caught the attention of AI heavyweights such as Nvidia, and the company’s Electro-absorption modulated lasers (EMLs) are a critical component with Nvidia’s Blackwell generation. Similarly, optical interconnects help data centers accelerate data throughput between data centers and inside the data center between servers or racks, while reducing latency and power consumption. AI is driving cloud demand higher among hyperscalers, leading to more data being created and processed, thereby fueling a need for interconnects to support high-speed, low-power data transmission in data centers. To find out which company it is, sign up early here.    

Similar to SanDisk, the company reported strong revenue growth acceleration in 2025 from 16% YoY growth in Q1 to 55.9% in Q2 and 58.4% in Q3. Revenue growth is expected to further accelerate to 60.6% and 62.1% in the next two quarters. The company also surpassed its guidance of over $500 million revenue a quarter earlier than its expectations, reporting a record $533.8 million in Q3. The company’s Q4 guidance of $650 million is significant as it will reach its $600 million quarterly revenue target two quarters ahead of schedule, primarily reflecting accelerating AI-driven demand.  

Source: YCharts 

The company reported its first positive operating margin in the last three years. The company reported an operating margin of 1.3% in Q3 compared to (-24.5%) in the same period last year. The company is witnessing a turnaround in margins driven by strong operating leverage, higher pricing due to the supply-demand imbalance, improved manufacturing efficiencies, and a favorable product mix. Margins are expected to improve further in 2026, with premium pricing from supply-demand imbalances serving as a strong lever for margin expansion.  

AI-driven demand translated into rapidly accelerating revenue growth, early achievement of revenue targets, and a meaningful turnaround in profitability, significantly strengthening investor confidence in 2025. 

 #10: The S&P 500’s Top-Performing AI Ad-Tech Stock  

This stock soared 108.1% in 2025 as its AI-powered advertising engine accomplished the unthinkable—reviving a stagnant mobile gaming ads market and delivering extraordinary profitability. The company also divested its gaming assets segment in Q2 2025 and is now a pure-play ad-tech stock. The high-growth, high-margin advertising business that drove the strong returns over the past few years is now the company’s sole focus. To find out which company it is, sign up early here.    

The stock was added to the S&P 500 index in September. The stock also received a further boost as it launched the self-service platform in October, which will help the company tap into e-commerce ad budgets. Management is confident in maintaining 20% to 30% YoY growth for the foreseeable future, and incremental growth from the self-service platform could help exceed this baseline. 

The company’s Q3 revenue grew by 68.2% YoY and 11.6% QoQ to $1.41 billion. The growth was primarily driven by the strong gaming advertising revenue. The company’s revenue growth is only part of the story, whereas the bottom line is what sets this stock apart. Its margin expansion is truly outstanding, primarily driven by strong operating leverage. The company’s AI-powered advertising engine, launched in Q2 2023, served as a game-changer, driving strong revenue and profits. The company’s operating margin has increased from 17.5% in Q2 2023 to a remarkable 76.8% in Q3 2025. Adjusted EBITDA grew by 79% YoY to $1.16 billion with an outstanding adjusted EBITDA margin of 82%. The company has an exceptionally strong cash flow margin profile, primarily driven by strong profits, and free cash flows grew by 92.4% YoY to $1.05 billion in Q3.  

Source: Company IR 

Conclusion 

Reflecting on 2025 is vital; it provides the blueprint for 2026. While 'winners keep winning,' our goal isn't to chase a carbon copy of last year, but to identify the structural patterns that drove that success. The 2025 leaders proved they could thrive despite macroeconomic headwinds, driven by revenue acceleration and operating leverage that turned high demand into massive margin expansion. 

Most importantly, 2025 shifted the AI narrative. The focus rotated toward the 'physical' layers of the stack, revealing that memory, storage, and energy are now the industry's critical bottlenecks. As we enter 2026, we are watching for the next set of companies that can turn scarcity into a competitive moat. 

Subscribe to Advanced Market Signals to get real-time trade alerts for every entry and exit, portfolio access, and join weekly live webinars. Join now.Subscribe to Advanced Market Signals to get real-time trade alerts for every entry and exit, portfolio access, and join weekly live webinars.Advanced Market Signals to get real-time trade alerts for every entry and exit, portfolio access, and join weekly live webinars. Join now.Join now.

Please note: The I/O Fund conducts research and draws conclusions for the company’s portfolio. We then share that information with our readers and offer real-time trade notifications. This is not a guarantee of a stock’s performance and it is not financial advice. Please consult your personal financial advisor before buying any stock in the companies mentioned in this analysis. I/O Fund own shares in NVDA, MU, BE, and GEV at the time of writing.

Recommended Reading:

  • Broadcom Stock: The Silent Winner in the AI Monetization Supercycle
  • The AI Revenue Leader Nobody Is Talking About—Second Only to Nvidia Stock
  • AI Stocks & Nvidia: I/O Fund’s 2025 Tech Media Highlights
  • Nvidia & Beyond: I/O Fund’s Best Free AI Stock Research in 2025
Posted in AI StocksLeave a Comment on Top 10 Tech Stocks of 2025: How the AI Trade Defied the Skeptics

Nvidia & Beyond: I/O Fund’s Best Free AI Stock Research in 2025  

Posted on December 31, 2025June 30, 2026 by io-fund
Nvidia & Beyond: I/O Fund’s Best Free AI Stock Research in 2025  

We describe our newsletter as “free,” however the resources required to produce the research behind our weekly analysis are substantial. Delivering early, actionable insights consistently—and making them available to the public—is a deliberate investment by our firm and an approach that remains uncommon in traditional Wall Street research.  

While we occasionally highlight individual examples to illustrate accuracy, the broader value becomes clearer when viewed over a full year. Across that period, many of our articles identified complex market inflection points and highlighted companies early in their cycles—long before their performance became evident by a mainstream investor audience. 

For example, we offered immense benefit by preparing our readers for a local top in AI stocks in February, ahead of the April rout (reference articles below). Although the value of this has passed, our work in Q2-Q4 has only strengthened our strong 5-year track record. More recently, in Q3, the I/O Fund nailed the Bitcoin top at a time when virtually nobody else was calling it (quite the opposite; we literally challenged “the herd” in our article headline) —this materialized to become an accurate view that continues to play out as soft price action in crypto persists. Given the volatility of this asset class, the value in timing a selloff cannot be overstated.  

A few weeks ago, our Q4 series on the AI Monetization Wave defended the AI opportunity by stating the era of monetization has not yet begun; an argument in sharp opposition to growing AI bubble fears. To help illustrate this, we point toward some companies that are quietly monetizing AI into the tens of billions – which is by far, the fastest growth curve the technology industry has ever seen in a 2-3 year time span. Interesting enough, the mainstream narrative is not able to recognize this. 

These points, and many more like it, uniquely came from the I/O Fund – and we openly shared them with our readers in 2025. Below, we break down quarter-by-quarter the research we provided to our readers this past year – for free – including some critical research we believe is fully in play as we position for 2026.  

I/O Fund’s AI Stock Forecast in Q1 2025: NVDA, SMH & QQQ Sell-off 

Predicting the 2025 AI Correction: How the I/O Fund Identified the Peak 

The I/O Fund has built its reputation on identifying major market trends before they materialize. In the February feature, ‘AI Stocks Signal a Correction Before a Buying Opportunity Emerges’ Co-Portfolio Manager Knox Ridley warned of rising volatility for 2025. He noted that the market rally lacked broad support, creating a risky divergence in which stocks trend higher even as key sectors fail to reach new highs.  

For the I/O Fund, this served as a vital cautionary signal in an overheating market – especially given that the I/O Fund is a leading AI stock portfolio. Two months later, AI stocks sold off heavily with Nvidia stock down (25%), while VanEck Semiconductor ETF was down (22%), and Invesco QQQ ETF was down (17%) in a little over a month after we published the cautionary analysis.

Line chart comparing NVDA, SMH, and QQQ returns, showing Nvidia declining 25% after an AI market peak warning.

Source:YChartsYCharts 

NVDA, SMH, and QQQ Performance: Visualizing the (25%) Nvidia drawdown after I/O Fund’s AI market peak warning 

I/O Fund’s Nvidia Strategy: Navigating DeepSeek & Blackwell Delays  

The I/O Fund closely tracks the supply chain data and monitors the technical levels of stocks to help our premium members make informed decisions. Despite Beth Kindig being a well-established Nvidia bull, her firm took a balanced approach headed into 2025 with yet another warning that the AI leader was likely to trade meaningfully lower due to technical signals. The analysis ‘Where I Plan To Buy Nvidia Stock Next’ provided a buy plan for our readers and stated that Nvidia could trade below $100. The analysis played out, as we were able to buy Nvidia at $87.99, issuing a real-time trade alert that has returned 92% on that tranche since early April. 

Most importantly we continued our coverage during the market sell-off caused by DeepSeek fears in our article, ‘DeepSeek Creates Buying Opportunity for Nvidia Stock.’ We reassured our readers that DeepSeek’s cost-efficient AI training is a long-term catalyst for Nvidia stock. We stated, “If DeepSeek’s breakthroughs are truly the key to ushering in a new paradigm of AI training and ultimately AI democratization from cost reductions, it will not be a death sentence for Nvidia; in fact, quite the opposite.” Despite many stating that DeepSeek was a defining moment for AI, and stirring up the panic, the Chinese LLM is hardly spoken of today.

mid

In Q1, a few Nvidia suppliers were providing mixed guidance on the timing of Nvidia’s Blackwell GB200 systems. We published an article, ‘Nvidia Suppliers Send Mixed Signals for Delays on GB200 Systems – What It Means for NVDA Stock’, to help Nvidia investors understand the changes in the supplier commentaries and why Nvidia was likely to take a pause Q1-Q2. Later, we identified Q3 as the likely inflection point for Nvidia, which later became the strongest earnings report in nearly two years. 

I/O Fund has a history of buying Nvidia at low prices. The first entry was $3.15 in December 2018, and since then, we have been able to issue buy alerts around major lows – including $10.85 on October 13th, 2022, as well as $94.48 on April 4th, 2025, and again at $87.99 on April 7th, 2025. The I/O Fund discusses key technical levels in our weekly webinars for Advanced Market Signals Tier members.  

Subscribe to Advanced Market Signals to get real-time trade alerts for every entry and exit, portfolio access, and join weekly live webinars.Advanced Market Signals to get real-time trade alerts for every entry and exit, portfolio access, and join weekly live webinars.

Q2: Navigating the AI Stock Recovery After the April Bottom 

The I/O Fund Logged 23 buys in March and April of 2025, Including NVDA and ALAB 

After the April bottom, AI stocks came roaring back with a vengeance. In tech investing, timing is the difference between average and extraordinary returns. For example, if an investor bought Astera Labs at the beginning of the year, the return would be only 27% compared to buying the stock at the beginning of April would have a staggering gain of 269% (as of today), a difference of 242% within a short period of one quarter. This is exactly what the I/O Fund did, adding to current positions like Nvidia, while also building new positions in four additional lesser-known AI stocks with strong outperformance. 

Going back to Astera Labs, we knew that we wanted to own ALAB; however, our system was telling us that we should wait, as the odds were high heading into 2025 that we could get lower prices. We began to layer in at $79.73 on January 27th, when ALAB was more than 45% off its highs. We further issued 4 additional buy alerts, layering in at key levels, completing our accumulation at $51.10 on April 4th. Our system of using technical analysis to layer into a position gave us an 11% position in ALAB with a combined cost basis of $69.42, which made it one of our biggest winners of the year, with a 140% return in 2025.  

Performance chart of Astera Labs (ALAB) showing a 269% rally from the April low versus a 27% YTD return in 2025.

Source: I/O Fund 

Astera Labs (ALAB) Stock Performance: 269% Gains Following the April Bottom compare this to 27% return YTD in 2025. 

I/O Fund’s Co-Portfolio Manager Knox Ridley discussed in May that his analysis foresaw the S&P 500 index reaching a new all-time high later in the year in the article, ‘Historic Market Uncertainty Meets $7 Trillion Debt Wall: What Comes Next for the S&P 500.’ Knox utilized a data-driven approach by identifying a bullish shift in the Advance-Decline line –signalling healthy market breadth. He also leveraged Fibonacci levels to gauge the strength of the recovery and along with that, used better-than-expected earnings signals to predict an all-time high later in 2025. Fast forward to December 2025, and Knox’s forecast has become reality as the S&P 500 officially surged to its new all-time high. 

AMD Outperformed Nvidia in 2025 

In June, AMD offered more details on the release of their groundbreaking GPUs with little fanfare in the markets – which is par for the course as AMD has a history of being forgotten about until the company can no longer be ignored. In the analysis, ‘AMD vs Nvidia: The AI Stock That Could Win by 2028,’ we offered our readers a timely discussion on AMD's strengths and how thinking AMD is down for the count could be a costly mistake. AMD stock is up 68% compared to Nvidia’s return of 31% during this period, a difference of 37%.  

Performance chart showing AMD’s 37% outperformance versus Nvidia after the I/O Fund June market analysis.

Source: YChartsYCharts 

Visualizing AMD’s 37% Outperformance Over Nvidia Post-I/O Fund June Analysis 

Broadcom’s Silent Rise: Building the Backbone of AI Inference 

While everyone is focused on the Nvidia stock, Broadcom is quietly cementing its position for the second spot. The company specializes in custom silicon and networking required for the next phase of AI, particularly for the inference trend. Broadcom’s custom XPU solutions provides Big Tech something that AI GPUs can’t: massive cost savings and energy efficiency at scale. We have discussed in depth in our article, ‘This AI Stock is Set to Surge from Inference Demand.’ 

Q3 Market Bifurcation: AI Leadership Emerges as Crypto Stalls 

April proved challenging, but Q3 marked a critical bifurcation in the market. As crypto rolled over and many debt-laden AI stocks softened, a select group of lesser-known AI names continued to advance—quietly separating leadership from excess. 

Crypto Peaked in Q3 as the Herd Stayed Bullish 

The I/O Fund has long held that risk management should carry equal weight to alpha generation. As a result, some of our most important wins are not always reflected in returns, but in losses avoided. In August, we hosted a rare, public one-hour webinar—our only free webinar of the year—to walk through why a Bitcoin selloff was increasingly likely. At the time, Co-Portfolio Manager Knox Ridley was confident enough in his analysis to openly challenge lofty crypto price targets, referring to consensus optimism as “the herd.” 

Our Bitcoin calls are grounded in a systematic framework that combines technical analysis, on-chain data, and global liquidity trends. While many money managers were calling for Bitcoin prices to double in August, Knox accurately identified a market top through a series of research pieces, including the article ‘Is Bitcoin’s Bull Run Nearing a Top? What the Herd Missed at $16,000 and is Missing Now’as well as the accompanying webinar. 

The clip below is from our Free Bitcoin Webinar in August, explaining that we were in the final Wave 5 for Bitcoin.

Avoiding the AI Bubble Trap: I/O Fund’s Timely Nvidia Q3 Call 

While others were busy discussing the AI bubble, we continued to track Big Tech Capex to predict Nvidia’s strong Q3 results. Nvidia’s stock experienced a rare price target reduction after reporting weaker-than-expected Q2 results and increased competition from Broadcom. The company faced numerous headwinds from China and production delays in their current generation of GPUs during that period. We stayed calm and crunched the hard data on Q2 capex numbers and what is coming down the pipe for Q3. We also came up with an updated buy plan to our readers in the article that we published in September, ‘Updated Nvidia Stock Price Target – AI “Bubble” Narrative Ignores Re-Acceleration in Big Tech Capex.’ 

Reddit Stock, an Overlooked AI Play 

During this quarter, the I/O Fund covered Reddit, ahead of the stock leading off the November lows in the article Reddit Stock Blows the Doors Off – Can it Last? We discussed Reddit’s strong Q2 earnings and even issued three buy alerts between $190 – $196. Despite having far fewer users than Facebook, Reddit ranks among the most visited U.S websites, benefiting significantly from Google’s AI-driven search changes. This visibility has fueled growth but also introduces risk. The analysis explores how investors can evaluate this opportunity and identify the signs of peak growth and recognize potential catalysts that could further influence Reddit’s stock.  

Q4: The I/O Fund’s AI Monetization Calls 

While many investors are wondering whether the AI trend is entering dot-com territory, we believe AI’s most powerful move has not even begun.  

In a series of analyses on the incoming AI monetization wave, the I/O Fund has laid out a data-driven case that AI is on the cusp of monetizing; a sharp rebuttal to those who believe AI is topping. Earlier this month, we connected the dots on Nvidia’s earnings report, the strongest in nearly two years, and highlighted why Broadcom’s commentary is quietly signaling that the best is yet to come. 

At select moments, IOF takes a firm view that diverges sharply from prevailing market consensus. In many of these instances, we are among the few—if not the only—voices expressing that view in real time, grounded in deep analysis and conviction. 

We did this recently by standing against the prevailing, negative views on Big Tech capex by pointing out we are likely on the cusp of an AI monetization wave  

Predicting Nvidia’s $20 Trillion Market Cap: The 2030 Roadmap 

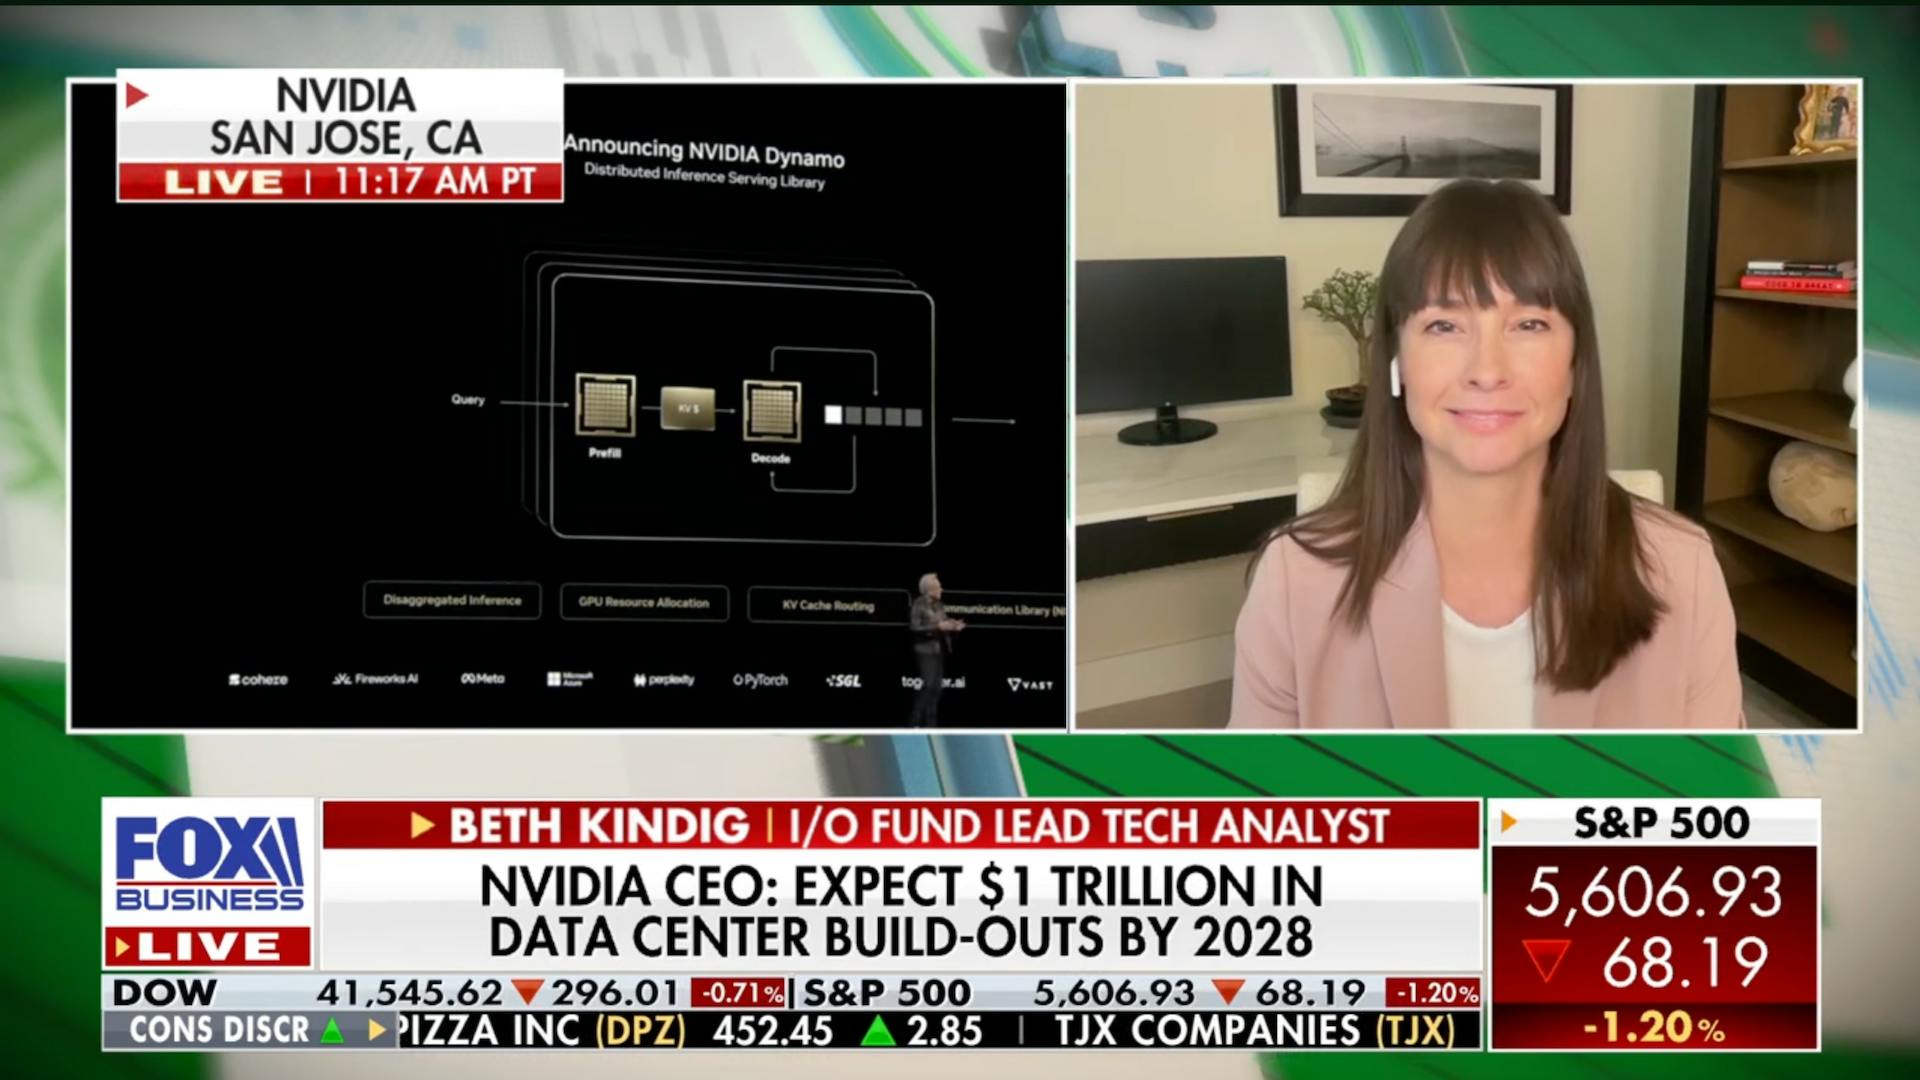
We revised our $10 trillion market cap target to $20 trillion in the article here. We offered a data-driven, fundamentally grounded case for how Nvidia can realistically reach a $20 trillion valuation by 2030. This is supported by Nvidia’s aggressive 1-year product roadmap, an impenetrable software ecosystem through CUDA to maintain a near-monopoly on training, and its evolution into a full-stack AI systems provider as the inference market intensifies. When these elements are modeled together — alongside the rapid expansion in global AI infrastructure capex — the path to $20 trillion becomes less sensational and more a reflection of compounding fundamentals. Under our framework, Nvidia’s data center segment would need to grow at a 36% CAGR through 2030 to support such a market capitalization—a trajectory we view as achievable given the company’s roadmap visibility.  Our CEO and Lead Tech Analyst, Beth Kindig, joined Charles Payne of Fox Business Network on his show ‘Making Money with Charles Payne’, after Nvidia’s stellar Q3 results to defend the $20 trillion market cap target. 

AI Growth Cycle: Decoding Big Tech’s Record CapEx 

Big Tech’s capital spending, the core metric for the AI cycle, continued to impress in the Q3 earnings season. Q3 CapEx rose 19% QoQ and 75% YoY – which is the strongest growth we've seen this year. Amazon’s Andy Jassy captured the sentiment on his Q3 earnings call: “The faster we grow, the more CapEx we end up spending… We don’t procure it unless we see significant signals of demand.” His comments underscore the durability of AI-driven demand.  

Some high-profile analyst firms claim the CapEx boom is a one-time event – and we wrote a data-driven rebuttal to this idea in the article Big Tech’s $405B Bet: Why AI Stocks Are Set Up for a Strong 2026. AI infrastructure is continuously advancing, and this requires successive generations of hardware and networking upgrades every one to two years as model architectures, memory bandwidth, and power requirements scale exponentially. 

The Incoming AI Monetization Wave 

In the analysis, ‘The AI Revenue Leader Nobody Is Talking About—Second Only to Nvidia Stock.’ We highlight several key metrics from Meta’s Q3 earnings report that illustrate the company is offering measurable returns on its AI investments. Perhaps most surprising, we believe Meta may now rank only behind Nvidia in AI revenue — surpassing Microsoft in the process. The analysis looks beyond the headline numbers to examine what’s driving AI’s second-largest revenue engine. 

This quarter, our firm also covered Micron, a stock up 6X compared to Nvidia this year in the article Micron Stock Up 120% YTD: What the HBM Memory Leader Plans for 2026. Micron is no longer tied to consumer device cycles. Instead, high bandwidth memory (HBM) had led to higher margins and multi-year supplier agreements, resulting in a leveraged approach to participate in the AI infrastructure buildout. 

Conclusion: 

While the rest of the market spent this year debating AI bubbles, geopolitical fears, and supply chain bottlenecks, our team remained laser-focused on outcomes. Rather than responding to headlines, we work hard to anticipate shifts and publish data-driven analysis to get in front of the market. This approach led us to flag the April correction in February, surface multiple AI winners throughout the year, and help protect capital during the crypto downturn.  

Over the past five years, the I/O Fund has delivered cumulative returns of 210%—performance that would rank us #5 among hedge funds and #2 among ETFs. Notably, this figure does not yet reflect our strong 2025 performance. 

Subscribe to Advanced Market Signals to get real-time trade alerts for every entry and exit, portfolio access, and join weekly live webinars. Join now.Advanced Market Signals to get real-time trade alerts for every entry and exit, portfolio access, and join weekly live webinars. Join now.Join now.

Please note: The I/O Fund conducts research and draws conclusions for the Fund’s positions. We then share that information with our readers. This is not a guarantee of a stock’s performance. Please consult your personal financial advisor before buying any stock in the companies mentioned in this analysis.

Recommended Reading:

  • AI Stocks & Nvidia: I/O Fund’s 2025 Tech Media Highlights
  • The AI Revenue Leader Nobody Is Talking About—Second Only to Nvidia Stock
  • Broadcom Stock: The Silent Winner in the AI Monetization Supercycle
  • Nvidia Stock and the AI Monetization Supercycle No One Is Pricing In
Posted in AI StocksLeave a Comment on Nvidia & Beyond: I/O Fund’s Best Free AI Stock Research in 2025  

AI Stocks & Nvidia: I/O Fund’s 2025 Tech Media Highlights

Posted on December 23, 2025June 30, 2026 by io-fund
AI Stocks & Nvidia: I/O Fund’s 2025 Tech Media Highlights

While the rest of the market spent this year debating AI bubbles, geopolitical fears, and supply chain bottlenecks, our team remained laser-focused on the signal within the noise. Rather than responding to headlines, we work hard to anticipate shifts to get in front of the market. For example, consider that we covered AI energy in our free newsletter 18 months before the market recognized it had become a bottleneck for AI systems. Behind our paywall, we do this on a monthly – if not weekly basis – by publishing information we feel confident is early and actionable.  

As we close out a defining year for tech, we’re proud to share a few media moments where our theses met the mainstream. Below are some of our most impactful media appearances of the year, including in-depth conversations on Nvidia’s stock, the broader AI market, and—not to be missed—a few lesser-known AI stocks that anchors couldn’t help but ask about.  

We are grateful that our readers trust us to cut through the noise – and we want to wish you a wonderful holiday season and a successful close to the 2025 trading year! 

Beth Kindig’s $20 Trillion Nvidia Thesis: 25% Data Center Growth Silences AI Bubble Fears 

I/O Fund’s CEO and Lead Tech Analyst, Beth Kindig, joined Charles Payne of Fox Business Network on his show ‘Making Money with Charles Payne’, after Nvidia’s stellar Q3 results. In the video below, Beth highlighted the company’s strong fundamentals and picture-perfect earnings report. She specifically pointed out the 25% sequential growth in the data center segment, the fastest QoQ growth in about two years. Beth boldly said, “The more people talk of the AI Bubble, I would counter that and say the bigger concern is the opportunity cost of not investing in AI.” Beth also defended her $20 trillion market cap forecast by 2030. 

I/O Fund has a history of buying Nvidia at low prices. The first entry was $3.15 in December 2018. The I/O Fund discusses key technical levels in our weekly webinars for Advanced Market Signals Tier members. Subscribe to Advanced Tier to get real-time trade alerts for every entry and exit, portfolio access, and join weekly live webinars. 

Nvidia’s Blackwell Ramp: Key to the $20 Trillion Thesis 

In May, Beth made an bold call on Fox Business Network following Nvidia’s Q1 results—at a time when few dared to look past the headlines. She emphasized that Nvidia’s software revenue is on track to surpass hardware revenue within five years, that Blackwell's ramp is strong, and that Nvidia's long-term AI vision transcends China-related market noise. Since this interview, Nvidia shares are up 30% – not an easy call considering the company was already worth $3.4 trillion and competing with Microsoft as the world’s most valuable company.  

Best AI Stocks for Q4 2025: Beth Kindig’s Top Picks 

In Q4, Beth released her Top 15 AI Stocks report that totaled 43 pages and 15,000 words. Charles Payne interviewed Beth to discuss three of the top 15 stocks. To access the full report, subscribe here.

Join Discovery and get 2 stock ideas and technical setups every month plus the Top 10 Emerging Tech Watchlist.Join Discovery and get 2 stock ideas and technical setups every month plus the Top 10 Emerging Tech Watchlist.

The Power of Precision: Beth Kindig’s AI pick outpaces Meta 

Beth Kindig joined David Ingles and Yvonne Man on Bloomberg: The China Show in July. Beth shared her expertise on Tesla’s Q2 performance, Alphabet’s AI spending, and the Best AI stocks. By favoring Astera Labs over industry giants like Meta, Beth achieved a stellar 43% outperformance in this short period. With Astera Labs surging 35% and Meta retracing 8%, Beth continues to prove why she is the leading voice in tech investment.

From Hopper to Blackwell: Why Beth Kindig’s Nvidia Q3 Call Was a ‘Bingo’ for Investors 

Beth Kindig made a bold call after the GTC 2025 event in March this year and said, “It is a perfect time for the naysayers to lose faith because we are moving from one generation to the next. That’s from Hopper to Blackwell…keep an eye on Q3, it is going to be phenomenal.”  

The stock is up 60% since this conversation, despite the $2.90 trillion market cap during that time and Nvidia’s Q3 was the strongest report in nearly two years (bingo!) 

Nvidia Blackwell Ramp & $50B Data Center Forecast: Beth Kindig on Bloomberg 

In August, Beth Kindig shared her outlook on Nvidia’s growth with Caroline Hyde on Bloomberg Technology, emphasizing the strong ramp of the Blackwell platform. She noted that her forecast set a year ago that data center quarterly revenue would surpass $50 billion by year-end fiscal 2026 was likely conservative. Later, Nvidia achieved the milestone a full quarter early, exceeding $50 billion in data center revenue in Q3. 

AI Infrastructure & Power Demand: Why Energy Stocks Are Essential for AI Portfolios 

Beth Kindig joined Charles Payne on Fox Business Network in July to break down the evolving AI landscape and why energy stocks are becoming a critical piece of AI-driven portfolios. In this interview, Beth explains how power demands from AI infrastructure are reshaping the market — and why investors should consider exposure to top-performing energy names alongside tech leaders. 

The Rarest S&P 500 Pattern Since 1998: Cycles Point to a Big Move Ahead 

In the below video, I/O Fund’s Co-Portfolio Manager, Knox Ridley, breaks down why the current S&P 500 rally is one of the rarest in over 25 years. Using Fibonacci retracements, cycle analysis, and long-term Elliott Wave patterns, he examines how the market has rallied for eight straight months without even a 23.6% pullback — a behavior only seen once since the 1920s, during the 1998–1999 melt-up. 

Bitcoin Price Prediction 2025: Elliot Wave & RSI Signals Pointed to a Cycle Top 

The I/O Fund's Co-Portfolio Manager, Knox Ridley, perfectly highlighted that the Bitcoin price was entering the final fifth wave after a multi-year bull run — and technical signals are flashing a warning that a potential top is near during his weekly webinar in October to our Advanced Market Signals Tier members. Knox breaks down Bitcoin’s Elliott Wave structure, key RSI signals, and how the DXY (U.S. Dollar Index) could determine what happens next. 

Subscribe to Advanced Market Signals Tier to get real-time trade alerts, portfolio access and weekly live webinars.Advanced Market Signals Tier to get real-time trade alerts, portfolio access and weekly live webinars.

Please note: The I/O Fund conducts research and draws conclusions for the Fund’s positions. We then share that information with our readers. This is not a guarantee of a stock’s performance. Please consult your personal financial advisor before buying any stock in the companies mentioned in this analysis.

Recommended Reading:

  • The AI Revenue Leader Nobody Is Talking About—Second Only to Nvidia Stock
  • Broadcom Stock: The Silent Winner in the AI Monetization Supercycle
  • Nvidia Stock and the AI Monetization Supercycle No One Is Pricing In
  • I/O Fund Called the Bitcoin Selloff: What Liquidity & DXY Data Predict Next
Posted in AI StocksLeave a Comment on AI Stocks & Nvidia: I/O Fund’s 2025 Tech Media Highlights

The AI Revenue Leader Nobody Is Talking About—Second Only to Nvidia Stock

Posted on December 18, 2025June 30, 2026 by io-fund
The AI Revenue Leader Nobody Is Talking About—Second Only to Nvidia Stock

While many investors are wondering whether the AI trend is entering dot-com territory, I believe AI’s most powerful move has not even begun. 

In a series of analyses on the incoming AI monetization wave, the I/O Fund has laid out a data-driven case that AI is on the cusp of monetizing; a sharp rebuttal to those who believe AI is topping. Earlier this month, my firm connected the dots on Nvidia’s earnings report, the strongest in nearly two years, and highlighted why Broadcom’s commentary is quietly signaling that the best is yet to come. 

In this analysis, however, I turn to what may be the most important clue of all: Meta.  

Meta’s stock sits at the center of the AI spending debate, as Big Tech continues to shock markets with outsized AI-driven capital expenditures. What is being overlooked is that Meta’s stock is already reporting a long-awaited return on investment from the AI data center buildout. 

Below, I highlight several key metrics from Meta’s latest earnings report that illustrate the company is beginning to offer measurable returns on its AI investments. When viewed alongside our prior analysis on Nvidia and Broadcom, this discussion broadens the perspective to include one of the most closely scrutinized AI stocks in terms of capital expenditure. Although AI remains in a nascent stage, the data presented below provides early evidence that elevated AI capex is starting to translate into a clearer path toward monetization. 

Meta Advantage+ Reaches $60 Billion ARR, Outpacing OpenAI by 3X 

In the analysis “Nvidia Stock and the AI Monetization Supercycle Nobody is Pricing In” I encouraged investors to look at the evidence the AI Monetization Supercycle is already offering tangible results. For example, we can look at OpenAI’s trajectory from $1 billion in revenue in 2023 to an estimated $20 billion annualized revenue today – which represents the steepest rise in technology history. This was driven almost entirely by inference (API calls and ChatGPT usage). The CEO has stated OpenAI will reach hundreds of billions in annualized revenue by the end of the decade – although this requires ample execution, it’s a hint as to the sheer force of the incoming monetization wave. 

What may surprise you is that Meta’s Advantage+ is outpacing OpenAI by 3X and is also offering the strongest AI revenue among the FAAMGs. Unless you track earnings reports as closely as my firm, the information from this past quarter could have easily flown under radar as Meta’s management team offered an update on Advantage+ that nobody was expecting: 

“This quarter, we saw meaningful advances from unifying different models into simpler, more general models, which drive both better performance and efficiency. And now the annual run rate going through our completely end-to-end AI-powered ad tools has passed $60 billion.” 

The $60 billion run rate was achieved within 3.5 years, which is on par with when OpenAI began to monetize in 2023 through year-end 2025. The last update we got from Meta's management on AI powered ads was in March of 2025 with a stated $20 billion annual run rate – which means AI ads have grown 3X in 7 months' time.

mid

Perhaps an even bigger shocker is that Meta may be ahead of Microsoft for AI revenue. The last update we got from Microsoft is from Fiscal Q2 ending in January, where AI revenue was stated to be $13 billion, growing at a pace of 175% year-over-year. 

“This quarter we saw continued strength in Microsoft Cloud, which surpassed $40 billion in revenue for the first time, up 21% year-over-year. Enterprises are beginning to move from proof-of-concepts to enterprise-wide deployments to unlock the full ROI of AI. And our AI business has now surpassed an annual revenue run rate of $13 billion up 175% year-over-year.” 

The base case for Microsoft assumes AI contributing approximately 22 points to growth as of fiscal Q1, or around 56% of its YoY growth in dollars. This could imply AI revenue at 26% of Azure’s total revenue, or around $25 to $26 billion on a nearly $100 billion annual run rate for Azure.  

Chart illustrating Microsoft’s base case scenario where AI-driven revenue makes up about 26% of Azure revenue, highlighting AI as a key growth driver

Chart illustrating Microsoft’s base case of AI revenue accounting for about 26% of Microsoft Azure revenue. It assumes AI is driving significant Azure growth.

Overall, it would require a step-up from 175% growth YoY to 460% year-over-year for Microsoft to match Meta’s AI revenue – an aggressive growth rate that I believe Microsoft would have already discussed with investors. Therefore, I believe probabilities favor Meta being in the lead on AI revenue, as it stands today. That means Meta would be in second place – second only to Nvidia – on AI revenue. 

Meta’s Advantage+ results are one of the clearest real-time signals that the AI monetization wave is already underway, not theoretical. 

Subscribe to our free AI & tech newsletter for weekly research and charts on AI monetization across leaders like META, NVDA, and MSFT. Click here.Subscribe to our free AI & tech newsletter for weekly research and charts on AI monetization across leaders like META, NVDA, and MSFT. Click here. 

How Meta AI Advantage+ Generates $4.52 ROI Per Dollar 

Advantage+ automates campaign targeting, budget allocation, and creative generation, providing advertisers with an easy-to-use tool that integrates generative AI directly into Meta’s ad ecosystem. Advantage+ is powered by Andromeda, which is an internally developed AI system that optimizes ad ranking, recommendation quality and content delivery by leveraging machine learning models more efficiently. By improving how models are executed, Andromeda allows Meta to extract more performance per unit of compute, which is key as the AI powered ads platform seeks high-volume inference. 

Meta revealed earlier this year that “for every dollar spent on its AI-enabled Advantage+ products, advertisers generate on average $4.52 in revenue for their businesses,” or an increase of ~22% versus typical campaigns, highlighting how ad performance improves while using the AI-powered platform.  

In Q3, Meta emphasized that “Advantage+ continues to drive performance gains, [and] advertisers who run lead campaigns using Advantage+ are seeing a 14% lower cost per lead on average than those who are not.” This compares to a 10% lower cost per lead as of April, showing that the platform continues to drive results while lowering costs per lead.   

Meta Stock: $10B Growth Proves AI Advertising Acceleration 

There is additional evidence that Meta is seeing tailwinds from AI recommendation models, which in turn drive higher ROI for advertisers and increase time spent across its family of apps. 

In Q3, advertising revenue grew 25.6% YoY, accelerating more than nine points since Q1 and marking the fastest growth in six quarters. Ad impressions rose 14% YoY in Q3, accelerating from 11% in Q2 and marking a strong inflection from just 5% growth in Q1. Pricing remained steady, rising just one point to 10% YoY.  

Graph showing Meta's ad impressions growth in Q3, driven by AI, with a 3-point acceleration to 14% year-over-year

Meta Stock Ad Impressions: AI drives 3-point acceleration to 14% YoY in Q3.  

However, the dollar growth in advertising stands out more — Meta has delivered its two largest YoY growth quarters on a dollar basis in Q2 and Q3, at $8.23 billion and $10.2 billion, even outperforming Q4 2024’s holiday-boosted growth of $8.08 billion. This high dollar growth is poised to continue in Q4 2025, with guidance pointing to ~$9.3 billion to $10.7 billion in QoQ dollar growth.  

Chart showing Meta's ad revenue growth accelerating to 25.6% year-over-year in Q3, up from 21.5% in Q2, driven by AI recommendation models

Meta ad revenue accelerated to 25.6% YoY growth in Q3, up from 21.5% in Q2, highlighting the success of AI recommendation models.  

Put another way, Meta is delivering larger YoY dollar growth in advertising revenue on a larger base – Q3 2025 grew $10 billion YoY off a $40 billion base, versus $7.5 billion growth in Q3 2024 on a $33.6 billion base. 

AI Drives Record ARPP Continues to Accelerate Heading into Q4 

Perhaps the most important metric for Meta’s ads monetization is ARPP (average revenue per person), with the metric continuing to accelerate in Q3 ahead of the seasonally stronger holiday quarter. ARPP reached $14.46 in Q3, accelerating to 17.7% YoY from 14.8% in Q2. More impressively, this marked a record high for ARPP, surpassing Q4 2024’s seasonally stronger ARPP of $14.25. 

Chart showing Meta's average revenue per person (ARPP) reaching a record $14.46 in Q3, boosted by AI-driven efforts

Meta ARPP: AI-driven efforts push to a record $14.46 in Q3. 

This sets the stage for ARPP to push well beyond $15, potentially to $16 in the upcoming quarter, highlighting that Meta’s AI-driven ad performance improvements and monetization efforts are bearing fruit. 

Annual Revenue Revisions Seeing Sharp Increase Since July 

What’s notable about the revenue front is the sharp upward revisions to annual revenue estimates, with 2026 and 2027 moving sharply higher since this summer.  

Back in July, prior to Q2’s earnings, Meta was expected to generate $215.1 billion in revenue, with that now sitting at $235.1 billion. On a YoY basis, growth has been revised from 14.0% to 17.9%. A smaller uplift considering 2025 comps have toughened, having risen from 14.7% to 21.3% over the same period.  

For 2027, Meta was expected to generate $240.6 billion in late July, with that now sitting at $271.7 billion, with YoY growth moving from 11.9% to 15.6% on a higher base.  

Chart illustrating the increase in Meta’s forward revenue estimates over recent quarters

Chart showing the increase in Meta’s forward revenue estimates. 

Source: YChartsYCharts

Meta Ad Performance: Leveraging GEM, Lattice, and Andromeda AI Models 

Meta outlined two monetization levers in Q3 – improving ad performance, and an ability to continue delivering engaging content to users. 

This first monetization lever stems from improving ad performance for its advertisers, mostly driven by the company’s three foundational models as well as its end-to-end ads automation platform Advantage+. Meta opts for tracking conversions to gauge ad performance, despite it being a complex metric to track considering advertisers can optimize for different types of conversions. CFO Susan Li stated that value-weighted conversion rates showed “very strong” YoY growth in Q3, outpacing impressions.  

Meta’s three foundational models all serve a different function, with the same end goal of improving ad quality and conversions to drive higher ROI for advertisers: 

  • GEM (Generative Ads Recommendation Model) is described by Meta as the ‘super brain’ that can rapidly process, catalog and analyze trillions of data points, to then recognize subtle patterns in user activity to provide the most relevant ads at the right time. Meta says GEM was rolled out more broadly earlier this year after initial testing on Reels saw GEM boost conversions by up to ~5%. GEM delivered a 5% increase in conversions on Instagram and a 3% increase on Facebook in Q2, and in Q3 Meta “doubled the performance benefit we get from adding a given amount of data and compute” to continue scaling training capacity at an attractive ROI. 
  • Lattice is described as a ‘giant library’ that generalizes learnings across different campaign objectives (clicks, views, etc), surfaces (Reels, Story, Feed, etc) and subjects, in order to predict an ad’s performance. Lattice increases ad efficiency as it runs fewer models, while the knowledge-sharing effect increases ad quality and conversions – Meta said earlier this year that Lattice has increased ad quality by 12% and conversions by 6%. In Q3, Meta rolled out Lattice to app ads, driving a ~3% gain in conversions on that objective.
  • Andromeda is described as a ‘personal concierge’, or Meta’s vast ML ad recommendation and prediction system that, at its core, aims to predict exactly which ads a user will find the most interesting. For Andromeda, Meta says, “Imagine having a personal concierge who knows your tastes so well that they don’t just understand that you covet shoes, but that you like to wear red flip flops at the beach.” Meta said that in Q3, it significantly improved Andromeda’s performance by combining retrieval and early-stage ranking models, driving a 14% increase in ad quality on Facebook. Andromeda is also the core engine powering Advantage+ automation tools. 

Moving to 2026, Meta discussed that it is “working on combining these 3 major AI systems into a single unified AI system that will effectively run our family of apps and business using increasing intelligence to improve the trillions of recommendations that it will make for people every day.”  

A single model that combines the strengths of GEM, Andromeda and Lattice could theoretically understand user preferences and activity at a much deeper level, improve ad ranking quality, relevance and conversions across its family of apps, and save on inference. For example, Meta does not use GEM for inference as its size makes it too cost-prohibitive, rather it transfers knowledge to smaller run-time models; a single model incorporating GEM’s knowledge could potentially run inference in a more cost-effective manner. 

Meta AI Lever 2: Reels Reaches $50 Billion ARR Due to Increased Engagement 

On the second monetization lever of increasing engagement, Meta is executing quite well, with improvements in its recommendation models helping drive time spent on its apps higher. More time spent then allows ad impressions to grow without substantially increasing ad load, underpinning this reacceleration in impressions growth seen in Q3 and more growth moving forward.  

Management pointed out that “overall time spent on Facebook and Instagram grew double digits year-over-year, driven by continued video strength as well as healthy growth in nonvideo time on Facebook.” Video time spent on Instagram was more than 30% higher versus last year, while AI ranking optimizations helped drive 10% more time spent on Threads in Q3. This video growth has pushed Reels to a $50 billion annual run rate in Q3, up 5X from its last update in Q2 2023 when it reached a $10 billion run rate.   

Improving ranking models remains a key focus for Meta moving through 2026, with management expecting new model innovations to help “significantly scale up the amount of data and compute we use to train our recommendation models in 2026, yielding more relevant recommendations.” 

Meta’s Upcoming Capex Surge and Possible FCF Crunch 

Some of the most important quotes from Q3’s call circled back to Meta’s view on capex and why it believes aggressive expansion of capacity and thus capex is a necessity. CEO Mark Zuckerberg believes it is the “right strategy to aggressively front-load building capacity so that way we're prepared for the most optimistic cases” on when AI superintelligence arrives, so Meta is prepared to capitalize on this opportunity.  

If building superintelligence takes years longer than expected, Zuckerberg says Meta can “use the extra compute to accelerate our core business which continues to be able to profitably use much more compute than we've been able to throw at it. And we're seeing very high demand for additional compute, both internally and externally.  

These comments underscore why Meta is aggressively raising its capex spending this year and next – Zuckerberg believes that the upside potential of superintelligence is so large that it is worth the risk of overbuilding to not fall behind OpenAI or Google (with compute capacity being the main advantage), with Meta able to use extra compute in the meantime to improve core AI ad capabilities and drive growth.  

However, the tradeoff for this is lower free cash flow and potential operating margin headwinds. Meta expects capex dollar growth to be “notably larger in 2026 than 2025,” while total expenses “will grow at a significantly faster percentage rate in 2026” driven by infrastructure costs, incremental cloud costs and depreciation, followed by employee compensation.  

This implies 2026 capex of at least $103 billion, as current guidance for 2025 at $70-72 billion implies a minimum of ~$32 billion YoY growth. However, considering management’s comments for notably larger dollar growth, there is potential for capex to come in at or above $110 billion, up ~55% YoY, above current estimates for $107.9 billion. Put another way, Meta could spend ~$30 billion more in 2025 and 2026 than it did in 2019 through 2024 combined. 

Chart showing Meta's projected capital expenditures reaching $107.9 billion in 2026 as it prepares to monetize AI superintelligence opportunities

Meta capex is projected at $107.9 billion in 2026 as it prepares to monetize the AI superintelligence opportunity.  

The capex surge will potentially cause another free cash flow crunch similar to 2022, with current consensus estimates pointing to FCF of $19.71 billion in 2026, down nearly (50%) YoY and (63.5%) from 2024. 

Chart showing Meta's projected AI-driven capex surge in 2026 and its potential impact on free cash flow, mirroring the 2022 drop from $39.12B to $19.04B

Meta’s AI-driven capex surge will potentially cause another free cash flow crunch in 2026. This mirrors the 2022 crunch when FCF fell to $19.04 billion from $39.12 billion in 2021. 

How Meta’s Capex Compares to Other Big Tech Stocks 

We recently discussed Big Tech Capex spending following Q3 earnings results in our article, Big Tech’s $405B Bet: Why AI Stocks Are Set Up for a Strong 2026. As seen in the chart below, Meta has the lowest cumulative capex for the years 2023 to 2025E of $138 billion. This figure is lower than that of other Big Tech Companies, such as Alphabet at $177 billion, Microsoft at $234 billion, and Amazon at $261 billion. 

Chart comparing cumulative capital expenditures of Big Tech companies from 2023 to 2025E, highlighting Meta as having the lowest capex

Meta has the lowest cumulative capex for the years 2023 to 2025E among the Big Tech Companies 

Big Tech companies are now beginning to report their AI revenue in the quarterly earnings results, unlike AI semiconductor companies, which have consistently been providing this figure. During the June quarter, Microsoft revealed that Azure surpassed $75 billion in annual revenue. If we assume that AI revenue constitutes 26% of Azure revenue, Microsoft’s AI revenue would be a base case of $20 billion up to $26 billion if we assume the same growth rate as last year, well below the $60 billion for Meta. I do foresee a scenario where Microsoft is higher than the base case, yet it’s unlikely the growth rate is at the 450%+ growth rate required to pass Meta. Similarly, Alphabet and Amazon who spent far more than Meta are not revealing AI numbers, which theoretically means the numbers are lower than Meta's. 

Meta’s Free Cash Flows hit by high Capex 

Meta has strong operating cash flows. However, due to high capex to support AI investments, the company’s free cash flows were down (31.5%) YoY to $10.63 billion in Q3. Capex rose 110.5% YoY to $19.34 billion, driven by investments in servers, network infrastructure and data centers. Based on 2025’s capex guide, which was raised to $70-72 billion (up 81% YoY at midpoint), Q4 capex is on track to be ~$21 billion, up 41.5% YoY. Meta is expected to see a steep free cash flow crunch moving through 2026 as a result of surging capex and would be a risk item to keep an eye out for in the coming quarters.

Conclusion: 

While much attention is given to Nvidia and AI semiconductors for visible AI-driven growth, we are beginning to see an impact in Big Tech’s software segments. Meta’s advertising revenue accelerated to the mid-20% range, and YoY dollar growth surpassed $10 billion in Q3. Revenue forecasts continue to strengthen over the next few years with revisions of up to $30 billion, or up 10-14% since July, underscoring the Street’s confidence in Meta’s ability to leverage AI to improve monetization.   

More impressively, Meta’s AI ads automation platform has reached a $60 billion run rate in Q3 in three and a half years from its launch. This is 3X Broadcom’s AI revenue, 3X OpenAI ARR and could even put Meta as the #2 stock by AI revenue ahead of Microsoft. Notably, the I/O Fund is the first firm to point out Meta’s quiet dominance relative to Microsoft, as we consistently find an edge in earnings data that others have overlooked.  

However, the thorn in Meta’s side stems from the compute and capex side, as the company is aggressively building data center capacity to prepare itself for the most optimistic scenario of reaching superintelligence. Not only is capex guided to surge to over $100 billion in 2026, potentially creating another cash flow crunch reminiscent of 2022’s metaverse-linked spending spree, but expense growth is also expected to outpace revenue growth by a wide degree and weigh heavily on operating margin. 

This year, my firm has 15 positions beating the Nasdaq YTD, up from ten positions last year – helping to cement the I/O Fund as one of the world’s leading AI portfolios. Our cumulative return of 210% over a five-year period would rank us #2 if we were a hedge fund and #5 if we were an ETF – notably, this strong cumulative return does not yet include our 2025 performance. 

Want our real-time trade alerts and full AI portfolio positioning, including a newly updated 3,800-word deep dive3,800-word deep dive on Meta’s near-term risks and potential entry points? Join our Advanced plan here.Join our Advanced plan here. Advanced members also receive weekly webinars and full access to our actively managed portfolio of lesser-known AI stocks.

Please note: The I/O Fund conducts research and draws conclusions for the Fund’s positions. We then share that information with our readers. This is not a guarantee of a stock’s performance. Please consult your personal financial advisor before buying any stock in the companies mentioned in this analysis.

Recommended Reading:

  • Broadcom Stock: The Silent Winner in the AI Monetization Supercycle
  • Nvidia Stock and the AI Monetization Supercycle No One Is Pricing In
  • I/O Fund Called the Bitcoin Selloff: What Liquidity & DXY Data Predict Next
  • Why Nvidia Stock Could Reach a $20 Trillion Market Cap by 2030
Posted in AI StocksLeave a Comment on The AI Revenue Leader Nobody Is Talking About—Second Only to Nvidia Stock

Broadcom Stock: The Silent Winner in the AI Monetization Supercycle

Posted on December 11, 2025June 30, 2026 by io-fund
Broadcom Stock: The Silent Winner in the AI Monetization Supercycle

When discussing the AI Monetization Supercycle, I would be remiss not to highlight Broadcom. The AI accelerator market will inevitably widen beyond Nvidia’s GPUs – the keyword is widen. More players will sell more AI systems as the market expands, and that growth supports both the clear leader (Nvidia) and those already in pole position, such as Broadcom.  

Last week, amidst a flurry of noise in the AI market, my firm wrote an article on the AI Monetization Supercycle that is not being priced in. The analysis suggested the predominant risk is not an AI dot-com bubble or various headlines weighing on sentiment, but rather the risk investors face is missing out on what may be one of the strongest investing opportunities of our lifetime: what I’ve dubbed the AI Monetization Supercycle catalyzed by the inference phase. 

While many refer to this as the “AI Supercycle,” I believe Monetization is a critical word missing from that description. The hallmark of the next phase will not be the architectural leap toward AI superintelligence (although important) – but rather, it will be defined by the ability to monetize this very expensive technology. As an investor, I am obligated to care more about the latter.  

Which brings us back to Broadcom—a stock my firm highlighted in our free stock newsletter last June in an article entitled “This Stock is Set to Surge from Inference Demand.” 

At the time, I wrote: 

“Broadcom has already benefited from both increasing compute and networking needs – but the surge in inference demand will disproportionately (and positively) flow to Broadcom’s top line and bottom line. This is because custom silicon’s cost advantages and ability to drive lower inference serving costs at scale creates a strong value proposition for Big Tech. As more and larger clusters are deployed to serve exploding inference demand, there will be additional long-term tailwinds for the Ethernet networking giant.” 

The inference phase – what I'm calling the Monetization Supercycle – is squarely in front of us. While many will understandably point toward companies like OpenAI as the biggest beneficiaries, it is one of the market’s greatest misconceptions that platform owners always outperform suppliers (hardware stocks). During the mobile era, Broadcom’s stock outperformed Apple precisely because it supplied RF and connectivity components to the iPhone giant. 

Below, we look more closely to see if the “silent winner” Broadcom stock can repeat that outperformance again.

Line chart comparing Broadcom (AVGO) and Apple (AAPL) stock performance over a 10-year mobile boom era. Broadcom delivered a 1,490% return, significantly outperforming Apple’s 623%.

Stock Price Comparison Chart: $AVGO vs $AAPL. Broadcom Stock significantly outperformed Apple stock in the 10-year cycle of the mobile boom era, delivering a return of 1,490% compared to Apple’s 623%. Source YChartsYCharts

Google TPU Ironwood v7: The Custom AI Chip Built for Inference 

Last April, Google announced that its upcoming seventh-gen TPU Ironwood is its “most performant and scalable custom AI accelerator to date, and the first designed specifically for inference.” Individual Ironwood TPUs are interconnected into larger units called pods, coming in two sizes, a 256-chip pod and a 9,216-chip Superpod, with the larger size offering up to 42.5 exaflops of performance. Notably, the Superpod would deliver 24x the compute of El Capitan, the largest supercomputer in the world.  The rack-scale architecture offers 64 TPUs compared to Nvidia’s racks with 72 GPUs, with a small cluster being four pods connected through an optical circuit switch network. While TPUs may excel at driving down costs on certain workloads, Nvidia’s GPUs still lead when it comes to processing performance.

mid

Google adds that Ironwood offers 2x the performance per watt as last-year’s generation Trillium, with 6x more HBM and 4.5x the HBM bandwidth; versus TPU v5p, released in 2023, Ironwood brings a more than 10x improvement in peak performance per chip and per pod. The substantial increases in memory and bandwidth are critical for maintaining high performance when processing larger data sets while the improvements in power efficiency allows inference workloads to be run in a cost-effective manner. 

It’s widely understood that Broadcom supplies Google with its custom TPUs. The incoming inference growth curve, that the I/O Fund detailed here, has led CEO Hock Tan to state Broadcom may witness an acceleration of XPU demand into the back half of 2026. He said, “In fact, what we've seen recently is that they are doubling down on inference in order to monetize their platforms. And reflecting this, we may actually see an acceleration of XPU demand into the back half of 2026 to meet urgent demand for inference on top of the demand we have indicated from training.”   

Something similar was echoed in the FQ3 call, with Tan stating: “But also as for these guys, they got to be accountable to being able to create cash flows that can sustain their path. They [are] starting to also invest in inference in a massive way to monetize their models.” On that note, Google’s TPU business received a significant vote of confidence recently with Anthropic signing a deal for up to one million TPUs, including Ironwood, coming online in 2026. The deal is said to be worth tens of billions.  

For Broadcom, the TPUs are expected to be the primary driver of AI revenue growth in fiscal 2026 – estimates from HSBC earlier this summer projected Google’s TPUs to represent ~58% of Broadcom’s ASICs shipments at 1.79 million, but account for ~78% of ASICs revenue at $22.1 billion. This is because Google’s TPUs were estimated to carry a significant price premium at $13,000 per chip versus Broadcom’s other projects at $5,000 per chip. However, this is still less than half the cost of Nvidia’s chips at $30,000 to $40,000 for a solo B200 ($60,000 to $70,000 for a GB200).  

Looking beyond fiscal 2026, projections for TPU shipments are surging. Morgan Stanley now expects 5 million TPUs to be shipped in 2027, a 67% rise from its prior estimate for 3 million; for 2028, the firm estimates shipments as high as 7 million, a 120% increase from its prior estimate. This would project YoY growth of 40% from 2027 to 2028, a substantial increase from 6% previously, and will represent more than 2X growth in two years. 

The I/O Fund first covered TPUs versus GPUs back in 2019 and revisited the topic in February 2024 in our analysis, Broadcom: Networking/ASICs Giant and the Second Largest by AI Revenue. Since then, we’ve provided quarterly coverage for two years. Broadcom: Networking/ASICs Giant and the Second Largest by AI Revenue. Since then, we’ve provided quarterly coverage for two years.  

If you want cutting-edge insights on AI stocks early in the cycle — including our take on Broadcom’s earnings this evening — sign up now.sign up now. 

Broadcom Stock’s AI Edge: Custom Silicon & Massive Hyperscaler Deals 

Broadcom’s stock has been strong this year, outperforming the Nasdaq by nearly 50-points and SMH by 20-points. This strong performance is partly due to custom accelerators that are often multiples cheaper than Nvidia’s GPUs for inference tasks and also due to custom silicon becoming increasingly performant with each generation. By optimizing algorithms (software), Big Tech can drive higher performance from large language models — which helps to drive down costs while also increasing output for specific workloads.  

For example, a rough idea as to how much it costs Nvidia to make merchant GPUs is estimated around $3,000 to $6,000 whereas the company charges $30,000 to $40,000 – hence the AI leader’s excellent margins. Reducing Nvidia’s high pricing power is what Big Tech is after and this can be accomplished both in the hardware costs but also through optimizing the workloads for specific use cases – for comparison, Ironwood is expected to cost around $13,000 per chip.  

Big Tech is prominent in Broadcom’s custom silicon customer list, which includes Google and Meta. ByteDance reportedly emerged as the third customer last summer. The company announced its fourth customer in FQ3 with a $10 billion XPU order. Hock Tan said in the FQ3 earnings call, “Last quarter, one of these prospects released production orders to Broadcom, and we have accordingly characterized them as a qualified customer for XPUs and, in fact, have secured over $10 billion of orders of AI racks based on our XPUs.” 

In late October, Anthropic signed a deal with Google worth tens of billions to access up to 1 million TPUs to bring online more than 1GW of capacity in 2026, although it has not explicitly confirmed if Anthropic is the mystery fourth customer.

Furthermore, OpenAI and Broadcom announced in October a strategic collaboration to deploy 10 gigawatts of OpenAI-designed AI accelerators. OpenAI and Broadcom will co-develop systems that include accelerators and Ethernet solutions from Broadcom for scale-up and scale-out. Broadcom plans to deploy racks of AI accelerators and network systems starting in the second half of 2026 and completed by the end of 2029.  

The OpenAI deal represents a substantial three-year revenue ramp for Broadcom stock and further solidifies its position in the AI silicon market. Citi estimates the deal with OpenAI could bring in $100 billion in sales and $8.00 in earnings per share over the next few years; however, Mizuho highlighted that the deal to deploy 10GW of OpenAI's custom ASIC, code named Titan, could be even larger at an estimated $150 billion to $200 billion deal over multiple years. 

The enviable customer list is showing up in Broadcom’s results. This quarter, management guided Q4 AI revenue to $6.2 billion, which would represent ~19% sequential growth and eleven consecutive quarters of YoY growth.  

Broadcom did not lay out a FY25 AI revenue target, yet FQ4 ending in October 2025 implies Broadcom is guiding for $19.9 billion in AI revenue for the year, up 63% YoY from $12.2 billion in FY24. Mizuho estimates that AI revenue will grow 103% YoY to $40.4 billion for the FY2026 and nearly double to $78 billion in FY2028. However, given the growing customer list, these estimates could prove to be too low. 

Additionally, Hock Tan will be duly rewarded should AI revenue targets exceed current expectations. In September, Tan received a performance award of 610,251 shares of common stock as part of a recent contract extension. The award will fully vest if Broadcom reaches $90 billion in revenue from its AI products over any consecutive four-quarter period from FY2028 through FY2030. That award will double if Broadcom earns $105 billion in AI revenue and triple if revenue totals more than $120 billion. If Broadcom fails to hit $60 billion in AI revenue during the period, Tan will forfeit the entire award. This provides investors with a framework for upper targets for the bull case. 

Chart showing Broadcom (AVGO) AI revenue forecast reaching $40.4 billion in FY2026, driven by Google TPU deployments and rising demand for custom silicon solutions.

Broadcom (AVGO) AI Revenue Forecast: Projected to hit $40.4 billion in FY2026, driven by Google TPUs and custom silicon demand.  

Source: Company IR/TheFly/Mizuho 

Broadcom’s Tomahawk 6: The Ethernet Switch to Power 1 Million-Plus AI Clusters 

Broadcom has been quite vocal about the industry’s path to 1-million-plus accelerator clusters, frequently reiterating how its three hyperscalers and now four “each race towards 1 million XPU clusters by the end of 2027.” This would be multiples larger than current deployments, with xAI’s Colossus supercluster expanding from 100K to 200K GPUs Today, these clusters are 10-20X larger than Ironwood’s 9,216 chip SuperPod, highlighting the depth of AI demand. 

Broadcom has continuously re-emphasized this forecast as it represents two major growth opportunities for the company: significant growth in accelerator deployments with inference tailwinds, and even more growth in networking deployments to support these clusters.  

The shift to Ethernet and away from Nvidia’s lock-in ecosystem of GPU + InfiniBand is benefiting Broadcom, with the industry pointing to rising Ethernet demand. Arista said that momentum for Ethernet “has really shifted in the last year” while Nvidia touted that its new Spectrum-X Ethernet is annualizing at $10 billion in revenue, or $2.5 billion quarterly.  

The company is committed to remaining on the leading edge of networking with its Tomahawk 6 switch, the industry’s first 102.4 Tbps Ethernet switch. The next-gen switch doubled the bandwidth of its predecessor, while offering flexible deployment ability with 1,024 100G or 512 200G SerDes options, reducing switch count.  

This raw performance upgrade paves the way for >100K to 1 million accelerator clusters by allowing larger leaf-spine fabrics to be constructed, while drawing less power and keeping latency low. Broadcom exec Ram Velaga said that the demand for the new switch is “unprecedented” with multiple >100K accelerator deployments “using Tomahawk 6 for both the scale-out and scale-up interconnect.” 

When discussing Tomahawk 6, management points toward the flattening of the AI cluster as an important catalyst for this product, stating: “[…] Tomahawk 6 enables clusters of more than 100,000 AI accelerators to be deployed in just two tiers instead of three … this flattening of the AI cluster is huge because it enables much better performance in training next-generation frontier models through a lower latency, higher bandwidth and lower power.” The two-tier topology also reduces complexity of cluster construction and reduces congestion choke points significantly, addressing another critical pain point of building larger and larger clusters.  

Additionally, in terms of the AI networking opportunity, scale up is 5-10X more than scale out – setting up a nice trajectory as AI clusters grow. Oppenheimer analyst Rick Schafer highlighted that they expect next-gen Tomahawk6 volumes to ramp up in the second half of next year, providing added growth and gross margin boost. 

Broadcom FQ4 Earnings Preview: AI Revenue Outlook & OpenAI Deals 

  • Revenue expected to grow by 24.2% YoY and adjusted EPS by 31.7%. 
  • AI Revenue outlook 
  • New customer announcements 
  • Update on AI Serviceable Market for 2027 

Broadcom is expected to report FQ4 revenue of $17.46 billion, up 24.2% YoY and a 220-basis points acceleration from the 22% growth reported in FQ3. Adjusted EPS is expected to grow 31.7% YoY to $1.87. 

Chart illustrating Broadcom (AVGO) expected FQ4 revenue growth of 24.2% year-over-year to $17.46 billion, driven by accelerating AI-related demand.

Broadcom (AVGO) FQ4 revenue is expected to grow 24.2% YoY to $17.46 billion, driven by AI Revenue Acceleration. 

Source: Company IR/Seeking Alpha 

The company’s margins will be a key metric to watch in the upcoming report. Management has done an excellent job in maintaining strong margins. Broadcom has been able to reduce operating expenses through cost controls and operational efficiency. Management expects adjusted gross margins to be down 70 basis points sequentially to 77.7% in FQ4, primarily due to a higher mix of XPUs and wireless. However, they are expected to be up 80 basis points compared to the same period last year. The company’s operating leverage should help to compensate for any sequential weakness in gross margins due to the FQ4 product mix. Management adjusted EBITDA guide for FQ4 is 67%, flat sequentially and up 200 basis points YoY.  

Analysts expect strong adjusted EPS growth in the coming years. Adjusted EPS is expected to grow 39.1% YoY to $9.39 in FY ending October 2026 and 35.6% YoY to $12.72 in FY2027. The strong expected EPS growth showcases operating leverage, successful VMware integration, the benefits of higher margin software revenue, and rising AI revenue.  

During the last earnings call after winning the $10 billion XPU order from the new customer, Hock Tan said, “And reflecting this, we now expect the outlook for our fiscal 2026 AI revenue to improve significantly from what we had indicated last quarter.” We expect management to provide more details on the AI revenue outlook for FY2026. The Q4 management guide of $6.2 billion implies that Broadcom is guiding for $19.9 billion in AI revenue for FY2025, up 63% YoY from $12.2 billion in FY24. Analysts are pointing to 100% YoY growth in AI revenue in FY2026, with Mizuho estimating that AI revenue will grow 103% YoY to $40.4 billion. 

According to a recent report by The Information, Broadcom is in discussion with Microsoft to co-develop custom silicon chips. Analysts will likely ask for more details on this and other customers such as the $10 billion XPU order mentioned during the FQ3 earnings call and the OpenAI deal announced in October. The OpenAI deal is also expected to provide a strong boost to the company’s bottom line as UBS expects “large-scale deployments are expected to ramp later, positioning EPS to reach about $13.50 in 2027 and potentially above $20 by 2028 as projects come fully online.” It highlights that the current consensus adjusted EPS estimates for FY2028 of $15.80 are very low, a 27% difference. 

Hock Tan often references the AI Serviceable Market. We could expect Tan to provide an update for 2027 at the next earnings call, as the company has been adding new customers over the past year. Hock Tan had said during the FQ4 earnings call in December last year, “In 2027, we believe each of them plans to deploy 1 million XPU clusters across a single fabric. We expect this to represent an AI revenue Serviceable Addressable Market, or SAM, for XPUs and network in the range of $60 billion to $90 billion in fiscal 2027 alone.” 

Conclusion: 

This year, Broadcom stock has outperformed Nvidia’s stock despite the two being about $200 billion apart in AI revenue with Broadcom at $20 billion in AI revenue for FY2025 ending in October and Nvidia at $250 billion run rate in the quarter ending in Jan. Nvidia clearly has the scale for R&D purposes to help defend its lead. However, I’ve also argued inference will provide an opening for Broadcom and AMD to meaningfully compete on AI accelerators.  

At the I/O Fund, when discussing Nvidia versus Broadcom, the answer is yes and yesyes and yes. We look for fundamental strength, product positioning, supply chain signals, and numerous other proprietary criteria to help us determine if a stock is participating in the AI trend.  

I won’t yank your chain by pretending investors must choose one or the other. In a widening market, leadership compounds at the top and radiates outward as exponential demand will lift the entire ecosystem – including a ripple effect for lesser-known AI networking and AI energy names. 

As we move deeper into the second half of this AI-driven decade, the investors who stay focused on the bigger picture — rather than react to every speculative headline or force themselves into a false binary — will be the ones best positioned to capture the full opportunity of the AI Monetization Supercycle. 

This year, my firm has 15 positions beating the Nasdaq YTD, up from ten positions last year – helping to cement the I/O Fund as one of the world’s leading AI portfolios. Our cumulative return of 210% over a five-year period would rank us #2 if we were a hedge fund and #5 if we were an ETF – notably, this strong cumulative return does not yet include our 2025 performance.

Get real-time trade alerts, weekly webinars and deep dives on lesser-known AI stocks in our Advanced tier. Learn more hereLearn more hereLearn more here

Please note: The I/O Fund conducts research and draws conclusions for the company’s portfolio. We then share that information with our readers and offer real-time trade notifications. This is not a guarantee of a stock’s performance and it is not financial advice. Please consult your personal financial advisor before buying any stock in the companies mentioned in this analysis. Beth Kindig and the I/O Fund own shares in AVGO at the time of writing and may own stocks pictured in the charts.

Recommended Reading:

  • Nvidia Stock and the AI Monetization Supercycle No One Is Pricing In
  • I/O Fund Called the Bitcoin Selloff: What Liquidity & DXY Data Predict Next
  • Why Nvidia Stock Could Reach a $20 Trillion Market Cap by 2030
  • Big Tech’s $405B Bet: Why AI Stocks Are Set Up for a Strong 2026
Posted in AI StocksLeave a Comment on Broadcom Stock: The Silent Winner in the AI Monetization Supercycle

Nvidia Stock and the AI Monetization Supercycle No One Is Pricing In

Posted on December 4, 2025June 30, 2026 by io-fund
Nvidia Stock and the AI Monetization Supercycle No One Is Pricing In

Two weeks ago, Nvidia blew the doors off with an earnings report that defies the company’s mega-cap scale. The long-awaited Blackwell and Blackwell Ultra architectures are shipping in volume, leading to 25% QoQ growth in the data center segment and surpassing a $200 billion data center run rate. Despite this, Nvidia’s stock barely budged as the market ignored the magnitude of the QoQ inflection. Consider that Apple, trading at a similar market cap, has not seen 66% YoY growth for fourteen years, and it required a global pandemic for Apple to report 25%+ QoQ growth outside of its holiday quarter.  

When we narrow it down to Nvidia’s last earnings report – let alone subsequent reports – there is truly no comparison going back for a decade or more. However, the market dismissed the results and is instead stuck in a pit of speculative fears – meaning, there is no evidence in the financials, management commentary, industry estimates, or product roadmap (collectively referred to as “data”). Nonetheless, hypothetical risks that are immaterial today have become loud enough to bury an otherwise epic earnings report. 

As I pointed out on Charles Payne’s Making Money, I live for those moments when a company delivers a strong earnings report and yet the market hands me a lower price.  

Underneath the noise of “AI bubble” debates, Google’s TPUs, debt leverage (which is a material issue), China fears (remember the DeepSeek panic?), supply chain constraints, rare-earth material shortages, and more — I like to remind investors that those risks were immaterial to Nvidia’s recent report or management’s guide. 

Therefore, I maintain that the greatest risk is not an AI bubble or the credibility of these other risks – rather it’s that an investor misses out on what may be one of the strongest investing opportunities of our lifetime: what I’ve dubbed the AI Monetization Supercycle catalyzed by the inference phase. 

Keep in mind that to short a stock like Nvidia could hypothetically return 30% or 40% whereas going long has returned over 3,500% since the I/O Fund’s first entry. It was not only Nvidia we participated in, but rather the I/O Fund has offered one of the strongest AI portfolios in the world – proven by our strong cumulative return. Currently, we have 15 positions, beating the Nasdaq YTD up from ten last year. 

Below, I outline what I see ahead — points that warrant far more attention than the familiar media narratives, which have repeatedly underestimated the magnitude of the AI trend. Instead, you’ll find data-driven conclusions on the incoming monetization wave, including new insights to help investors connect the dots on what 2026–2027 may bring.

For a limited time, we’re offering $250 off our Advanced Tier. This Black Friday deal ends December 8th. Join here.For a limited time, we’re offering $250 off our Advanced Tier. This Black Friday deal ends December 8th. Join here.Join here.

OpenAI's Record $13B Revenue Confirms the AI Monetization Supercycle 

To see the AI monetization Supercycle in action, we can simply look at OpenAI’s trajectory. The company went from $1 billion in revenue in 2023 to $3.7 billion in 2024 to now $13 billion in annualized revenue, which is the steepest rise in tech history. This was driven almost entirely by inference (API calls and ChatGPT usage). Furthermore, OpenAI recently stated revenue is “well more” than $13 billion.  

The clues from OpenAI’s monetization trajectory is key as the market is anxiously awaiting the moment that Big Tech will show ROI from capex spend, and according to Broadcom and others, that day may soon be arriving.  

Over the past year, Broadcom joined Nvidia, Alphabet, and Microsoft in calling out surging AI inference demand, noting that this rapid growth could drive increased demand for custom silicon in the second half of 2026, and with it, higher AI revenue.  

Broadcom sees growth continuing, supported by the inference growth curve, as CEO Hock Tan said during FQ2 earnings call that Broadcom might witness an acceleration of XPU demand into the back half of 2026. He said, “In fact, what we've seen recently is that they are doubling down on inference in order to monetize their platforms. And reflecting this, we may actually see an acceleration of XPU demand into the back half of 2026 to meet urgent demand for inference on top of the demand we have indicated from training.” 

Something similar was echoed in the most recent FQ3 call, with Tan stating: “But also as for these guys, they got to be accountable to being able to create cash flows that can sustain their path. They [are] starting to also invest in inference in a massive way to monetize their models.”

mid

CoreWeave’s Q2 earnings call also echoed the incoming inference wave will lead to a period of heightened monetization: “As I always say, inference is the monetization of artificial intelligence.” 

Matthew Bryson, Managing Director of Research at Wedbush Securities, expressed optimism on the broader AI sector’s shift toward revenue generation through inference applications, stating “What we’ve started to see over the last three, four months is that there’s been a huge increase in inference. This increase in inference – the applications that drive actual revenue for cloud providers and model builders – represents a critical development for the sector. It feels like right now we’re also seeing monetization of AI, and that was the concern,” he added. “If you’d asked me 12 months ago, where’s the revenue going to come from? All we’re seeing is model building, and now it looks like we’re not. We’re seeing applications.” 

I/O Fund Lead Technology Analyst Beth Kindig discusses Nvidia’s stock after Q3 FY 2026 blowout earnings report on Fox Business

How OpenAI and Anthropic Projections Validate Nvidia Stock 

OpenAI and Anthropic are boosting long term revenue projections, underpinned by inference and inference-driven products such as AI agents. For example, in the most recent projection, OpenAI raised the tail end of its long-term forecast by as much as 25% from 2027 to 2029 versus its fall 2024 projection.  

OpenAI now sees $54 billion in revenue in 2027, a nearly 23% raise from its prior projection for $44 billion, and $125 billion in revenue in 2029, a 25% raise. Notably, this growth is not stemming from ChatGPT, where 2029 revenue was actually cut from the mid-$50 billion range to $50 billion; instead, OpenAI projects around $20 billion from APIs, over $25 billion from AI agents and another $25 billion from other products and free user monetization (such as ads). For comparison, the $125 billion target reflects nearly 10X growth from 2025’s projected revenue of $13 billion. 

Chart showing OpenAI's long-term revenue forecast raised to $125 billion by 2029, a 25% increase driven by AI Agents and Inference applications, supporting Nvidia stock bullish outlook.

Chart detailing OpenAI's raised long-term revenue projections to $125 Billion by 2029, a 25% increase over prior forecasts. This growth, fueled by Inference applications, validates the Nvidia Stock bull thesis. Source: The Information.The Information.

Competitor Anthropic is also expecting rapid revenue growth through 2028, now projecting as much as $70 billion in revenue in its optimistic scenario as of early November. This forecast is supported by Anthropic’s near-term growth expectations for its ARR, with the company said to be on track to hit its $9 billion goal this year with a target to double or nearly triple this to $20-26 billion in 2026.  

API revenue for Anthropic is expected to reach $3.8 billion in 2025, more than double OpenAI’s expectation for $1.8 billion, with Anthropic’s Claude Code model said to be close to reaching $1 billion in annualized revenue, up 150% from $400 million in July. 

Recent token usage statistics from Google and OpenAI also suggest that this wave of AI inference is on rapidly on the rise. In October, Google boasted more than 1.3 quadrillion monthly tokens processed across its platform, up from 980 trillion in June and up 170% from 480 trillion just five months earlier in May. 

Google also disclosed that its first party models like Gemini were processing 7 billion tokens per minute via direct API use in Q3, or more than 300 trillion monthly, roughly one quarter of Google’s overall tokens processed. This also outpaces OpenAI, which revealed in early October that it was processing 6 billion tokens per minute on its API, or ~260 trillion per month. 

To put this in perspective, Google was processing just 9.7 trillion tokens per month in April 2024. Barely a year and a half later, and the company is almost processing that many tokens per minute. 

Making headway on token throughput directly relates to the strength of Nvidia’s stock. For example, Microsoft has recently achieved a new AI inference record, with its Azure ND GB300 v6 virtual machines processing 1.1 million tokens per second on a single rack powered by Nvidia GB300 GPUs. It also marked a 27% speed improvement from 12,022 tokens/s per previous-generation Nvidia Blackwell GPU to 15,200 tokens/sec per Blackwell Ultra GPU and beat the previous Azure ND GB200 v6 record of 865,000 tokens/s by 27%. 

AI Will Drive Strong Bottom Line Results Too 

AI will not only impact the top line but will drive internal efficiencies to where there the first clue there is ROI on capex spend may be found in margin improvement.  

Big Tech management teams are having initial discussions on the impact of using AI to drive operational efficiencies. 

Alphabet’s CFO said in the Q2 earnings call, “So Sundar mentioned earlier, the use of AI tools within the company. So that's another area where we can drive efficiency across the businesses to use these tools internally in terms of how we run the organization. Then we're continuing on the same efforts that I've talked about before with regards to running the company with a high level of discipline, execution and driving efficiency across the business.” 

According to McKinsey survey, most respondents say their organizations are using AI, and many have begun using AI agents as 64 percent of respondents said that AI is enabling innovation and 39 percent report positive EBIT impact at the enterprise level. 

CrowdStrike announced earlier this year that the company was laying off 500 employees or about 5% of its workforce, due to artificial intelligence efficiencies. According to the World Economic Forum survey, about 41% of companies worldwide are expected to reduce their workforces in the next five years attributing to the rise of artificial intelligence.  

Amazon announced in October that they are laying off 14,000 employees as the company invests more in AI. It marks the largest jobs cuts in the company’s history. Beth Galetti, SVP at Amazon said, “This generation of AI is the most transformative technology we’ve seen since the Internet, and it's enabling companies to innovate much faster than ever before (in existing market segments and altogether new ones). We’re convinced that we need to be organized more leanly, with fewer layers and more ownership, to move as quickly as possible for our customers and business.” The company’s CEO warned about the job cuts in June this year. “We will need fewer people doing some of the jobs that are being done today.” Klarna has been most transparent about the impact of AI, revealing earlier this year that the company reduced its workforce by 40%.  

Meta also revealed in October that the company will cut 600 positions from its Artificial Intelligence unit, which underscores the internal efficiencies that AI enables. This should not be confused with a pullback in AI investment — Meta is clearly spending heavily here, with capex increasing by 81% or $31.8 billion this year.  

Morgan Stanley expects that software and internet companies to report positive return on investments from GenAI of 35% in 2025 and rise to 67% contribution margin by 2028. “[…] In fact, for the first time, return on investment (ROI) is expected to be positive with analysts expecting GenAI to yield a 34% contribution margin, or the equivalent of $51 billion in 2025. Last year, GenAI ROI, with expenses, resulted in a -5% contribution margin. By 2028, ROI is expected to remain positive and rise to a 67% contribution margin, or $722 billion return.” 

According to J.P.Morgan, “Since the launch of ChatGPT in late 2022, AI-related stocks have been responsible for roughly 75% of S&P 500 total returns, 80% of earnings growth and 90% of capital spending growth. That means AI is more than just hype – it is delivering tangible results, boosting productivity and supporting corporate margins across the economy.”  

While the media will put a negative spin on those stats, I personally look at the earnings growth piece specifically as an initial clue as to the impact that AI is having. 

Nvidia Stock Shatters Records: $50B Data Center Revenue at 66% YoY Growth  

As stated in the introduction, Nvidia blew the doors off its most recent earnings report, with the long-awaited Blackwell and Blackwell Ultra architectures now shipping in volume. Given how much time has been wasted on fearful speculation around the AI leader and the overall AI market, I think it’s appropriate to spend at least a few minutes grounding ourselves in Nvidia’s fundamentals. 

Nvidia’s Q3 revenue grew by a solid 62.5% YoY and 22% QoQ to $57.01 billion. Revenue growth accelerated by 6.9 percentage points from 55.6% YoY growth reported in Q2. Revenue beat estimates by 3.5% and is the strongest beat in the last four quarters. The company’s strong revenue growth dispelled fears of an AI Bubble. Nvidia’s CEO Jensen Huang said, “Blackwell sales are off the charts, and cloud GPUs are sold out.”  

In Q3, the GB300 sales were higher than GB200 sales, accounting for 2/3 Blackwell’s revenue, proving strong demand from cloud companies and hyperscalers. Looking forward, Rubin is on track to ramp in the second half of 2026 – which may help Nvidia continue to beat analyst estimates, especially as we approach CY2027 

Management also provided a strong Q4 revenue guide of $65 billion at midpoint, representing a YoY growth of 65.3% and up 14% QoQ, beating estimates by 5.1%. 

The company’s networking growth was an outlier, growing 162% YoY and 13% QoQ to $8.19 billion. Revenue growth accelerated by 84 percentage points from 78% YoY growth in Q2. Management stated in the earnings call that the company’s networking business is now the largest in the world.  

Nvidia surpassed the $50 billion quarterly data center revenue milestone in Q3, reporting $51.2 billion in revenue for the segment, up 25% QoQ and 66% YoY. This is the highest QoQ growth rate for data center in nearly two years since fiscal Q4 2024. An impressive feat to deliver such strong growth at scale considering the segment was just $18.4 billion when Nvidia last reported this QoQ growth.  

On a dollar basis, data center revenue rose by $10.1 billion sequentially. This sequential growth was driven by a strong inflection in Compute revenue, which surged 27% QoQ to $43 billion, its highest sequential growth rate since fiscal Q1 2025; however, this does come after a (1%) QoQ decline in fiscal Q2. Nvidia noted that Blackwell Ultra was ramping across all customer categories and became its leading architecture.  

Chart illustrating Nvidia's Data Center revenue growth, jumping $10.1 billion quarter-over-quarter to $51.2 billion in Q3, with Q4 guidance projecting up to $59 billion, reinforcing the bullish Nvidia stock thesis.

Chart of Nvidia's Data Center Revenue. The segment's QoQ growth surged $10.1 Billion in Q3 to $51.2 Billion, validating the Nvidia Stock bull thesis. While Q4’s guidance suggests the segment could reach $59 billion.

Q4’s guidance suggests that this $50 billion data center segment will quickly be in the rear-view mirror, with the $65 billion guidance implying data center revenue of around $59 billion assuming similar mix shift as Q3. This represents another 15% QoQ growth on top of Q3’s 25%, or essentially the data center segment rising nearly 44% in just two quarters.  

This would also correspond to a nearly $8 billion QoQ increase, meaning that if Nvidia maintains this growth cadence through mid-CY26, then it would reach our prediction for a $75 billion data center segment two quarters early. If this materializes, this would represent data center growth of 66% YoY, up from 56% last quarter.  

It also could suggest Nvidia potentially reaching a $90 billion quarterly data center segment if this trajectory is maintained through the end of fiscal 2027. For investors, this rapid acceleration reinforces the bullish outlook for Nvidia stock, as these revenue milestones increasingly align with long-term valuation targets. 

However, it is important to note that given the sheer scale of data center revenue, there is the potential for this inflection to be lumpy, especially in-between GPU generations. 

NVDA Blackwell Revenue Surpasses $100 Billion, Validating $500B Data Center Visibility 

As stated in our analysis “Why Nvidia Stock Could Reach a $20 Trillion Market Cap”, after taking into account Jensen Huang’s commentary in October that $500 billion in Blackwell-Rubin revenue that will ship by the end of FY2026, my firm estimates this leads to a $320 billion data center segment next year.  

Here is what was stated in the $20 Trillion analysis: “Reading between the lines on Huang’s comments suggests strong upside to Nvidia’s data center revenue through 2026. Over the prior three quarters heading into fiscal Q3’s report, Blackwell revenue has totaled approximately $63 billion. Including Networking over that time frame, total revenue would rise to $78 billion, still a fraction of the total overall opportunity management is projecting. Thus, if we assume that Blackwell and Rubin ramp over the next five quarters, fiscal 2027 data center revenue could be nearly $320 billion, versus estimates for around $270 billion.”   

We calculated this from the prior three quarters heading into fiscal Q3’s report; Blackwell revenue has totaled approximately $63 billion. Now, Q3’s Compute revenue of $43 billion implies Blackwell has delivered around $104 billion in revenue in the past four quarters, assuming the only non-Blackwell revenue was the $2 billion disclosed from Hopper.   

Including Networking and Q4’s guidance, Nvidia looks to be on track to generate $186 billion of its $500 billion opportunity in fiscal 2026. This would leave approximately $314 billion for fiscal 2027’s data center revenue to meet the $500 billion visibility, but if Nvidia can exceed that by 2-4%, it could be on track for $330 billion next year.  

At a 20 to 25 forward sales valuation, Nvidia only needs to grow its data center segment 3X to $920 billion to reach a $20 trillion market cap. 

In fact, further strengthening the $20T market cap prediction, Nvidia’s CFO has hinted they could exceed $500 billion as the CFO stated, “So there's definitely an opportunity for us to have more on top of the $500 billion that we announced.” Nvidia’s CFO later clarified this week at UBS’ tech conference that the “$0.5 trillion doesn't include any of the work that we're doing right now on the next part of the agreement with OpenAI” signed in late September for up to 10GW of compute. 

Nvidia Stock: $50 Billion Supply Commitments Guarantee Continued Growth Inflection 

What differentiates the I/O Fund’s research is that we constantly tell our members the key indicators to look at in a company’s earnings report. While we continue to hammer on the importance of Big Tech’s capex as the number one indicator for Nvidia’s data center growth continuing, there was potentially a more important, well overlooked figure in Nvidia’s report that signals this data center inflection will continue.   

Nvidia’s total supply-related commitments, such as for CoWoS wafers, HBM memory, or other components, surged nearly 52% QoQ to $50.3 billion in Q3, with management noting that they are “ordering to secure long lead-time components, meet the demand for Blackwell, and support future architecture ramps.”   

This is a notable increase from the prior five-quarter average of ~$30 billion, which is likely supporting the current ramp in data center revenue. This uptick in supply commitments, which is likely to translate into inventories and revenue over the coming four to six quarters, hints that Nvidia will continue ramping Blackwell output while preparing for Rubin’s production in the second half of 2026.    

Chart showing Nvidia's total supply commitments rising 52% quarter-over-quarter to $50.3 billion in Q3, indicating strong order volumes to secure Blackwell and Rubin production, reinforcing Nvidia stock growth outlook.

Chart detailing Nvidia's commitment surge. Total Supply Commitments jumped 52% QoQ to $50.3 Billion in Q3, signaling massive order volume to secure Blackwell and Rubin production and Nvidia Stock growth.

This also bolsters confidence in Nvidia’s order visibility to fill out and even exceed this cumulative $500 billion in Blackwell and Rubin revenue, as the company would not need to boost supply commitments by this degree if the demand signals were not there.

In Closing …. 

Nvidia’s Q3 results showed the company’s GPU momentum return, delivering a substantial data center beat with 25% QoQ growth, surpassing an important $50 billion quarterly revenue milestone for the segment. More importantly, Nvidia’s guide pointed to this momentum continuing into the fourth quarter, implying that data center revenue could be on track to increase another $8 billion QoQ for 15% growth.  

I published an article entitled Why Nvidia Stock Could Reach $20 Trillion Market Cap by 2030 Why Nvidia Stock Could Reach $20 Trillion Market Cap by 2030 – a prediction that requires a 36% CAGR over a five-year period or about 8% growth QoQ. These two quarters alone meet the criteria for next year’s CAGR plus some. 

Nvidia’s results provide a strong message that AI is not in a bubble. While many are busy debating this point, we are laser focused on identifying the companies that are going to benefit from the monetization of AI, particularly due to the shift from Big Tech companies from training to inference.

This year, my firm has 15 positions beating the Nasdaq YTD, up from ten positions last year – helping to cement the I/O Fund as one of the world’s leading AI portfolios. Our cumulative return of 210% over a five-year period would rank us #2 if we were a hedge fund and #5 if we were an ETF – notably, this strong cumulative return does not yet include our 2025 performance.

For a limited time, we are offering $250 off on our Advanced tier $250 off on our Advanced tier with real-time trade alerts, webinars, deep dives and access to our portfolio. This Black Friday deal expires soon on December 8th.Black Friday deal expires soon on December 8th.

To see our exact AI portfolio positioning including weightings of each of our holdings, along with real-time trade alerts, and the in-depth research that attracts media coverage from Fox to Bloomberg, we invite you to take advantage of our Black Friday Sale. Learn more here.take advantage of our Black Friday Sale. Learn more here.

Damien Robbins and Royston Roche, Equity Analysts at I/O Fund contributed to this analysis

Please note: The I/O Fund conducts research and draws conclusions for the company’s portfolio. We then share that information with our readers and offer real-time trade notifications. This is not a guarantee of a stock’s performance and it is not financial advice. Please consult your personal financial advisor before buying any stock in the companies mentioned in this analysis. Beth Kindig and the I/O Fund own shares in NVDA at the time of writing and may own stocks pictured in the charts.

Recommended Reading:

  • I/O Fund Called the Bitcoin Selloff: What Liquidity & DXY Data Predict Next
  • Why Nvidia Stock Could Reach a $20 Trillion Market Cap by 2030
  • TSM Stock and the AI Bubble: 40%+ AI Accelerator Growth Fuels the Valuation Debate
  • Palantir Stock Forecast 2025: Can PLTR Justify Its High Valuation?
Posted in AI StocksLeave a Comment on Nvidia Stock and the AI Monetization Supercycle No One Is Pricing In

Why Nvidia Stock Could Reach a $20 Trillion Market Cap by 2030

Posted on November 19, 2025June 30, 2026 by io-fund
Why Nvidia Stock Could Reach a $20 Trillion Market Cap by 2030

The statement that Nvidia stock could reach a $20 trillion market cap by 2030 will trigger plenty of emotion — it sounds fantastical, full of hype, or like a prediction made far too early in the AI cycle. Yet what I offer you below is a data-driven, fundamentally grounded case for how Nvidia can realistically reach a $20 trillion valuation by 2030. 

When it comes to Nvidia’s AI story, I’ve offered the earliest and most consistent analysis, covering the company’s AI trajectory earlier than anyone on record. For instance, I told my premium stock research members in September of 2019 that Nvidia would become one of the world’s most valuable companies when it was only a $110 billion valuation (it’s now up 40X). I also publicly stated that Nvidia would surpass Apple when Nvidia had just one-fifth of Apple’s market cap — $550 billion versus $2.5 trillion — writing: “The conclusion to my analysis is the same as the introduction, which is that I believe Nvidia is capable of outperforming all five FAAMG stocks and will surpass even Apple’s valuation in the next five years.” Fast forward and Nvidia stock is up 8X since that analysis.

Last year, when Nvidia stock was valued at $3 trillion, I projected the stock would reach $10 trillion market cap by 2030 — a forecast that no longer looks aggressive now that the stock has briefly broken above $5 trillion. Today, with an even clearer view into the company’s product cadence, software moat, and AI systems dominance, my new, updated thesis is that Nvidia’s stock is on track to reach a $20 trillion market cap by 2030. 

This is supported by Nvidia’s aggressive 1-year product roadmap, an impenetrable software ecosystem through CUDA, and its evolution into a full-stack AI systems provider. When these elements are modeled together — alongside the rapid expansion in global AI infrastructure capex — the path to $20 trillion becomes less sensational and more a reflection of compounding fundamentals.

Nvidia’s Data Center Needs to Grow at 36% CAGR to Reach $20T Market Cap

To get down to brass tacks, Nvidia will have to grow its data center segment at a 36% CAGR to reach a $20 trillion market cap if we assume its 5-year median sales valuation of 25 forward PS remains intact. This will put the company’s data center revenue at a run rate in the mid-$900 billion range.

Illustration showing Nvidia’s potential $20 trillion market cap by 2030 driven by 36% CAGR in its data center business

Pictured above: Nvidia stock could see a $20 trillion market cap by 2030 based on a 36% CAGR in its data center segment

About eighteen months ago, I highlighted the importance of Nvidia reaching a $50 billion data center segment by year-end in the article, Here's Why Nvidia Stock Will Reach $10 Trillion Market Cap By 2030, stating: 

In my analysis last month on the Blackwell architecture, I made the argument these estimates are too low and that my firm expects we will see a $200 billion data center segment by end of CY2025 propelled forward by the B100, B200 and GB200, including the following points: “Taiwan Semi’s CoWos capacity, which is essential for Blackwell’s architecture, is estimated to rise to 40,000 units/month by the end of 2024, which is more than a 150% YoY increase from ~15,000 units/month at the end of 2023. Applied Materials has boosted its forecast for HBM packaging revenue from a prior view for 4X growth to 6X growth this year.” 

The data center segment for Nvidia of $320 billion by 2027 would result in 260% growth for Nvidia’s DC from where it stands today and up 120% from DC revenue estimates for end of CY2025.” 

It’s highly probable that Nvidia will blow past the $50 billion data center segment mark this evening – one quarter earlier than my original prediction – which puts the company on the path for a $75 billion segment in Q4 of next year. Tracking these milestones is crucial as it helps support that Nvidia is well on its way to reaching my firm’s brand-new updated estimate for a $230 billion data center quarter by Q4 of 2030 or $930 billion for the full year. 

Industry analysts have AI accelerators growing at 31.5% CAGR through 2033 with McKinsey putting out a prediction for $7 trillion in AI infrastructure spend through 2030 with $5.2 trillion going toward building data centers for AI workloads. Dr. Lisa Su and Jean Hsu echoed McKinsey’s projections, stating the AI data center market could be worth $1 trillion by 2030, referring to the addressable market of AI accelerators where AMD competes.

mid

Regardless of which way you dice it, industry estimates point toward AI spend exceeding current expectations. For example, Dr. Su originally had predicted a $500 billion market by 2028. Her updated forecast assumes 35% growth over the next three to five years – the same growth rate required for Nvidia to reach the assumptions underpinning my thesis for a $20 trillion market-cap scenario. 

McKinsey’s $5.2 trillion AI infrastructure forecast implies roughly $1.5 trillion in annual AI spending by 2030. Under this framework, our assumptions are slightly on the aggressive side, as they imply Nvidia captures about 60% of total AI capex. Back-of-the-napkin math suggests Nvidia is currently capturing closer to 50% of AI spend, given today’s $405 billion capex run rate and Nvidia’s data center segment set to surpass a $200 billion run rate in this evening’s report.

Bar chart showing Big Tech Capex for AI infrastructure growing from $406 billion in 2025 to over $1.5 trillion by 2030, highlighting massive AI data center market expansion

Pictured above: Big Tech AI Capex expected to surge from $406B in 2025 to over $1.5 trillion by 2030, reflecting the massive growth in the AI data center market.

Offense is the Best Defense: Nvidia’s Rapid Product Road Map

The saying goes “the best offense is the best defense” and Nvidia is fully applying this philosophy by leading with its design prowess to ensure custom silicon cannot replace its lead in AI systems. There will certainly be a market for custom silicon as it excels at application specific workloads, which is attractive to Big Tech companies that can use custom silicon to optimize their recommendation engines, run inference at scale and optimize specific internal models. However, custom silicon cannot compete with GPUs and Nvidia’s CUDA software platform on general workloads, which excels at running every model, every framework and every new architecture.  

The key reason that Nvidia can reach a $20 trillion market cap by 2030 is because the company is moving its GPU generation cadence to a rapid 12-18 month cycle compared to custom silicon, which is typically on a 3-5 year cycle. Even for Nvidia, the goal of releasing a new GPU generation every year was once unthinkable. Yet this offensive measure will be transformative, turning what was once a cyclical revenue profile into a consistent and compounding growth trajectory.  

Diagram of Nvidia’s GTC March 2025 product roadmap illustrating rapid one-year AI factory cadence with Blackwell (2025), Rubin (2026–2027), and Feynman (2028) platforms across Compute, NVLink, Networking, and System components, supporting I/O Fund’s $20 trillion market cap thesis

Source: Nvidia GTC Conference, March 2025  Last March, Nvidia revealed their plans for a 1-year product cadence, a key element to the I/O Fund’s thesis that Nvidia can reach $20 trillion market cap by 2030.

At this point, Nvidia is competing with itself with Blackwell offering 208 billion transistors compared to Hoppers 80 billion transistors. By combining 72 GPUs, the Blackwell systems offer 30X to 40X faster inference and are up to 2.5X faster on training. The memory capacity has increased to 192GB of HBM3e for Blackwell and 288GB for Blackwell Ultra. Energy efficiency is also improved by 25X. The 30X improvement in running AI reasoning models is primarily from leveraging FP4 format and fifth-generation NVLink at rack scale level. Blackwell arrived in H1 of 2025 and Blackwell Ultra is shipping now in H2 2025. 

Vera Rubin increases the number of GPUs to 144, up from 72 GPUs, for 3.3X higher performance. Vera Rubin doubles the FP4 performance from 20 petaflops to 50 petaflops. The new architecture will offer HBM4 memory and sixth-generation NVLink. Rubin Ultra takes rack-scale to a new level with 576 GPUs compared to Rubin’s 144, with more details to be released in the coming months. Vera Rubin is expected to arrive in H2 2026 with Rubin Ultra in H2 2027. 

From there, Feynman is expected to bring to market Gigawatt AI factories, which would be up about 8X from today’s peak cluster size of 150 MW (the largest cluster right now is Colossus at 150MW with plans to expand to 300MW soon). Feynman is expected to arrive in 2028. 

5X Hopper: Jensen Huang Reveals $500 Billion Blackwell and Rubin Revenue Visibility

Nvidia laid out an eye-opening stat at the company’s GTC October conference, with CEO Jensen Huang revealing the company has visibility into an astonishing $500 billion in cumulative Blackwell and Rubin revenue through the end of 2026. This is ~5X the lifetime revenue of its Hopper GPUs from 2023 through 2025 which stood at $100 billion.  

Huang’s projection calls for 20 million GPU shipments, with 30% of that, or 6 million, having already been shipped; however, considering both generations have two GPUs per chip, in reality, this corresponds to 10 million chip shipments with 3 million already shipped. Huang’s forecast also excludes China but is expected to include attached networking equipment such as Nvidia’s InfiniBand and NVLink. 

Reading between the lines on Huang’s comments suggests strong upside to Nvidia’s data center revenue through 2026. Over the prior three quarters heading into fiscal Q3’s report, Blackwell revenue has totaled approximately $63 billion. Including Networking over that time frame, total revenue would rise to $78 billion, still a fraction of the total overall opportunity management is projecting. Thus, if we assume that Blackwell and Rubin ramp over the next five quarters, fiscal 2027 data center revenue could be nearly $320 billion, versus estimates for around $270 billion. 

This forecast is supported by the accelerated progression in GPU cluster sizes, scaling quickly from 10K clusters just two years ago to hundreds of thousands over the next few years. The first 10K Hopper GPU clusters came online in 2023 and 2024, before scaling 10X to 100K clusters by year-end 2024. Blackwell is picking up where Hopper left off, with clusters expanding from 100K to the hundreds of thousands through 2026 and 2027, such as for Microsoft’s new Fairwater data centers and xAI’s Colossus 2. This scale out of 8-10X growth to reach 1 million GPU clusters over the next few years underpins millions of GPU shipments over the coming quarters. 

Consensus Estimates Still Below Nvidia's $500B Target for FY26/27

Even with the commentary for half a trillion in revenue potential for Blackwell and Rubin GPUs, consensus estimates for fiscal 2026 and 2027 still remain below $500 billion combined. This also comes despite numerous analysts pointing out that Street estimates are too low and citing substantial upside potential for data center revenue. 

Source: YCharts

Current consensus estimates point to $207.6 billion in revenue in fiscal 2026, before rising to $290.5 billion in fiscal 2027, with next year seeing only a $13 billion (5%) upward revision following the $500 billion forecast. It’s important to note that some of fiscal 2026’s revenue came from the Hopper generation, which contributed ~30% of Compute revenue in fiscal Q1, or more than $10 billion.  

However, analysts from Cantor, UBS, Melius and others believe estimates are too low moving through calendar 2026. New Street says the $500 billion forecast “implies a nearly doubling of Nvidia's data center revenue in 2026,” while Wolfe Research estimated that data center revenue "could be $60 billion over prior calendar 2026 estimates.”  

This suggests that the Street remains cautious about this order visibility materializing in full, as current consensus estimates would project data center revenue of ~$445 billion assuming ~90% share of total revenue. 

AI Buildout Accelerates: Big Tech Capex Headed for $405 Billion

Big Tech Capex grew by 75% YoY and 19% sequentially to $113.4 billion in Q3. In fact, capital spending for the AI buildout has risen 44.6% from our initial estimates. A substantial jump considering the scale already measured in hundreds of billions. This time last year, the expectations were $280 billion in Big Tech capex.  

Morgan Stanley later forecast $300 billion in Big Tech capex for 2025. Capex estimates stood at $365 billion heading into Q3, and now we believe 2025 capex is on track to surpass $405 billion, representing YoY growth of 62%. This spells good things for the I/O Fund’s projected 36% CAGR for Nvidia’s data center to materialize. 

Overall, analysts have clearly underestimated the growth in capex and future AI opportunities. This is also evident when AMD’s CEO Lisa Su recently increased the company’s AI total addressable market to $1 trillion in 2030, up from the previous forecast of $500 billion by 2028.  

In terms of what the opportunity looks like moving forward, McKinsey is predicting 3.5X growth in gigawatts for AI data centers between 2025-2030. The costs associated with AI data centers range from $3 trillion to $8 trillion, or about $5.5 trillion at the midpoint. This correlates to about 3X growth if we assume the current run rate to 2030 is $1.8 trillion at the current capex of $405 billion. 

UBS recently upgraded the AI capex estimates from the previous $375 billion to $423 billion for 2025. For the next year, they have increased the estimates from $500 billion to $571 billion, a solid 14% increase. By the year 2030, UBS expects overall spending to hit $1.3 trillion, implying a 25% compound annual growth rate (CAGR) over the next five years – or about 11 points lower than our estimate for 36% CAGR – although I still have five years to go for analysts to raise their estimates, which judging by what we’ve seen in capex estimates, could very well be doable. 

Another point as to why AI spending estimates may be too low is they are still modest to global GDP. According to IMF estimates, the $1.3 trillion capex estimate would only account for 1% of GDP, whereas some of the previous investment booms like railroads, computers, telco, etc. – ranged from 1.5% to 4.5% of global GDP. 

Nvidia’s Deals with OpenAI and Microsoft Fuel Insatiable GPU Demand

If a $20 trillion market cap sounds outlandish, consider the deals worth hundreds of billions that are pouring in. Not only does Nvidia have the $500 billion Stargate project underway for OpenAI, but the ChatGPT parent also committed to an additional $250 billion of compute from Azure as part of its for-profit restructure.  

Additionally, Nvidia signed a partnership with OpenAI, which will see it deploy up to 10GW of Nvidia GPUs in data centers. Under the deal, Nvidia is investing up to $100 billion in OpenAI progressively as each GW is deployed. The first GW of GPUs under Nvidia and OpenAI’s agreement will be deployed in the second half of 2026 on Nvidia’s upcoming Vera Rubin platform. While there was no set timeline for the remaining nine GWs of chips, CEO Jensen Huang told CNBC that the entire deployment would represent around four to five million GPUs.  

In terms of the total opportunity for Nvidia, Bank of America estimates this partnership could generate $300 billion to $500 billion in revenue overtime at full deployment. This aligns with expectations from other analysts that Rubin and Rubin Ultra will cost $30 to $35 billion per GW, with 10-15% increases per GW per each generation. 

Microsoft also contracted approximately 200,000 GB300s from British startup Nscale in a deal said to be worth $14 billion, with the first smaller-scale deployment starting in Q1 followed by a 104,000 cluster in Q3 2026. This builds on Microsoft CEO Satya Nadella hinting last weekend that Microsoft is bringing online more than 100,000 GB300s this quarter, or approximately 1,389 NVL72 racks worth ~$4.17 billion at a $3 million estimated ASP.  

Deals like these that continue to pop up across the industry hint that demand for GPUs remains insatiable to meet high demand. It also suggests current capex estimates may be too low as hyperscalers continue to pour tens of billions each quarter to data center infrastructure via whatever avenue possible. 

Conclusion: 

When you step back from the noise and look at the data, the path to $20 trillion is built on compounding fundamentals that are already surpassing the most aggressive forecasts from a year ago. Analysts continue to revise capex expectations higher, AI infrastructure projections have doubled, and Big Tech is racing to deploy unprecedented levels of compute. 

The data center segment growing 36% CAGR is a tad ambitious, yet it does not factor in markets such as robotics, agentic systems and simulation. Also consider we are seeing 5X growth from the Hopper cycle to the Blackwell-Rubin cycle in the data center segment. At the end of 2026, we will need only 3X growth to deliver on my prediction of a $930 billion data center segment. 

Today, my updated thesis is clear: Nvidia has a credible path to reach a $20 trillion market cap by 2030 with an aggressive product road map for Blackwell, Rubin, Rubin Ultra and eventually Feynman’s gigawatt-scale AI factories. Just as with my earlier calls on Nvidia’s stock, the data increasingly supports an outcome that was once considered impossible.

As AI accelerates into the largest technology buildout of our lifetime, we believe Nvidia remains one of the strongest beneficiaries. Our portfolio is also positioned with many of Nvidia’s lesser-known AI networking suppliers and AI energy stocks. To view the I/O Fund portfolio plus my 43-page Top 15 AI Stocks list, sign up below.  

For Black Friday, we’re offering one of our biggest sales of the year — $250 off our Advanced Market Signals flagship tier. Sign up here.

Our cumulative return of 210% would place us as #2 if we were a hedge fund and #5 if we were an ETF. Our entries and exit are sent in real-time including one entry as low as $3.15 on Nvidia in 2018 and 9 alerts sent under $20 in 2021 – 2022. This year, we have an AI energy position up over 500% and others up over 100% in AI energy and AI networking. Learn more here.210% would place us as #2 if we were a hedge fund and #5 if we were an ETF. Our entries and exit are sent in real-time including one entry as low as $3.15 on Nvidia in 2018 and 9 alerts sent under $20 in 2021 – 2022. This year, we have an AI energy position up over 500% and others up over 100% in AI energy and AI networking. Learn more here.

Please note: The I/O Fund conducts research and draws conclusions for the company’s portfolio. We then share that information with our readers and offer real-time trade notifications. This is not a guarantee of a stock’s performance and it is not financial advice. Please consult your personal financial advisor before buying any stock in the companies mentioned in this analysis. Beth Kindig and the I/O Fund own shares in NVDA at the time of writing and may own stocks pictured in the charts.

Recommended Reading:

  • Big Tech’s $405B Bet: Why AI Stocks Are Set Up for a Strong 2026
  • Market Cycles, Not Headlines: What History Says About the 2025 Rally and What Comes Next
  • Decoding the S&P 500: When Human Sentiment Meets Artificial Intelligence
  • TSM Stock and the AI Bubble: 40%+ AI Accelerator Growth Fuels the Valuation Debate
Posted in AI StocksLeave a Comment on Why Nvidia Stock Could Reach a $20 Trillion Market Cap by 2030

Big Tech’s $405B Bet: Why AI Stocks Are Set Up for a Strong 2026 

Posted on November 13, 2025June 30, 2026 by io-fund
Big Tech’s $405B Bet: Why AI Stocks Are Set Up for a Strong 2026 

AI accelerators such as GPUs and custom silicon need no introduction. Compute has led the AI boom; a trend so powerful, it is displacing the FAANGs of the last decade with Nvidia firmly the world’s most valuable company and infrastructure suppliers like Broadcom has pushed past legacy peers such as Meta in market cap.  

As the market weighs the so-called AI bubble, there are many disparate facts thrown at investors: dot-com analogies, tariff headlines, short-term stock pullbacks, and circular investments from companies such as OpenAI. What matters far more for the AI trade than all of these combined is Big Tech capital expenditures.  

The cumulative amount that Big Tech is spending far outweighs the importance of earnings reports, fiscal year guidance, Nvidia’s networking growth or their product roadmap, if AMD has a new deal from OpenAI, Oracle’s insane RPO, Broadcom’s networking chips and custom silicon announcements – all of the above is being single-handedly driven by Big Tech’s large capital expenditure (capex) budgets.   

The latest quarter showed a 19% QoQ increase in Big Tech spending, confirming continued conviction in the build-out of AI infrastructure. Each tech giant is dedicating tens of billions toward AI systems, confident in the growth and customer value these services generate. As we look toward 2026, the direction of AI stocks will continue to follow the trajectory of Big Tech CapEx — and right now, that trajectory is pointed higher. 

AI Capex Forecasts Keep Accelerating: The $405 Billion Reality 

One of the most persistent patterns since the AI boom began is that analysts have been behind the curve on capital-spending forecasts. As you’ll see below, expectations have risen quarter after quarter as Big Tech’s actual investments repeatedly outstrip projections. What started as a $250 billion estimate for AI-related CapEx in 2025 now sits above $405 billion. The scale and urgency of hyperscaler build-outs suggest that even today’s elevated numbers could again be revised higher in 2026. 

In fact, capital spending for the AI buildout has risen 44.6% from initial estimates, a substantial jump considering the scale already measured in hundreds of billions. This time last year, the expectations were for $280 billion in Big Tech capex. 

Morgan Stanley later forecast $300 billion in Big Tech capex for 2025. Capex estimates stood at $365 billion heading into Q3, and now we believe 2025 capex is on track to surpass $405 billion, representing YoY growth of 62%.  

It’s easy to tune out the words “big tech capex” at this point but zoom out for a minute and consider that Big Tech’s TTM capex was $24B at the start of 2015, or up 15X over ten years.  Where we end up by the end of the decade on capex spending will likely represent the biggest “boom” in history. 

In terms of what the opportunity looks like moving forward, McKinsey is predicting 3.5X growth in gigawatts for AI data centers between 2025-2030. The costs associated with AI data centers range from $3 trillion to $8 trillion, or about $5.5 trillion at the midpoint. This correlates to about 3X growth if we assume the current run rate to 2030 is $1.8 trillion at the current capex of $405 billion. 

On a more near-term basis, Goldman Sachs sees hyperscaler capex increasing sharply through 2027 – capex is projected to be $1.15 trillion from 2025 through 2027, more than double the $477 billion spent from 2022 through 2024.  

Going back to the first point, analysts thus far have missed the mark in their estimates. Every quarter, sell side analysts rush to update their models. Therefore, the I/O Fund is penciling in that 3x is a baseline to work with over a 5-year time frame. 

Big Tech AI Capex Jumps 75% YoY in Q3 to a Record $113.4 Billion 

Big Tech Capex grew by 75% YoY and 19% sequentially to $113.4 billion in Q3. Most importantly, Q3’s 75% growth rate was the strongest growth so far this year, accelerating 12 points from 63% growth in Q2. This spells good things for key suppliers in the coming quarter.  

Big Tech Capex increased by 75% YoY to $113.4 billion in Q3 2025. 

Amazon’s Raises Annual Capex Guidance to $125 Billion 

When listening to commentary on earnings calls, in sharp contrast to concerns over an AI bubble, what we hear from Big Tech management teams is a sense of urgency. From Amazon’s Andy Jassy last quarter: “The faster we grow, the more CapEx we end up spending because we have to procure data center and hardware and chips and networking gear ahead of when we're able to monetize it. We don't procure it unless we see significant signals of demand.”    

This sense of urgency was echoed again in Q3: “You're going to see us continue to be very aggressive investing in capacity because we see the demand. As fast as we're adding capacity right now, we're monetizing it.”

mid

This boots-on-the-ground commentary implies that Amazon has direct visibility into how quickly capacity is selling out and the level of demand that can be met with accelerated capex investments. This is further supported by monetization trends in Amazon’s custom silicon business, Trainium, which reached a multi-billion dollar run rate, up 150% QoQ this quarter. 

Amazon’s capex in Q3 rose 55% YoY to $35.1 billion, with the company raising the 2025 capex guidance to $125 billion, up 51% YoY. This represents more than 88% of projected operating cash flow for the company and more than 17% of revenue.  

By spending more than its hyperscaler peers, Amazon was able to add 3.8 GW of capacity over the past 12 months, the most out of the group.  

Microsoft’s Q3 Capex Sees 75% Increase YoY 

Microsoft’s capex in Q3 was $34.9 billion, an increase of 75% YoY from $20 billion in the year-ago quarter. Sequentially, it grew by 44% YoY from $24.2 billion in the previous quarter.  The company’s strong capex growth was primarily driven by increasing demand for its Cloud and AI offerings. This quarter, approximately half of the capex spend was on short-lived assets, primarily GPUs and CPUs, to support the Azure platform, first-party apps at AI solutions, and accelerating R&D activities. The remaining spending was for long-lived assets that will support monetization in the long term.

With strong accelerating demand, Microsoft is increasing its spending on GPUs and CPUs. Therefore, total spending is expected to increase sequentially in the next quarter and now expects the FY 2026 growth rate to be higher than FY 2025.  To provide context, FY2025 ending June capex grew by 58% YoY to $88.2 billion.  

Big Tech is set to spend $405 billion building the AI infrastructure of the future — and we invest in the companies set to benefit most. Discover how the I/O Fund tracks, analyzes, and identifies beneficiaries of this unprecedented CapEx cycle. Learn more here.Learn more here. 

Alphabet Guides 2025 Capex Growth of 75% 

The company’s capex grew by 83% YoY to $23.95 billion. Sequentially, it grew by 7% from $22.4 billion in the previous quarter. Most of the capex was spent on technical infrastructure with approximately 60% of that investment in servers and 40% in data centers and networking equipment. Management stated in the recent earnings call that they are witnessing positive returns on AI investments. “I would say it's not just early signs because we're seeing returns, obviously, in the Cloud business. You've heard us talk about the fact that we already are generating billions of dollars from AI in the quarter.” 

Looking forward, the company expects to invest aggressively due to the strong demand from cloud customers as well as the growth opportunities across the company. Management now expects the 2025 capex to be in the range of $91 billion to $93 billion in 2025, up from the previous estimate of $85 billion. It represents a YoY growth of 75% at midpoint. The capex is further expected to increase in 2026, which further supports our view that AI stocks will benefit in 2026. 

Meta Increases Capex Guide to 81% Growth 

Meta’s Q3 capex was $19.4 billion, up 111% YoY from $9.2 billion in the same period last year. Sequentially, it grew by 14% from $17 billion in the previous quarter. The strong growth was primarily driven by investments in servers, data centers, and network infrastructure. 

Management also increased the 2025 capex to a range of $70 billion to $72 billion, up from the prior outlook of $66 billion to $72 billion. It represents a YoY growth of 81% from the prior year. Due to the continued investments in AI infrastructure, Meta expects next year’s capex to be significantly higher than in 2025, particularly as their compute needs are higher than their expectations. Management stated in the earnings call, “As we have begun to plan for next year, it's become clear that our compute needs have continued to expand meaningfully, including versus our own expectations last quarter. We are still working through our capacity plans for next year, but we expect to invest aggressively to meet these needs, both by building our own infrastructure and contracting with third-party cloud providers.” 

Big Tech Capex Increase Provides a Boost to AI Stocks in 2025 

Since the beginning of the year, Big Tech Capex estimates have increased from $280 billion to $405 billion, an impressive 31% positive revision. Alphabet witnessed the highest positive revision of 47%. 

Big Tech Capex revisions boost AI stocks 

As seen in the chart below, AI stocks have outperformed the broader Nasdaq-100 index by a wide margin. We believe that this trend will continue in 2026 as Big Tech Capex continues to expand and the numerous earnings calls from companies indicate that demand far outweighs supply. 

AI Stock Micron returned 188% YTD in 2025. 

Source: YCharts 

Key Reasons Why Capex Spending Won’t Slow Down Anytime Soon 

To be objective, there are analysts calling for a stock market crash based on the risks around the consumer and a GDP that is propped up by capex spending.  

Stifel stated in August: “While the capex boom around AI temporarily supports GDP and asset prices, Stifel forecasts this bump will fade as corporate tech spending plateaus. Such a build-out, after all, occurs only once, while consumer spending power is entering a lull that could expose markets to abrupt correction.” 

There is weight to what Stifel is describing, which is why tariffs remained a risk on our last Top 15 AI stocks report and remain a risk for our latest report, as well. You can read more here about how the consumer is fairly weak under the hood, and how capex spending is creating a false impression that GDP is stronger than it is. 

Where I disagree with Stifel is the idea that “such a build-out, after all, occurs only once” AI infrastructure is not a fixed achievement — rather it is an evolving architecture with ambitions that expand each year. Each leap in model complexity and compute performance forces hyperscalers to re-architect their data centers roughly every one to two years. Power, cooling, memory bandwidth, and networking standards must all scale in tandem with new architectures such as Nvidia’s Blackwell and AMD’s upcoming MI400s. This constant cycle of upgrade and expansion makes AI CapEx structurally recurring, rather than a one-time boom, and illustrates why I view hyperscaler spending as a durable driver of AI semiconductor and infrastructure stocks. 

Although cloud was also architecture-driven, it reached its end goal rather quickly in terms of driving down costs and improving productivity, allowing companies to quickly scale while providing pay-as-you-go compute and services to disrupt the significant up-front costs from on-premise servers. The end goal for AI is far more ambitious, as it could take a decade or more before Big Tech accomplishes commercially viable AGI (general artificial intelligence). 

Early Signs of Heavy Debt Load from AI Buildout 

Over the last few years, capex was funded by cash flows and cash on the balance sheet of companies. However, this is now changing. There is a growing concern that the robust AI demand is fueled by significant levels of debt. 

Bank of America data shows that companies borrowed $75 billion in the last couple of months for spending on AI data centers. This is more than double the annual average issuance over the past decade. One of the reasons companies issue debt is that their capex exceeds their operating cash flows. The capex, excluding dividends and share repurchases, is reaching extreme levels of 94% of operating cash flows in 2025, up 18 percentage points from the 2024 levels. 

According to J.P. Morgan estimates, the build-out of data centers will require a staggering $1.5 trillion in investment-grade bonds over the next five years. They believe that every market, including both government and private credit markets, needs to be tapped to close the funding gap. What will happen if this original estimate is too low, as well? 

Analysts already project that $300 billion of high-grade bonds will be issued to fund AI data centers next year. Additionally, Barclays believes that AI-related tech debt issuance is a key determinant of potential credit market supply in 2026. Meanwhile, the Street is already concerned there is not enough revenue or profits to show for the capital already allocated, let alone the increase in capital we will see beyond 2026 plus the increasing costs of debt. 

Cash Leaders and Laggards 

Subscribe for Free Below  to find out:   

  • Which Big Tech stocks have stronger cash flows and balance sheets able to support high capex. 
  • Promising AI stocks that are weighed down by negative free cash flows owing to high capex. 
  • One major AI player and large cap stock with a rising debt problem. 

Companies like Microsoft and Alphabet have a broad-based revenue stream, a strong balance sheet, and stable cash flows to support long-term capex growth. Microsoft has cash and short-term investments of $102 billion and debt of $43.2 billion, with a net cash position of $58.8 billion. The company reported strong operating cash flows of $45.1 billion and free cash flows of $25.6 billion in the recent quarter. It has a low capex as a percentage of operating cash flow of 43%, as shown in the chart below.  

Similarly, Alphabet has a stable balance sheet of cash and marketable securities of $98.5 billion and debt of $21.6 billion. The company also reported strong operating cash flows of $48.4 billion and a free cash flow of $24.5 billion in the last quarter. The company also has a low capex as a percentage of operating cash flow of 49%, which suggests that the company can easily support capex with the operating cash flows.  

Meta has a stable cash flow and balance sheet. However, the company is on the threshold as it has a higher capex to operating cash flow percentages compared to Microsoft and Alphabet. It also entered a complex financing structure with Blue Owl Capital that would help to keep debt off its balance sheet but might not eliminate the concern of using debt to fund AI buildout.  

Meta had cash and marketable securities of $44.45 billion compared to debt of $28.8 billion at the end of Q3 2025. The company reported operating cash flow of $30 billion and free cash flow of $10.6 billion after deducting $19.4 billion of capex. Meta recently used hybrid debt by entering a $27 billion joint venture with Blue Owl Capital to fund its development of Hyperion Data Center. The complex financing structure will help the company keep debt off its own balance sheet. 

Note: To ensure an accurate comparison our 43% and 63% calculation for Microsoft and Meta excludes financial leases, which management includes while discussing capex. 

Source: Company IR 

On the other hand, a surge in the credit default swaps (a form of insurance against default for bondholders) of Oracle indicates that investors are worried about its debt levels. Oracle has $10.5 billion in cash and a high debt of $91.3 billion at the end of the August quarter. The company raised an additional $18 billion following its results. The company reported operating cash flows of $8.1 billion in the recent quarter. However, due to the high capex of $8.5 billion, the company reported a negative free cash flow of ($362 million). The company has a high capex to operating cash flow percentage of 104%. 

CoreWeave is a leading AI infrastructure stock. However, high capex is leading to negative free cash flows. The company has cash of $2.5 billion and a high debt of $14 billion at the end of Q3 2025, with a net debt position of $11.5 billion. The debt has increased from $8.7 billion in Q1 to $11.1 billion in Q2 and further increased $3.0 billion in the recent quarter. 

Similarly, Nebius has an extreme high capex to operating cash flow percentage of 1185%. The company reported an operating cash flow of ($80.6 million) and a free cash flow of ($1.04 billion) owing to high capex of ($0.96 billion) primarily driven by purchases of GPUs and GPU-related hardware, and the data center expansion activities.  

Conclusion 

For years, the I/O Fund has been a pioneer in identifying winners by recognizing the positive correlation between AI stocks and the increase in Big Tech Capex. While many are busy debating whether Big Tech’s AI spending will translate to revenue and profits, and more recently concerned about the useful life of servers. Meanwhile, during those years, the I/O Fund has been laser focused on where that AI capital is actually being allocated. Rather than thinking of our approach as the picks and shovels for those chasing a gold rush, we think of it as an “AI stack” strategy—investing in the lesser-known layers and components that are driving forward an ecosystem capable of massive GDP. 

Join us this Thursday for a one-hour webinar, where we’ll outline our buy and sell strategies on under-the-radar AI stocks and discuss how we’re positioning in a market where some valuations look stretched while others still have room to run. Learn more here 

Damien Robbins and Royston Roche, Equity Analysts at I/O Fund contributed to this analysis 

Please note: The I/O Fund conducts research and draws conclusions for the Fund’s positions. We then share that information with our readers. This is not a guarantee of a stock’s performance. Please consult your personal financial advisor before buying any stock in the companies mentioned in this analysis.

Recommended Reading:

  • CoreWeave Stock Soars 200% Since IPO — Can It Defy the Odds?CoreWeave Stock Soars 200% Since IPO — Can It Defy the Odds?
  • Updated Nvidia Stock Price Target – AI “Bubble” Narrative Ignores Re-Acceleration in Big Tech CapexUpdated Nvidia Stock Price Target – AI “Bubble” Narrative Ignores Re-Acceleration in Big Tech Capex
  • Palantir Stock Forecast 2025: Can PLTR Justify Its High Valuation?Palantir Stock Forecast 2025: Can PLTR Justify Its High Valuation?

  • Meta Stock Emerges as a Strong Mag 7 AI LeaderMeta Stock Emerges as a Strong Mag 7 AI Leader
Posted in Ai Platforms, AI Stocks, AI StocksLeave a Comment on Big Tech’s $405B Bet: Why AI Stocks Are Set Up for a Strong 2026 

Innodata on Pause until 2026 Story Develops Further 

Posted on November 7, 2025June 30, 2026 by io-fund

Innodata’s AI segment slowed from 99% YoY growth last quarter to 22.6% YoY growth this quarter, although on a QoQ basis there was some improvement with 8.3% growth compared to essentially flat last quarter.  

However, the company is twiddling its thumbs (so to speak) until the next deal is announced. With nothing concrete to add this quarter, there was instead vague talk around their biggest customer expanding “based on verbal confirmation.” Management does believe 2026 will be stronger with $26 million in pre-training data wins expected to be signed “very soon” and “new partnerships emerging with key AI and sovereign AI players, which we expect to be announcing in 2026.” 

According to management, there are eight potential customers with five expected to contribute meaningfully in 2026. In terms of how much revenue they can contribute, the following was shared: “Three of these new five, we believe, are positioned to allocate up to hundreds of millions of dollars annually to generative AI data and evaluation, and we believe we’re well-positioned to capture a share of that spend. It is worth noting that two of these are global leaders in commerce, cloud, and AI.” 

Overall, it’s difficult to sit in the waiting room on any AI stock right now. With a name like Innodata, we prefer to remain balanced and to wait for more tangible evidence that new deals are materializing. Opportunity cost comes to mind when there are other AI names already showing clear acceleration in deal flow and revenue contribution today. 

Q3 Revenue Beat by 4.6% 

Revenue grew by 19.8% YoY to a record $62.6 million, beating estimates by 4.6%. Revenue growth decelerated from 79.4% in Q2, which was expected. It grew by 7.1% sequentially and was better than flat in the previous quarter. 

Management reiterated the annual guidance of 45% or more growth for the full year. They stated: “We reiterate guidance we provided last quarter of 45% or more year-over-year organic revenue growth in 2025, and we anticipate continued transformative growth in 2026 based on new wins and strong momentum.” 

Looking ahead, analysts expect revenue to grow 22.8% YoY to $303.8 million in 2026 and 3% growth to $313 million in 2027. These estimates could be revised higher based on the new deals in the pipeline.  

Innodata Federal Business Unit Launched 

The company also announced the launch of Innodata Federal, a dedicated government-focused business unit designed to deliver mission-critical AI solutions to U.S. defense, intelligence, and civilian agencies. Management expects this business unit to be a material revenue generator for the company in 2026 and beyond. The business unit has won an initial project with a new high-profile customer. They anticipate that the initial project will generate approximately $25 million in revenue, primarily in 2026. 

The company has additional projects under discussion with the customer, and they anticipate that these projects will be substantial. Management expects to issue a press release regarding the relationship prior to the end of the year. These projects are expected to be a potential game-changer for the next phase of growth. The new partnership is strategically significant, representing a material top-line opportunity. 

AI Segment grew by 23% 

Innodata’s Digital Data Solutions (DDS) segment grew by 22.6% YoY to $54.8 million. This AI segment slowed from 99% YoY growth last quarter, although on a QoQ basis, there was some improvement with 8.3% growth compared to essentially flat last quarter. Also, it had tough comps as the company reported a strong YoY growth of 179% in the same period last year. 

Management was also optimistic about the enterprise AI opportunity and mentioned that it was also gaining traction and holds promise for 2026. Innodata provides full-stack support to help enterprises integrate generative AI into products and operations. 

  • Synodex segment revenue was down (14.6%) YoY to $1.65 million compared to a 4% growth in the previous quarter. 
  • Agility segment revenue grew by 9.3% YoY to $6.1 million compared to an 11.5% growth in the previous quarter but was up 6.4% sequentially. 

Margins  

The company’s gross profits grew by 19.6% YoY to $25.5 million with a margin of 40.8%, which was flat YoY and up 80 basis points sequentially. The adjusted gross margin improved by 40 basis points YoY and 130 basis points sequentially to 44.2%. 

Operating income was up 3% YoY to $11.8 million. Operating margin was 18.8%, down 310 basis points YoY, but was up 350 basis points sequentially. The operating expenses increased by 38.7% YoY to $13.7 million, primarily due to new hires. Management expects operating expenses to increase to support strong expected growth. 

Net income was $8.3 million compared to $17.4 million a year ago. The decrease was primarily due to the tax benefit arising from the utilization of net operating loss carry forward in the same period last year.  

Adjusted EBITDA grew by 16.9% YoY to $16.2 million with an adjusted EBITDA margin of 25.9%, down 60 basis points YoY and up 320 basis points sequentially. 

  • The DDS segment adjusted EBITDA margin was 27.8%, up 70 basis points YoY. 
  • Synodex segment adjusted EBITDA margin was 8.2%, down 19.2 percentage points YoY. 
  • Agility segment adjusted EBITDA margin was 14%, down 8.1 percentage points YoY. 

EPS beat by 75% 

The company’s GAAP EPS came at $0.24, beating the analyst’s estimates by 75.2%. Analysts expect GAAP EPS of $0.21 and $0.24 in the next two quarters. 

Looking forward, analysts expect GAAP EPS to grow 40.8% YoY to $1.07 in 2026 and 21.5% YoY to $1.30 in 2027. 

Cash Flow and Balance Sheet 

The company has a healthy balance sheet. 

  • Q3 operating cash flow was $18.77 million or 30% of revenue compared to $11.37 million or 21.8% of revenue in the same period last year. The company also benefited from an $8.0 million cash payment received in the recent quarter, which would have otherwise been received by the end of Q2. 
  • Q3 free cash flow was $14.5 million or 23.2% of revenue compared to $9.92 million or 19% of revenue in the same period last year. 
  • The company’s cash was $73.86 million at the end of the quarter, up from $59.8 million at the end of the previous quarter. The company has no debt. 

Conclusion: 

As stated above, it’s difficult to sit in the waiting room on any AI stock right now. With a name like Innodata, we prefer to remain balanced and to wait for more tangible evidence that new deals are materializing. Opportunity cost comes to mind when there are other AI names already showing clear acceleration in deal flow and revenue contribution today. 

I/O Fund Equity Analyst Royston Roche contributed to this analysis. 

Please note: The I/O Fund conducts research and draws conclusions for the company’s portfolio. We then share that information with our readers and offer real-time trade notifications. This is not a guarantee of a stock’s performance and it is not financial advice. Please consult your personal financial advisor before buying any stock in the companies mentioned in this analysis. Beth Kindig and the I/O Fund own shares in INOD at the time of writing.

Recommended Readings:

  • Reddit Q3: Setting a High Bar with Top Line Strength and 10-point Sequential Margin Expansion
  • IREN Raises Cloud ARR to $3.4B for 2026, Yet Financing and Execution Remain
Posted in Ai Platforms, AI StocksLeave a Comment on Innodata on Pause until 2026 Story Develops Further 

Posts navigation

Older posts
Newer posts

Recent Posts

  • The IPO Glut of 2020: Why Valuations Have Gone Too Far
  • Zoom Discusses Two Important Catalysts In Q1 Earnings
  • Three Risk Management Tools the I/O Fund Offers
  • Micron Is Up 900%. Here’s Why the AI Memory Trade May Still Have Room to Run
  • Credo: Reliability Leader Aggressively Moves into Optics

Recent Comments

No comments to show.

Archives

  • June 2026
  • May 2026
  • April 2026
  • March 2026
  • February 2026
  • January 2026
  • December 2025
  • November 2025
  • October 2025
  • September 2025
  • August 2025
  • July 2025
  • June 2025
  • May 2025
  • April 2025
  • March 2025
  • February 2025
  • January 2025
  • December 2024
  • November 2024
  • October 2024
  • September 2024
  • August 2024
  • July 2024
  • June 2024
  • May 2024
  • April 2024
  • March 2024
  • February 2024
  • January 2024
  • December 2023
  • November 2023
  • October 2023
  • September 2023
  • August 2023
  • July 2023
  • June 2023
  • May 2023
  • April 2023
  • March 2023
  • February 2023
  • January 2023
  • December 2022
  • November 2022
  • October 2022
  • September 2022
  • August 2022
  • July 2022
  • June 2022
  • May 2022
  • April 2022
  • March 2022
  • February 2022
  • January 2022
  • December 2021
  • November 2021
  • October 2021
  • September 2021
  • August 2021
  • July 2021
  • June 2021
  • May 2021
  • April 2021
  • March 2021
  • February 2021
  • January 2021
  • December 2020
  • November 2020
  • October 2020
  • September 2020
  • August 2020
  • July 2020
  • June 2020
  • May 2020
  • April 2020
  • March 2020
  • February 2020
  • January 2020
  • December 2019
  • November 2019
  • October 2019
  • September 2019
  • August 2019
  • July 2019
  • June 2019
  • May 2019
  • April 2019
  • March 2019
  • February 2019
  • January 2019
  • December 2018
  • November 2018
  • October 2018
  • September 2018
  • August 2018
  • July 2018
  • June 2018
  • May 2018
  • April 2018
  • February 2018
  • January 2018

Categories

  • 5G
  • About
  • Accounting Tips
  • AdTech
  • Ai Platforms
  • Ai Platforms
  • Ai Platforms
  • Ai Platforms
  • Ai Platforms
  • Ai Platforms
  • Ai Platforms
  • Ai Platforms
  • Ai Platforms
  • Ai Platforms
  • Ai Platforms
  • Ai Platforms
  • Ai Platforms
  • Ai Platforms
  • Ai Platforms
  • Ai Platforms
  • AI Stocks
  • AI Stocks
  • Analysts
  • Application Monitoring
  • Application Monitoring
  • Applications
  • Applications
  • Applications
  • Applications
  • Applications
  • Applications
  • Applications
  • AR
  • Audit Reports
  • Autonomous Vehicles
  • Autonomous Vehicles
  • Autonomous Vehicles
  • Autonomous Vehicles
  • Autonomous Vehicles
  • Autonomous Vehicles
  • Autonomous Vehicles
  • Avod
  • Avod
  • Battery Charging
  • Bear Market
  • Bitcoin
  • Bitcoin
  • Bitcoin
  • Bitcoin
  • Bitcoin
  • Bitcoin
  • Bitcoin
  • Blockchain
  • Blockchain
  • Blockchain
  • Blockchain
  • Blockchain
  • Blockchain
  • Blockchain
  • Broad Market Today
  • Bull Market
  • Bull Market
  • Chainlink
  • Chainlink
  • Chainlink
  • Chainlink
  • China Stocks
  • Cloud
  • Cloud Infrastructure
  • Cloud Infrastructure
  • Cloud Infrastructure
  • Cloud Infrastructure
  • Cloud Infrastructure
  • Cloud Infrastructure
  • Cloud Infrastructure
  • Cloud Platforms
  • Cloud Platforms
  • Cloud Software
  • Cloud Software
  • Cloud Software
  • Cloud Software
  • Cloud Software
  • Cloud Software
  • Cloud Technology
  • Company
  • Company
  • Console Gaming
  • Console Gaming
  • Console Gaming
  • Consumer
  • Consumer
  • Consumer
  • Consumer
  • Consumer
  • Consumer
  • Consumer
  • Consumer
  • Consumer
  • Consumer
  • Consumer
  • Consumer
  • Consumer
  • Consumer
  • Consumer Tech
  • Corrections
  • Crypto Investment
  • Ctv
  • Ctv
  • Ctv
  • Ctv
  • Ctv
  • Ctv
  • Ctv
  • Ctv
  • Ctv
  • Ctv
  • Cybersecurity
  • Cybersecurity
  • Cybersecurity
  • Cybersecurity
  • Cybersecurity
  • Cybersecurity
  • Cybersecurity
  • Cybersecurity
  • Cybersecurity
  • Cybersecurity
  • Cybersecurity
  • Cybersecurity
  • Data
  • Data Analytics
  • Data Analytics
  • Data Analytics
  • Data Center
  • Data Center
  • Data Center
  • Data Center
  • Data Center
  • Data Center
  • Data Center
  • Data Center
  • Data Center
  • Data Center
  • Data Center
  • Data Center
  • Data Center
  • Data Center
  • Data Center
  • Data Center and Processing
  • Data Warehousing
  • Data Warehousing
  • Data Warehousing
  • Data Warehousing
  • Databases
  • Databases
  • Databases
  • Databases
  • Dating
  • Defi
  • Digital Ads
  • Digital Ads
  • Digital Ads
  • Digital Ads
  • Digital Ads
  • Digital Ads
  • Digital Ads
  • Digital Ads
  • Digital Ads
  • Digital Ads
  • Digital Ads
  • Digital Ads
  • Digital Ads
  • Digital Ads
  • E-Commerce
  • Earning Updates
  • Earning Updates
  • Earning Updates
  • Earning Updates
  • Earning Updates
  • Earnings Report
  • Earnings Report
  • Earnings Report
  • Earnings Report
  • Earnings Report
  • Earnings Report
  • Earnings Report
  • Earnings Report
  • ECommerce
  • Electric Vehicles
  • Electric Vehicles
  • Electric Vehicles
  • Electric Vehicles
  • Electric Vehicles
  • Electric Vehicles
  • Electric Vehicles
  • Energy Stocks
  • Enterprise
  • Enterprise
  • Enterprise
  • Enterprise
  • Enterprise
  • Enterprise
  • Enterprise
  • Enterprise
  • Enterprise
  • Ethereum
  • Events1
  • Events1
  • Exchange
  • Faq
  • Finance
  • Financial Analysis
  • Financial Analysis
  • Financial Analysis
  • Financial Analysis
  • Financial Analysis
  • Financial Analysis
  • Financial Analysis
  • Financial Analysis
  • Financial Analysis
  • Financial Analysis
  • Financial Analysis
  • Financial Analysis
  • Financial Markets
  • FinTech
  • Fundamental Analysis
  • Gambling
  • Gaming
  • Genomics
  • Glossary
  • Green Energy
  • Growth Stocks
  • Growth Stocks
  • Growth Stocks
  • Headsets
  • Headsets
  • Health Tech
  • Hydrogen
  • Identity
  • Identity
  • Identity
  • Inflation
  • Inflation
  • Inflation
  • Internet of Things
  • Interviews
  • Interviews
  • Interviews
  • Interviews
  • Investing
  • Investing
  • Ltbh
  • Ltbh
  • Ltbh
  • Ltbh
  • Ltbh
  • Macro Trends
  • Macro Trends
  • Market Trends
  • Market Trends
  • Market Trends
  • Market Trends
  • Market Trends
  • Market Trends
  • Market Trends
  • Market Updates
  • Market Updates
  • Market Updates
  • Market Updates
  • Market Updates
  • Market Updates
  • Market Updates
  • Market Updates
  • Market Updates
  • Market Updates
  • Media
  • Membership
  • Mining
  • Mobile
  • Mobile
  • Mobile
  • Mobile
  • Mobile Gaming
  • Mobile Gaming
  • Mobile Gaming
  • Multimedia
  • Music Streaming
  • NVDA | NVIDIA Corporation
  • Performance Updates
  • Pin Content
  • Podcasts
  • Podcasts
  • Podcasts
  • Portfolio
  • Premium Research
  • Press Releases
  • Press Releases
  • Productivity
  • Productivity
  • Productivity
  • Productivity
  • Productivity
  • Productivity
  • Productivity
  • Reports and Whitepapers
  • Research Services Preview
  • Resources
  • Resources
  • Semiconductor Stocks
  • Semiconductors
  • Semiconductors
  • Semiconductors
  • Semiconductors
  • Semiconductors
  • Semiconductors
  • Semiconductors
  • Semiconductors
  • Semiconductors
  • Semiconductors
  • Semiconductors
  • Semiconductors
  • Semiconductors
  • Social Media
  • Social Media
  • Social Media
  • Social Media
  • Social Media
  • Social Media
  • Social Media
  • Software
  • Software
  • Software
  • Software
  • Software
  • Software
  • Software
  • Software
  • Software
  • Software
  • Software
  • Software
  • Software
  • Software
  • Software
  • Solar
  • Solar
  • Stock Analysis PDFs
  • Stock Updates
  • Stock Updates (Blogs)
  • Supplychain
  • Supplychain
  • Supplychain
  • Supplychain
  • Supplychain
  • Supplychain
  • Svod
  • Svod
  • Svod
  • Svod
  • Svod
  • Svod
  • Tech Podcast
  • Tech Stock News
  • Tech Stock News
  • Tech Stock News
  • Tech Stock News
  • Tech Stock News
  • Tech Stocks
  • Tech Stocks
  • Tech Stocks
  • Tech Stocks
  • Tech Stocks
  • Tech Stocks
  • Tech Stocks
  • Tech Stocks
  • Tech Stocks
  • Tech Stocks
  • Tech Stocks
  • Tech Stocks
  • Tech Stocks
  • Tech Stocks
  • Technical Analysis
  • Telehealth
  • Telehealth
  • Telehealth
  • Telehealth
  • Testing Equipment
  • Testing Equipment
  • Top Tech Stock News
  • Travel
  • Trends Report
  • Tutorials
  • Uncategorized
  • Updates
  • Updates
  • Updates
  • Video
  • Video
  • Video
  • Video
  • Video Footage
  • VR
  • Webinar Alerts
  • Webinar Alerts
  • Webinars
Proudly powered by WordPress | Theme: iofund by iofund.co.uk.