Skip to content
Logo-main-white.860316a8

I/O Fund

  • Home
  • Free Stock Analysis
  • AI Stocks
  • BEST OF 2025
  • Analysts
  • Nvidia Hub
  • About
    • Case Studies
    • About Us
    • Premium Services
    • Pricing
    • Notable Wins
    • I/O Fund Reviews
    • Media
  • Contact Us

Category: Tech Stocks

Here’s Why Roku Stock Will Surpass $100 In Next Two Years

Posted on August 11, 2018June 30, 2026 by io-fund
Here’s Why Roku Stock Will Surpass $100 In Next Two Years

Roku’s stock (ROKU) is getting a lot of attention after it reported stellar second-quarter results due to 57% year-over-year revenue growth to $156.8 million beating the analyst forecast of $141 million. Compare this to 37% year-over-year revenue growth in Q1. However, as I stated in my Q1 article, the platform revenue is where Roku will continue to see a majority of the gains. The video streaming platform revenue was up 96% during the period to $90.3 million with player revenue up 24% to $66.5 million.

Some of the analysis below is taken from an article I wrote last quarter on Seeking Alpha. The information has not changed, but the stock price is beginning to adjust to Roku’s product-market fit. I do expect some correction from today’s stock pop, but these fundamentals are why I’ve been long on Roku from the beginning (and beating out Amazon Fire Stick isn’t one of them). I do expect Roku to experience some volatility on its path to becoming a large cap stock, however, specific industry trends are supporting Roku stock, and ultimately, these trends will win out.

1. Blood In The Water:

Roku offers the most synonymous business model with cable and satellite TV providers and can capitalize long-term on this massive subscriber loss by leveraging its advertising, audience development, and content distribution services, which make up 89% of gross margins from the platform. In fact, if Roku was a traditional cable company, this quarter’s 22 million active subscriber base would rival Comcast (CMCSA) for the place of second largest distributor of content in the United States. Only AT&T (NYSE:T) has more with 47 million DirecTV subscribers.++

The peak for pay TV in the United States occurred in 2010/2011 when it began a predictable erosion. The number of pay TV subscribers fell by 8,000 in 2012 and accelerated to 164,000 subscriber losses in 2014. Last year, the erosion neared deterioration with the top 10 pay TV operators losing a staggering 3 million linear subscribers in 2017 according to Leichtman Research.

2. Vendor Agnostic:

Roku critics cite too much competition for this mid-cap stock to carry the growth needed for long-term gains, especially from Apple (AAPL), Google (GOOG) (GOOGL) and Amazon (NASDAQ:AMZN) who all have a play in the hardware market for OTT video streaming services. However, this weakness is actually Roku’s strength. The Roku operating system, Roku OS 8, is a robust, reliable option for OTT streaming and has attracted partnerships with 1 in 5 smart TVs in the United States.

Meanwhile, operating systems like Samsung’s (OTC:SSNLF) Tizen continue to be plagued with bugs. But by being vendor-agnostic, Roku has still been able to secure a partnership for their free ad-supported channel with competing OSs like Samsung/Tizen. In addition, by remaining agnostic, Roku has maintained a full menu of original programming while corporate spats between Google (YouTube) and Amazon Prime restrict content choices.

Roku has also built a formidable catalog of 5,000 channels that even Google has not even come close to rival. This is where the discussion as to Roku being a hardware company should curtail as the “player” revenue has been eclipsed by the platform revenue (platform revenue stood at 45% in Q4 2017 compared to 57% in Q2 2018). It’s the latter where the company is making its largest investments including OTT advertising measurement tools, launching the free Roku channel, growing licensing fees, and partnering for live TV. The launch of live news in mid-May and the World Cup in June also contributed to platform performance in Q2.

3. There’s More To OTT Than Highly Fragmented Subscriptions:

Previously, viewing data and ratings on SVOD (subscription video on demand) such as Netflix (NFLX), Hulu Plus, and Amazon Prime and other OTT content was not disclosed even by Nielsen (NLSN). However, in a recent interview, Nielsen COO Steve Hasker revealed four previously undisclosed statistics about SVOD such as 89.5% of SVOD content is primarily viewed on the television glass whereas 11.5% is viewed on smartphones and tablets.

Of this time, 80% is spent on catalog programming whereas 20% is spent on original content. Meanwhile, as competition increases, the costs for original programming are escalating with Netflix spending $8 billion in 2018 in order to remain competitive for a small piece of the pie (20% of how time is spent). Meanwhile, Roku has held firm on not creating original programming and the statistics support this. The costs for original programming are likely to escalate as HBO, Showtime, and now Apple will continue to compete for this space.

In addition, subscribers pay for quite a few premium $8+ subscription channels, which will eventually lead to subscription fatigue – not to mention mitigate the reason cord-cutters leave pay TV services – which is to lower costs. For a subscriber with YouTube TV ($40) and three premium channels ($24-26), they are paying $65+ per month. This pricing will meet resistance by cord cutters and ad-supported video on demand (AVOD) will be the answer.

Most importantly, original programming will consolidate or bundle (like it has on cable) and Roku is the perfect middleman to do this.

My newsletter subscribers get this information first. Sign up here.My newsletter subscribers get this information first. Sign up here.here.

4. Global Potential:

This point ties into the previous two points where agnosticism in hardware and operating system along with building out a free, ad-supported channel will help Roku crush global expansion – especially in the emerging markets. The low price point for both the hardware and free content is desirable for global adoption, plus the 5,000 channels that Roku offers caters to differences in cultural viewing preferences. Most recently, Roku has announced offering the Roku Channel on the web in the United States which will serve people who do not have a set top box or television. Don’t be surprised if their next move is to take this web channel global. For instance, while India has roughly 180 million television sets, the country has nearly 300 million smartphones which a global Roku Channel could potentially reach.

Bottom line is that Roku has shown competitive vigor by maintaining the lead as the top streaming media player in the United States claiming 37% of devices with nearly 40 million U.S. customers use Roku once per month. It’s only a matter of time until they take this success to the billions of people overseas who can’t afford pay TV or want to reduce pay TV costs.

5. Purely OTT Play:

In reference to the first point, there is an opportunity to capitalize due to massive pay TV subscriber losses such as last month when Charter (CHTR) lost 12% of market cap after reporting 112,000 subscriber losses and Comcast reported a loss of 98,000 in video users compared to a gain of 41,000 one year ago in Q1 2017.

This bloodbath from attrition will continue to accelerate through 2025 when even TV networks are expected to experience a 41% revenue loss. Roku is a very desirable purely OTT mid-cap choice with 22 million users and a $5.75 billion market cap that narrows in on this staggering market trend. Compare this to Charter Communications, which has a $69 billion market cap and only 16 million users.

Conclusion:

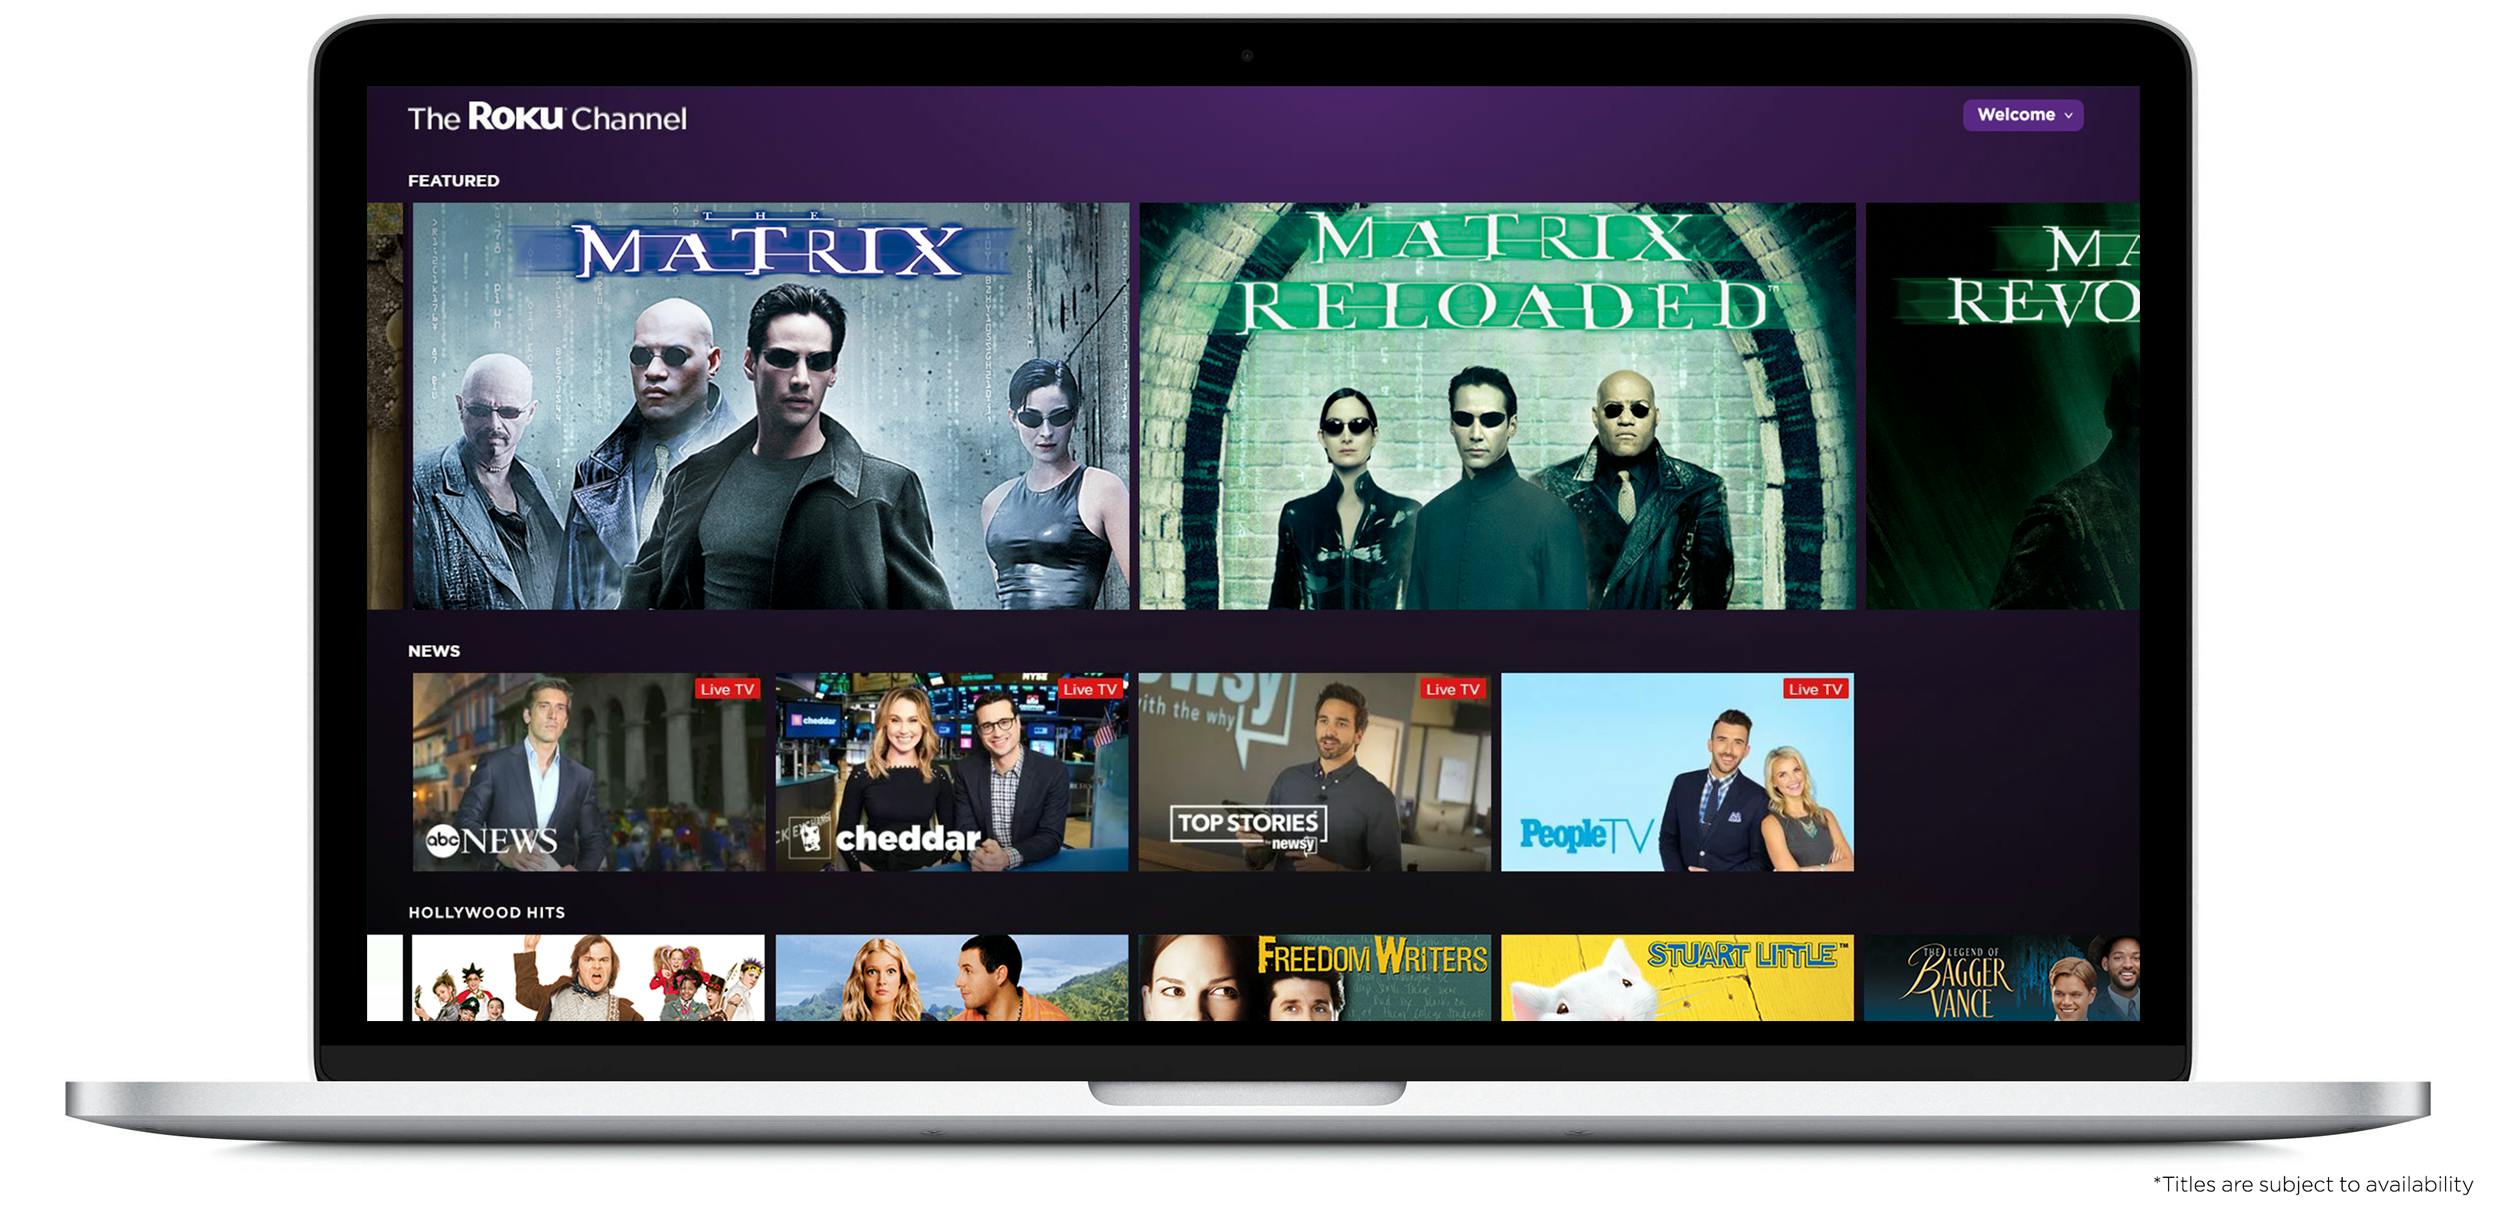
In the next 2-5 years, Roku stock will outpace competitors globally as it continues to be the cheapest, agnostic option with the most channels. Its executive team is experienced in OTT media and advertising, and the platform revenue will redefine how investors see this razor/razor blade opportunity (device player that locks in licensing fees and advertising). The free channel especially is attractive setting it apart from the overabundance of paid, subscription channels. In addition, live TV will be an attractive space for Roku with the company already recently partnered with ABC News, People TV, and Cheddar.

 Any information or analysis contained herein and published or referenced elsewhere should be appropriately credited to Beth Kindig of beth.technologybeth.technology

This article appeared on Seeking Alpha.

Posted in Ctv, Media, Svod, Tech StocksLeave a Comment on Here’s Why Roku Stock Will Surpass $100 In Next Two Years

I Predicted Facebook Would Miss Q2 Earnings: Here’s What Investors Need To Know For Q3

Posted on July 27, 2018June 30, 2026 by io-fund
I Predicted Facebook Would Miss Q2 Earnings: Here’s What Investors Need To Know For Q3

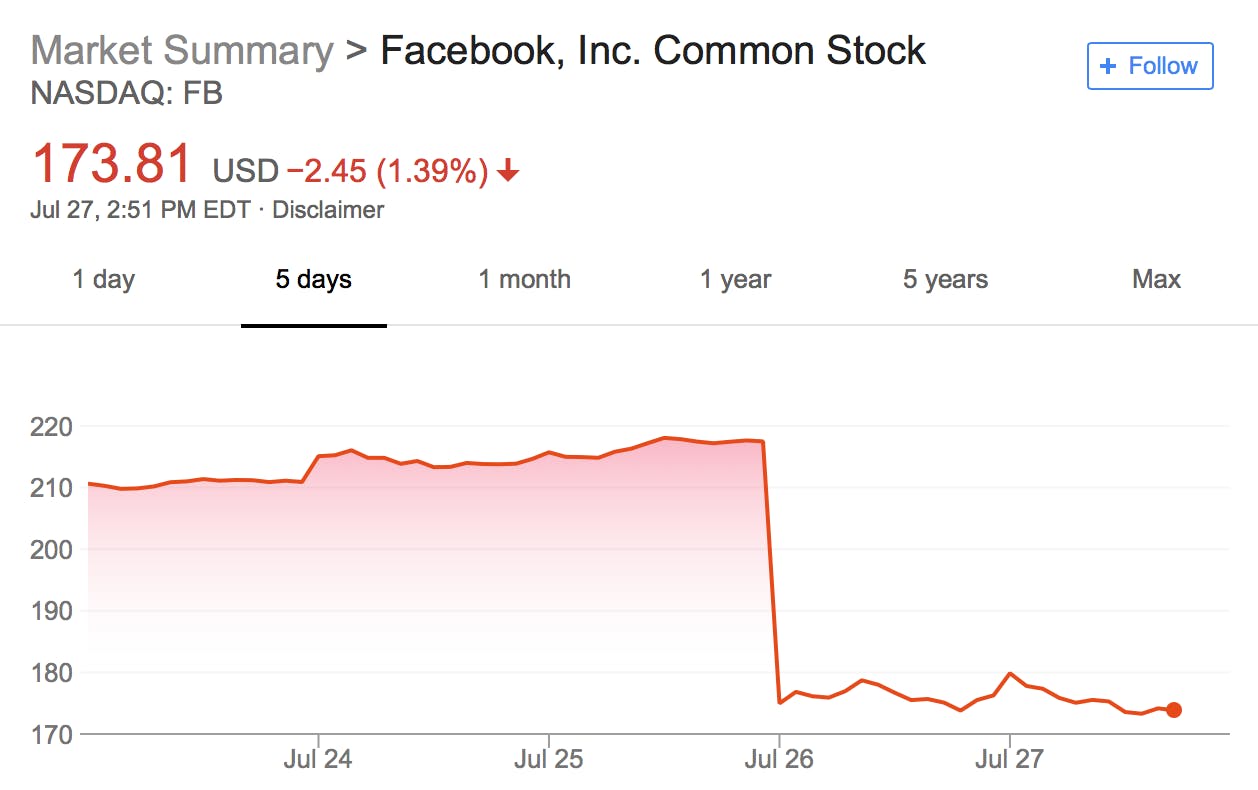
This is a crucial time to point out to investors that my predictions were correct. Last April, I published an in-depth analysis on Seeking Alpha along with predictions for Facebook (FB) stock. The analysis urged readers to ignore post-Cambridge Analytica hype as Facebook’s quarterly earnings would miss as a result of GDPR. Specifically, I stated the culprit would be revenue and data sources outside of the Facebook “family of apps.” However, with this article, I’d like to explore this point even further and explain with granularity why the issues have only begun and what Facebook isn’t telling you (source for Facebook earnings report: NASDAQ).

Tech companies are complex, especially as it relates to data science, and it’s unlikely a financial analyst or hedge fund whose expertise is in finance understands what exactly Facebook does with data and how this impacts average revenue per user (ARPU) or future earnings.

There’s more to Facebook than a “family of apps” which is causing confusion in the markets.

Have you heard of Audience Network? As an investor, it’s essential that you know what this is. Facebook makes money off third-party websites and applications through a platform called Audience Network. This is an advertising network, which powers advertisements to 40% of the top 500 applications. This is indicative of Audience Network’s overall presence in the mobile app market of approximately 40%. While it is well known in the mobile industry as the most dominant ad network in the mobile market, don’t be surprised if you’ve never heard of it.

Facebook Inc. doesn’t like to talk about Audience Network. You’ll be hard pressed to find any mention of it in their SEC filings or on earnings calls. Even among advertisers, who pay billions of dollars into Audience Network, the ad platform is notorious for its lack of transparency and is known to be a black box.

And, it’s a very profitable black box. The last time Facebook reported Audience Network numbers, it served advertisements to over 1 billion people per month at the end of 2016. That’s more than Instagram today, and this incredible base should be more like 2 billion in 2018 assuming it followed the same trajectory of adding 1 billion users every 2 years (Audience Network was launched in 2014).

With Audience Network, advertisers see 16% more reach on average globally than on Facebook and Instagram alone, and a 12% increase in website conversions with Facebook and Audience Network combined.

What could possibly have more reach than Facebook or Instagram?possibly have more reach than Facebook or Instagram?

Whoa – higher reach than Facebook and Instagram? And higher conversions? And all of this to over 1 billion people outside of Facebook’s “family of apps”?

Why is Audience Network so widely used in the mobile industry? Because it’s augmented with proprietary data from Facebook’s social apps. In order to power ads across hundreds and thousands (maybe even millions) of applications at a higher conversion than the world’s best advertising platforms (Facebook and Instagram) would require using data in ways that you would never want your users to find out about.

My newsletter subscribers get this information first. Sign up here.My newsletter subscribers get this information first. Sign up here.here.

I mean, what Facebook user would want their private information brokered to hundreds of applications to power advertisements in websites and applications that they didn’t authorize or have relationships with? From the backlash we saw after Cambridge Analytica, I’m guessing not many would like this.

Let me stop because this is where a lot of confusion begins. I’ll give you an example as to how this works. Let’s say you buy items from the retailer Target (NYSE: TGT) every week. Maybe you buy toilet paper, dish soap and laundry soap. How would you feel if Target used that data in a partnership with Hulu or NBC or CBS to show you advertisements later on your television? That evening, Hulu or NBC or CBS would start to show you toilet paper ads and laundry soap ads based specifically off your private purchases and information shared at the cash register.

Target would make a lot of money if they brokered your private cash register data – but they don’t. Apple (NASDAQ:AAPL) has been very upfront about the billions of dollars they have opted to not make by keeping data private. This is what Tim Cook is referring to. Investors should know that it’s very, very rare for a company to risk the customer relationship in this way.

Meanwhile, Facebook is doing this across hundreds and thousands of applications using private data shared in what should be a privileged customer relationship. Not only that, but Facebook takes your private data from application partners (in this fake example, that would be Hulu, NBC or CBS) – so now they know what you were watching that night – but you never gave consent for any of this.

Data collected from the Audience Network software development kit (SDK) installed in iOS and Android applications continues to enrich Facebook proprietary data sets and drive up cost per impressions on advertising and average revenue per user. This business model of being a “data-broker-and-ad-network-without-consent-and-for-profit-beyond-social-media” is where some of the fallout from Cambridge Analytica began to occur. But this is miniscule compared to the data exchange (dare I say, data leakage?) through Audience Network.

Ethics aside, what investors need to know about Audience Network is that it violates some important regulations put into place by the GDPR as data is being used by both partners in ways that are explicitly without consent (Facebook users have NO IDEA how their private data is being used beyond the “family of apps.” On that note, investors don’t either because all Facebook ever talks about on earnings calls is the “family of apps” – never referring to Audience Network by its name).

The applications who share data with Facebook are at risk and Facebook who brokers proprietary data with partner applications are at risk if they continue this practice. In 2020, these regulations will also go into effect in the State of California. Facebook will have to slowly wean Audience Network out of existence or face major fines. As this weaning takes place, the revenue earned from 40% of the top 500 apps (plus more) will slowly dwindle.

How Much Are We Talkin’?

Quite a few people have asked me to estimate the value of Audience Network. I want to be clear that Facebook has provided very little information here. While the exact number of how much Audience Network is impossible to predict with pinpoint accuracy (insert: lol) the important thing to understand here is that the average revenue per user will drop on Facebook social because they will no longer store data and use that data from partner applications.

One reason there is limited information is that Facebook runs Audience Network ads through their Newsfeed feature, and therefore, uses this loop hole to count the revenue as Facebook revenue. This is very misleading to not provide transparency. Compare this to Alphabet which clearly discloses third-party websites and application revenue as a separate line item in their SEC Filing of roughly $17 billion per year.

Here’s one of the only statements issued by Facebook on Audience Network’s reach:

“We talk about reaching a billion people every month, and these are real people,” said Brian Boland, VP of publisher solutions at Facebook. “We’re not talking about cookies or browsers or devices or ID, where one person can look like six things. We’re talking about legitimately 1 billion people that can be reached on the audience network[2][2].”-Q4 2016

This means Audience Network is larger than Instagram today (Instagram has 800 million users). This also means Audience Network was 2 times larger than Whatsapp at the time of acquisition when Whatsapp had 484 million users – enough to claim the largest acquisition price tag in history of $19 billion.

This is how I estimated the net value at $5 billion minimum up to excess of $10 billion net to Facebook (after 70% revenue share with publishers).

  • Audience Network serves approximately 40% of the mobile apps on the market today which means Facebook likely monetizes every person with a smartphone (i.e. over 3 billion people rather than the 2.2 billion on Facebook social apps). Plus, they monetize this 3 billion many times over across unlimited inventory.
  • Google monetizes 2 million websites and 650,000 apps for $17 billion in third-party network revenue. Facebook Audience Network has a larger reach on mobile than Google’s ad network and the SDK could be in up to 2 million iOS and Android applications (figuring 40% of applications).
  • Facebook warned of ad load issues due to limited real estate in social network apps in earnings calls in 2016, however the exact opposite happened. Revenue skyrocketed and Facebook doubled the number of advertisers from 3 million to 6 million. This growth would have been supported by Audience Network as the ad network would eliminate ad load issues. Facebook added $23 billion in annual revenue since warnings of ad load. A large portion of this would have been supported by Audience Network alleviating ad load.

Most importantly, Facebook does not have to net anything off Audience Network in order to increase average revenue per user on its own social media apps. Growth in the United States and Canada flatlined a long time ago, meanwhile the ARPU (average revenue per user) skyrocketed. Data extracted from Audience Network would have substantially contributed to this ARPU growth. This is essential for investors to understand.This is essential for investors to understand.


Therefore, any ARPU made after the warning of ad load issues in 2016 and 2017 are questionable as the enriched data and targeting capabilities from Audience Network likely contributed to this ARPU growth.

Images from Shift Communications can be found here 

Additional Considerations for Facebook’s Q3 Earnings:

  1. User attrition and slowing user growth has been occurring for some time in the United States and Canada, yet earnings previously remained strong with ARPU climbing to $26 per user in these coveted markets. Therefore, a small user attrition of 1 million European Users from a base of 2.2 billion monthly active users is not why we are seeing the first revenue miss with Facebook executives warning of more decline to come. To believe the stock dropped because of infinitesimal decimal point user attrition is a dangerous theory propagated on earnings calls because your next thought will be whatever revenue lost from the Facebook user base could easily be made up by Instagram or one of the other “family of apps.” If you believe this storyline, then you will continue to hold onto this stock without having all of the information.
  2. The other Facebook domain properties such as Instagram, Whatsapp, and Oculus should be ignored for now. Yes, Instagram has potential but this is not what you are investing in when you buy Facebook stock. It is sheer speculation and if Instagram was a standalone company, you wouldn’t be paying these stock prices. You bought Facebook, Inc and to hype up Instagram as the central business model in 2018 is senseless.
  3. First-party data uploaded to Facebook by advertisers has weakened. The GDPR has a trickle-down effect by weakening the data advertisers upload to the Facebook newsfeed. This reduces the targeting power and the CPMs they can charge. I made this point in my Seeking Alpha article that “many brands will undergo the same regulations as to how they obtained their data.” In addition, Facebook is shutting down the self-serve tool that allows advertisers to import data from third-parties. This will also continue to erode earnings.

Conclusion:

Investors cannot expect transparency from Facebook executives. This company has better trained actors than Hollywood (sorry, but true). There are many instances in prior earnings calls where they purposely covered up revenue sources, such as Audience Network, in order to keep Wall Street confidence high leading up to these quarterly earnings (I’m working on a follow up article citing these specific omissions). They played down the impact of the GDPR and have omitted third-party mobile applications and websites revenue from SEC Filings. It is nearly impossible to evaluate the stock with what little information has been provided by Facebook, Inc.

But remember, this is a company that has misled the general public, Congress, and most importantly their users on important facts about their business model and revenue streams – especially that they use the data from Facebook across a huge network of applications and websites without authorization from their users. Quite simply, investors have been caught in the cross fire of Facebook’s attempts to cover up privacy issues with their users.

While the drop yesterday was “startling” for investors caught unaware, my readers on Seeking Alpha and beth.technology were fully informed with insider knowledge as to the underlying forces which are at play with Facebook, Inc and mobile advertising. You can subscribe to my newsletter here.

Any information or analysis contained herein and published or referenced elsewhere should be appropriately credited to Beth Kindig of beth.technologybeth.technology

This article appeared on Seeking Alpha.

Posted in Social Media, Tech Stocks, Tech StocksLeave a Comment on I Predicted Facebook Would Miss Q2 Earnings: Here’s What Investors Need To Know For Q3

The Good, the Bad and the Ugly About Google’s $5 Billion Antitrust Fine

Posted on July 20, 2018June 30, 2026 by io-fund
The Good, the Bad and the Ugly About Google’s $5 Billion Antitrust Fine

To summarize, the $5 Billion Antitrust Fine on Google is due to the following issues:

  • Google has required manufacturers to pre-install the Google Search app and browser app (Chrome), as a condition for licensing Google’s app store (the Play Store);
  • Google made payments to certain large manufacturers and mobile network operators on condition that they exclusively pre-installed the Google Search app on their devices; and
  • Google has prevented manufacturers wishing to pre-install Google apps from selling even a single smart mobile device running on alternative versions of Android that were not approved by Google (so-called “Android forks”)  source: European Commission

New gadgets and the promise of AI have helped to successfully rebrand Google’s search and advertising business, however, it’s important to remember that Alphabet is still an old-fashioned advertising company with nearly 90% of Q1 2018 revenue, or $26.6 billion, coming from advertising and only 15%, or $4.6 billion, coming from these other ambitions.

Therefore, understanding the nuances of advertising especially as it relates to data collection is going to be key for Alphabet investors. Unfortunately, top-rated analysts struggle to understand Alphabet’s business model and CEO Sundar Pichai did not offer any answers. In the Q1 2018 earnings call, Mark Mahaney of RBC Capital Markets asked if the “GDPR or other regulation is likely to impact materially the targeting capabilities that advertisers have on Google?” The CEO replied:

“You know, above everything else as we are working through GDPR we are making sure we are focused on getting that user experience right for our users and our partners. But to clarify your question further, you know, first of all, it’s important to understand that most of our ad business is Search, where we rely on very limited information, essentially what is in the keywords to show a relevant ad or product.”

This answer was over-simplified at best. Yes, Search is a large driver of revenue but what are the other portions of the advertising machine which will be affected? And how much revenue do the higher risk methods currently contribute to earnings?

Data & the $5 Billion Antitrust Fine: The Good, The Bad and The Ugly


The Good: Search Doesn’t Need Data; Gmail, Chrome and Google Maps Have User Consent

Quite a few of Google’s data-driven applications and services such as Gmail, Chrome and Google Maps can easily obtain user permission in exchange for the services these applications and browser provides. In addition, Google AdWords, which is based off search intent, will provide a safe haven for Google’s advertising revenue as this does not require the company to harvest private data. However, even search is not immune as it’s been enriched with data such as location to enhance search results.

The Bad: Android OS Collects Surveillance-Level Data without User Consent through pre-installed applications

While pre-installed applications help cement Google’s search dominance, there is much more going on behind the motivation for risking antitrust violations. It’s hard to know where to start when looking at Google’s sprawl of potential data regulation and antitrust issues. We could start with the fact they have a deal with data brokers that gives them access to 70% of our purchases made with credit cards and debit cards (without consent). The company is literally in your bank account. This is for the purpose of letting advertisers know if you completed a sale following an ad seen on one of Google’s properties. Another place to start is implicit data for advertising purposes, which uses your search history to target ads to you outside of Google search. This is why when you privately email your friend about a trip to Rome, you mysteriously get advertisements for flights to Rome on other websites. In one study of 850,000 internet users last year, mainly in the U.S. and Europe, Google tracked 64% of all pages loaded by mobile and web browsers.

While online tracking and conversion tracking are both invasive, the Android operating system is a surveillance-level behemoth with over 2 billion devices in circulation while littered with millions of applications leaking data to Alphabet’s advantage. Exponentially speaking, Android is impossible to contain. One study by the French research organization Exodus Privacy and Yale University’s Privacy Lab found that more than three in four Android apps contain a third-party tracker which extracts personal information, including location and in-app behavior. The apps the trackers were discovered includes Uber, Twitter, Spotify, and Tinder. The Privacy Lab found the in-app trackers revealed “an extensive data mining market buried within the mobile app ecosystem” enabling physical surveillance including through the use of WiFi, Bluetooth and ultrasonic sound inaudible to the human ear to track geolocations in real time.

Takeaway (from my article dated May 31st): Android will be the most likely source for fines by the European Union as it will be challenging to partition device IDs by geographies. Some have conjectured Alphabet will risk fines before voluntarily reducing their cyber intelligence. The fines are 1.6% of annual global revenue, or $4.4 billion for Google.

Update: Antitrust is a much better approach to breaking up the monopoly Google has on data collection.

My newsletter subscribers get this information first. Sign up here.My newsletter subscribers get this information first. Sign up here.here.

The Ugly: Walking the Razor’s Edge Between Data Violations and Non-Personalized Ads

Data collected from the Android OS augments and enriches data science modeling for Alphabet to monetize the data elsewhere. That “elsewhere” is Adsense, AdX and AdMob. Google’s AdSense and AdX Networks enable non-Google websites to incorporate Google display advertising, and this is what current publishers are in an uproar about.

To summarize, Alphabet is attempting to become a co-controller for data in some instances and a processor in other instances. It’s unknown how the European Union will view data leaks from publishers to Alphabet.

Source: Quora

The level of involvement Google has as either a co-controller or processor is important for investors to understand as these regulations continue to play out. This may be hard to imagine today, but if data collection returns to property-owned data collection only, then the premium price advertisers pay for Google ad inventory may diminish as Google will struggle to differentiate itself from other advertising options from a campaign ROI standpoint if or when it fails to get the proper consent to collect the data and broker the ads.


Source: Statista

The worst case scenario here is that Google has to display “non-personalized” ads where consent isn’t obtained — which Google is already prepared to do: “As previously announced, we’re also launching a Non-Personalized Ads solution (DFP/AdX, AdMob, AdSense) to enable publishers to present EEA users with a choice between personalized ads and non-personalized ads (or to choose to serve only non-personalized ads to users in the EEA).”

As mentioned above, this is where the premium price can potentially recede. By being forced to serve non-personalized ads, the competitive advantage Google has will diminish in this circumstance.

Bottom Line:

While Search is intact, there are many layers to data collection and ad targeting which will lower ROI campaign performance as the data Alphabet is allowed to collect continues to wane. In this article, we’ve discussed that the Android OS is leaky and the most likely part of Alphabet’s business to be fined. As far as revenue is concerned, non-personalized ads is the potential weakness especially on network sites as $17.59 billion was earned from network sites annually in 2017.

Posted in Digital Ads, Mobile, Tech StocksLeave a Comment on The Good, the Bad and the Ugly About Google’s $5 Billion Antitrust Fine

Measuring Mobile Ad Performance: Why We Need to Borrow a Metric from TV

Posted on June 13, 2018June 30, 2026 by io-fund
Measuring Mobile Ad Performance: Why We Need to Borrow a Metric from TV

This article originally appeared in VentureBeat.VentureBeat.

By all accounts, mobile advertising is the wave of the future. Mobile ad spend is projected to increase 430 percent between 2013 to 2016, when it’s expected to surpass $100 billion worldwide, according to eMarketer. By 2019, overall ad spend will go on to surge to an estimated $200 billion. This is record-breaking growth, and it’s no wonder we are seeing this level of investment considering we’ve seen mobile usage recently exceed desktop.

It’s exciting to be in mobile today. You couldn’t ask for more users, more eyeballs.

Yet  there are still a few unanswered issues. Those spending big dollars on mobile, namely advertisers, publishers driving installs, and also brands and agencies, have a few key indicators they want to meet, including a reasonable level of accuracy, optimization, reach, and of course, performance. The mission is to deliver the correct content at the right moment closely matched to the intention of the person viewing the ad.

But whether this happens or not is an absolute mystery on mobile today. We may know someone installed an app, but they may never open that app again. We can measure clicks, but this has led to fraud and has also prevented brands from feeling confident that a “click” is the result they want from a campaign.

To loosen the bottleneck, we need to look at the yardstick we are using. We need to measure accuracy. We need to measure optimization. We need to measure reach. And we need to measure performance. The common denominator across all KPIs is how to measure both the audience and the campaign performance.

There are three predominant methods for measuring mobile ad performance today and each has its limits.

CPI: Cost per Install. This measurement is unique to mobile and was initiated for mobile publishers who doubled as advertisers. These publishers needed installs on their mobile apps, therefore, user acquisition dictated a new form of campaign measurement. It’s also the easiest (and first) way of measuring effectiveness in mobile video, although it limits the number of advertisers to only those who want to drive app installs.

CPI is also a higher risk to the publisher because they only get paid when the install occurs. As a result, the user experience is often quite bad because the user sees the ad over and over again, with the ad exchange favoring whatever means necessary to procure the install.

Weaknesses: Not every advertiser wants to drive an app install. Plus, users are gravely affected by the repetition of ads.

CPC: Cost per click came from desktop and originated in search, where the main function of the ad was to lead the user to a website or product page to initiate the conversion funnel and close the purchase. On desktop, CPC works best when tied to targeted keywords, relying on search terms to narrow relevancy and qualify who is clicking on the ad. Display ads on desktop naturally became display on mobile, although the screen size and user no longer matches the desktop actions that display was originally intended for.

Weaknesses: Clicks have never been a good measure of media outside of search. Mobile amplifies this problem with many erroneous clicks being attributed to media performance. We’ve seen a rise in fraud from bots, especially among Open real-time bidding markets and other programmatic exchanges. Plus, CPC does not address video, where the mobile market is headed, with 12.8 percent of impressions currently equaling 55 percent of revenue.

CPCV: Cost per completed view. This measurement is more favorable for video, especially when used with hybrid mediation algorithms, because it measures according to the effectiveness of the ad per completed view. Therefore, the correct content, the right moment, and the intention of the person viewing the ad has been achieved, in theory, because the video ad has been completed.

Weaknesses: Factors such as whether the ad is skippable or non-skippable and rewarded or non-rewarded play into why it was completed. CPCV is also not equipped (yet) for cross-device measurement. There have been variations on this form, such as CPMV (cost per 1,000 views), however, this does not take into account if the video ad was completed or not.

Given the shortcomings of these common measurement methods, it’s no wonder we are seeing a push towards new forms of measurement. Interestingly enough, the most recent form of measurement to emerge for mobile isn’t new at all. It comes from an environment where advertisers have been consistently measuring audiences for quite awhile now: television.

GRP: Gross Rating Point is calculated by the percent of the target market reached multiplied by exposure frequency. There are innate benefits to using the GRP measurement: First, having originated from television, the strength of the GRP is in measuring elusive eyeballs on video-produced ads – comparing mobile video to television, you can see why CPI is not conducive (there’s nothing to install). Second, advertisers are comfortable with this measurement system. It makes sense to invite the majority share of ad spend (which is television, at 42 percent, in the United States) to the mobile conversation by speaking in familiar language as to how ads are measured. Last – but definitely not least – the gross rating point is ideal for cross-device measurement because it takes into account exposure frequency. This last point may be the clincher for why the aforementioned three metrics will lose effectiveness over the next few years.

Weaknesses: Because the GRP is a navigational metric, it’s a measurement of how you approach your audience and how the budget is spent rather than providing an analysis of whether your ad was viewed and what action (if any) was taken.

The next chapter in measurement will be driven by people-based metrics and behaviors. Who is watching these ads is what advertisers need to know; completion rate – including CPCV – is not enough information to determine performance. Meanwhile, installs are singular in purpose, excluding most brands, and clicks are troublesome at best. GRP may or may not be the correct answer; however, it is a move in the right direction for mobile video ads. Today, most targeting and optimization is at the app level, not the people level, and this has resulted in inefficient media spend.

Posted in Digital Ads, Internet of Things, Tech StocksLeave a Comment on Measuring Mobile Ad Performance: Why We Need to Borrow a Metric from TV

What Alphabet Won’t Tell You About the GDPR

Posted on May 31, 2018June 30, 2026 by io-fund
What Alphabet Won’t Tell You About the GDPR

Summary: This analysis answers the following questions:

  • Search is a large driver of revenue and doesn’t require data but what other portions of Alphabet’s advertising model will be affected by the GDPR?
  • How much revenue do the higher risk methods currently contribute to earnings?
  • Where is Alphabet most likely to incur GDPR fines?
  • How will non-personalized ads affect earnings and network sites?

Alphabet (GOOG) was announced in 2015 as a holding company to help separate Google’s advertising business from the sprawling investments in Fiber internet, cloud computing, smart home products and connected car products. While these new gadgets and the promise of AI have helped successfully rebrand Google’s search and advertising business, it’s important to remember that Alphabet is still an old-fashioned advertising company with nearly 90% of Q1 2018 revenue, or $26.6 billion, coming from advertising and only 15%, or $4.6 billion, coming from these other ambitions.

Therefore, understanding the nuances of advertising especially as it relates to data regulations is going to be key for any savvy Alphabet investor. While you can invest in Alphabet for AI or connected cars, we are in the beginning of the hype cycle for these technologies, whereas the current stock price reflects advertising. Unfortunately, top-rated analysts struggle to understand Alphabet’s business model as it relates to the GDPR and CEO Sundar Pichai did not offer any answers. In the Q1 2018 earnings call, Mark Mahaney of RBC Capital Markets asked if the “GDPR or other regulation is likely to impact materially the targeting capabilities that advertisers have on Google?” The CEO replied:

“You know, above everything else as we are working through GDPR we are making sure we are focused on getting that user experience right for our users and our partners. But to clarify your question further, you know, first of all, it’s important to understand that most of our ad business is Search, where we rely on very limited information, essentially what is in the keywords to show a relevant ad or product. And so, you know, we’ve been preparing this for 18 months and I think ­­ I think, you know, we have focused on getting the compliance right. It will be a years’ long effort and, you know, we are helping not just us, but our publishers and partners. But overall, we think we’ll be able to do all that, you know, with a positive impact for users and publishers and advertisers, and so our business.”

This answer was over-simplified at best. Yes, Search is a large driver of revenue but what are the other portions of the advertising machine which will be affected? And how much revenue do the higher risk methods currently contribute to earnings?

In addition, while Alphabet has been preparing for 18 months, they recently dropped new terms and conditions on publishers only 8 weeks before the GDPR took effect – and publishers are not happy about it.

Publishers are essential for quite a few elements to the Alphabet’s advertising machine as they provide additional surface area for ad space. By installing Google’s ad software onto websites and applications, publishers allow Google to advertise on their sites.

Most importantly, because this relates to ad revenue from networks outside of Google-owned properties, this portion of revenue is what holds the highest risk in this new era of data regulations – and the revenue is sizeable enough to lead to missed earnings in the future.

Alphabet & Data Regulations: The Good, The Bad and The Ugly

The Good: Search Doesn’t Need Data; Gmail, Chrome and Google Maps Have User Consent 

Quite a few of Google’s data-driven applications and services such as Gmail, Chrome and Google Maps can easily obtain user permission in exchange for the services these applications and browser provides. In addition, Google AdWords, which is based off search intent, will provide a safe haven Google’s advertising revenue as this does not require the company to harvest private data. However, even search is not immune as it’s been enriched with data such as location to enhance search results.

The Bad: Android OS Collects Surveillance-Level Data without User Consent

In one study of 850,000 internet users last year, mainly in the U.S. and Europe, Google tracked 64% of all pages loaded by mobile and web browsers

It’s hard to know where to start when looking at Google’s sprawl of potential data regulation issues. We could start with the fact they have a deal with data brokers that gives them access to 70% of our purchases made with credit cards and debit cards (without consent). The company is literally in your bank account. This is for the purpose of letting advertisers know if you completed a sale following an ad seen on one of Google’s properties. Another place to start is implicit data for advertising purposes, which uses your search history to target ads to you outside of Google search. This is why when you privately email your friend about a trip to Rome, you mysteriously get advertisements for flights to Rome on other websites.

While online tracking and conversion tracking are both invasive, the Android operating system is a surveillance-level behemoth with over 2 billion devices in circulation while littered with millions of applications leaking data to Alphabet’s advantage. Exponentially speaking, Android is impossible to contain. One study by the French research organization Exodus Privacy and Yale University’s Privacy Lab found that more than three in four Android apps contain a third-party tracker which extracts personal information, including location and in-app behavior. The apps the trackers were discovered includes Uber, Twitter, Spotify, and Tinder. The Privacy Lab found the in-app trackers revealed “an extensive data mining market buried within the mobile app ecosystem” enabling physical surveillance including through the use of WiFi, Bluetooth and ultrasonic sound inaudible to the human ear to track geolocations in real time.

Takeaway: Android will be the most likely source for fines by the European Union as it will be challenging to partition device IDs by geographies. Some have conjectured Alphabet will risk fines before voluntarily reducing their cyber intelligence. The fines are 1.6% of annual global revenue, or $4.4 billion for Google.

The Ugly: Walking the Razor’s Edge Between Data Violations and Non-Personalized Ads

Data collected from the Android OS augments and enriches data science modeling for Alphabet to monetize the data elsewhere. That “elsewhere” is Adsense, AdX and AdMob. Google’s AdSense and AdX Networks enable non-Google websites to incorporate Google display advertising, and this is what current publishers are in an uproar about.

To summarize, Alphabet is attempting to become a co-controller for data in some instances and a processor in other instances. It’s unknown how the European Union will view data leaks from publishers to Alphabet.

Source: Quora

The level of involvement Google has as either a co-controller or processor is important for investors to understand as these regulations continue to play out. This may be hard to imagine today, but if data collection returns to property-owned data collection only, then the premium price advertisers pay for Google ad inventory may diminish as Google will struggle to differentiate itself from other advertising options from a campaign ROI standpoint if or when it fails to get the proper consent to collect the data and broker the ads.

Source: Statista

The worst case scenario here is that Google has to display “non-personalized” ads where consent isn’t obtained – which Google is already prepared to do: “As previously announced, we’re also launching a Non-Personalized Ads solution (DFP/AdX, AdMob, AdSense) to enable publishers to present EEA users with a choice between personalized ads and non-personalized ads (or to choose to serve only non-personalized ads to users in the EEA).”

As mentioned above, this is where the premium price can potentially recede. By being forced to serve non-personalized ads, the competitive advantage Google has will diminish in this circumstance.

Bottom Line: 

While Search is intact, there are many layers to data collection and ad targeting which will lower ROI campaign performance as the data Alphabet is allowed to collect continues to wane. In this article, we’ve discussed that the Android OS is leaky and the most likely part of Alphabet’s business to be fined. As far as revenue is concerned, non-personalized ads is the potential weakness especially on network sites as $17.59 billion was earned from network sites annually in 2017.

Posted in Digital Ads, Financial Markets, Tech StocksLeave a Comment on What Alphabet Won’t Tell You About the GDPR

Long on Roku – Even if they Miss Q1 Earnings

Posted on May 8, 2018June 30, 2026 by io-fund
Long on Roku – Even if they Miss Q1 Earnings

Summary: Despite knee jerk volatility, Roku will become a large cap stock in OTT (over-the-top) within 2-5 years. While Pay TV operators continue to bleed subscribers, Roku has the best business model to capitalize on these losses compared to highly fragmented OTT and SVOD competitors. In addition, Roku has maintained competitive vigor as the number one streaming device in the United States while remaining vendor agnostic. Going global will cement this position.

Roku (ROKU) stock prices have fluctuated wildly from being one of the hottest stocks in 2017 with a 400% return from the IPO price of $14 to a high in December of $56. From there, the streaming device maker saw shares drop 42% where it’s been range-bound at $31-$34 per share. That is, except when Amazon (AMZN) announced a fairly irrelevant partnership with a dying brick-and-mortar Best Buy (BBY) resulting in an 11.8% drop.

Or, the announcement of Roku offering access to ESPN+, which bumped the shares up 12%. While some are still confused on Roku’s value proposition, one thing is for certain, Roku’s stock is volatile and will continue to test investors’ technological depth on how exactly a hardware company plans to stay profitable … except, Roku is not a hardware company. Wall Street just (mistakenly) thinks it is.

This article originally appeared May 8th on Seeking Alpha.

Ahead of earnings this week, KeyBanc placed a $42 price target on the stock at about 27% above current levels of the shares. Notably, many short sellers lost the gamble when the lock-up expired six months after the IPO date in March with false expectations the market would be flooded with shares. The stock has seen about an 11% decline since March from the price of $39 – not the crash short investors were hoping for. Meanwhile, Roku’s short interest has dropped 38% since its peak from 10 million shares shorted at the end of March to 6.2 million shares shorted by mid-April.

Roku’s stock will continue to be volatile as the company expects to continue losing money in 2018 aiming to operate “at, or near, break-even on an operating cash flow basis.” Yet bulls continue to focus on the huge upside potential as the number one streaming device in the United States with $90 million in revenue coming from the ad-supported platform.

Looking beyond the knee-jerk volatility, here are the top reasons Roku will be a large cap stock in OTT (over-the-top) within 2-5 years.

1. Blood In The Water:

The peak for pay TV in the United States occurred in 2010/2011 when it began a predictable erosion. The number of pay-tv subscribers fell by 8,000 in 2012 and accelerated to 164,000 subscriber losses in 2014. Last year, the erosion neared deterioration with the top 10 pay TV operators losing a staggering 3 million linear subscribers in 2017 according to Leichtman Research.

Roku is the most synonymous business model with cable and satellite TV providers and can capitalize long-term on this massive subscriber loss by leveraging its advertising, audience development and content distribution services, which make up 89% of gross margins from the platform. In fact, if Roku was a traditional cable company, it would be the third largest distributor of content in the United States behind Comcast (CMCSA) and AT&T (T) with 19 million active subscribers.

2. Vendor Agnostic:

Roku critics cite too much competition for this mid-cap stock to carry the growth needed for long-term gains, especially from Apple (AAPL), Google (NASDAQ:GOOG) (GOOGL) and Amazon who all have a play in the hardware market for OTT video streaming services. However, this weakness is actually Roku’s strength. The Roku operating system, Roku OS 8, is a robust, reliable option for OTT streaming and has attracted partnerships with 1 in 5 smart TVs in the United States.

Meanwhile, operating systems like Samsung’s (OTC:SSNLF) Tizen continue to be plagued with bugs. But by being vendor-agnostic, Roku has still been able to secure a partnership for their free ad-supported channel with competing OSs like Samsung/Tizen. In addition, by remaining agnostic, Roku has maintained a full menu of original programming while corporate spats between Google (YouTube) and Amazon Prime restrict content choices.

Roku has also built a formidable catalog of 5,000 channels that even Google has not even come close to rival. This is where the discussion as to Roku being a hardware company should curtail as the “player” revenue will soon be eclipsed by the platform revenue (platform revenue stood at 45% in Q4 2017). It’s the latter where the company is making its largest investments including OTT advertising measurement tools, launching the free Roku channel, growing licensing fees and partnering for live TV.

3. There’s More To OTT Than Highly Fragmented Subscriptions:

Previously, viewing data and ratings on SVOD (subscription video on demand) such as Netflix (NFLX), Hulu Plus and Amazon Prime and other OTT content was not disclosed even by Nielsen (NLSN). However, in a recent interview, Nielsen COO Steve Hasker revealed four previously undisclosed statistics about SVOD such as 89.5% of SVOD content is primarily viewed on the television glass whereas 11.5% is viewed on smartphones and tablets.

Of this time, 80% is spent on catalog programming whereas 20% is spent on original content. Meanwhile, as competition increases, the costs for original programming are escalating with Netflix spending $8 billion in 2018 in order to remain competitive for a small piece of the pie (20% of how time is spent). Meanwhile, Roku has held firm on not creating original programming and the statistics support this. The costs for original programming are likely to escalate as HBO, Showtime, and now Apple will continue to compete for this space.

In addition, subscribers pay for quite a few premium $8+ subscription channels, which will eventually lead to subscription fatigue – not to mention mitigate the reason cord-cutters leave pay TV services – which is to lower costs. For a subscriber with YouTube TV ($40) and three premium channels ($24-26), they are paying $65+ per month. This pricing will meet resistance by cord cutters and ad-supported video on demand (AVOD) will be the answer.

Most importantly, original programming will consolidate or bundle (like it has on cable) and Roku is the perfect middleman to do this.

4. Global Potential:

This point ties into the previous two points where agnosticism in hardware and operating system along with building out a free, ad-supported channel will help Roku crush global expansion – especially in the emerging markets. The low price point for both the hardware and free content is desirable for global adoption, plus the 5,000 channels that Roku offers caters to differences in cultural viewing preferences.

Roku has shown competitive vigor by maintaining the lead as the top streaming media player in the United States claiming 37% of devices with nearly 40 million U.S. customers use Roku once per month. It’s only a matter of time until they take this success to the billions of people overseas who can’t afford pay TV or want to reduce pay TV costs.

5. Purely OTT Play:

In reference to the first point, there is an opportunity to capitalize due to massive pay TV subscriber losses such as last month when Charter (CHTR) lost 12% of market cap after reporting 112,000 subscriber losses and Comcast reported a loss of 98,000 in video users compared to a gain of 41,000 one year ago in Q1 2017.

This bloodbath from attrition will continue to accelerate through 2025 when even TV networks are expected to experience a 41% revenue loss. Roku is a very desirable purely OTT mid-cap choice with 19 million users and a $3.29 billion market cap that narrows in on this staggering market trend. Compare this to Charter Communications, which has a $65 billion market cap and only 16 million users.

Conclusion:

In the next 2-5 years, Roku will outpace competitors globally as it continues to be the cheapest, agnostic option with the most channels. Its executive team is experienced in OTT media and advertising, and the platform revenue will redefine how investors see this razor/razor blade opportunity (device player that locks in licensing fees and advertising). The free channel especially is attractive setting it apart from the over-abundance of paid, subscription channels. In addition, live TV will be an attractive space for Roku with the company already recently partnered with ABC News, People TV and Cheddar.

Posted in Ctv, Financial Markets, Media, Svod, Tech StocksLeave a Comment on Long on Roku – Even if they Miss Q1 Earnings

Facebook’s Challenges Are Much Bigger Than Cambridge Analytica

Posted on April 17, 2018June 30, 2026 by io-fund
Facebook’s Challenges Are Much Bigger Than Cambridge Analytica

Next month, when General Data Privacy Regulations (GDPR) take effect, there will be a seismic shift across many technology stocks reflecting a private data drought.

Facebook is a half a trillion-dollar profit machine because of a business model dependent on first-party data which will come under scrutiny May 25 under the new GDPR policies.

Average revenue per user (ARPU) currently stands at $26.76 compared to $4.08 at IPO. With strict policies for data control, consent, erasure and portability, ARPU and earnings will drop significantly.


Editor’s note: This article was published on Seeking Alpha on April 17th, 2018

Investors should be aware of a data bust set to occur on May 25 due to policies called General Data Protection Regulation (GDPR). Since 2012, big data has been traded like a commodity, helping to raise stock prices and boost earnings. We saw a peak in Facebook’s (NASDAQ: FB) average revenue per user, especially on mobile which comprises 88% of earnings, when the company introduced Audience Network to target audiences across third-party mobile websites and applications. However, these current methods for collecting and leveraging data without consent are undergoing massive changes in the coming months.

Why the GDPR Matters in the United States:

General Data Protection Regulation (GDPR) is the biggest data privacy shake-up in history and it comes at a time when many tech companies already are under scrutiny. In brief, the GDPR has four principles covering data control, consent, portability and erasure. Companies must obtain explicit permission any time data is collected on an EU citizen. Users can request all of the data a company has collected and must be able to revoke consent. The provision which may be most profit busting is that users also will have the ability to erase their data or port and transfer their data to another company. Both erasure and portability will greatly weaken ad-targeting capabilities.

While the measures are directly binding and applicable to any company that services a citizen of the European Union, it will be challenging for US lawmakers to defend a lower level of privacy after the regulations are in effect. Most companies service at least one European customer and therefore must abide by the policies within these countries. You can expect an additional global ripple effect due to difficulties in partitioning data and siloing by country. In addition, immense pressure will continue to build over the coming months as all FAANG companies will be asked why there are separate standards for citizens outside European borders. Recently, Mark Zuckerberg was asked if he planned to give North American Facebook users a lower standard of data protection in an April 4 conference call to which he replied “we’ll make all controls and settings the same everywhere, not just in Europe.” One week later, on April 9, the Center for Digital Democracy along with other consumer and privacy organizations wrote an open letter to Facebook requesting the company to officially adopt GDPR measures in the United States. Not if, but when this happens, there will be a seismic shift across many technology stocks reflecting a private data drought.

Cambridge Analytica is Mild Compared to What’s Coming:

Facebook’s Cambridge Analytica scandal is a mild situation of third-party data being bartered (Congress called this “rented”). The scandal saw data from 87 million users accessed through Facebook’s Open Graph API (application programming interface), which allowed data to be accessed by third-party developers in exchange for Facebook becoming the authority in user identities across tens of thousands of applications and websites. Most of this data was traded without consent, such as when Cambridge Analytica obtained profiles from friends of friends to identify the personalities of American voters and to influence voting behavior.

While Facebook testified last week, very few Facebook users (and perhaps senators) understand the far-reaching implications of having 87 million identities in the hands of data scientists, who can model the training set and create a psychological prediction graph through a practice called look-alike modeling. The psychological prediction graph obtained from lookalike modeling can then be used beyond the Facebook platform to influence behavior through micro-targeted ads elsewhere. Essentially, your behaviors and intents logged on Facebook create a level of mind control that can be unsettling on an ordinary day – but most certainly on a hyped election day.

The ethics in this situation may take time to sort out. However, Cambridge Analytica will have a minor effect on Facebook’s business model. The Open Graph API was an equal and free exchange (although by scraping and trading application data, there’s most certainly value as the API enriched Facebook’s platform data by resulting in stronger predictions). In the industry, this is known as third-party data.

The cataclysm that Facebook and all tech companies next month must navigate relates to first-party data, which will be heavily scrutinized and regulated under GDPR policies.first-party data, which will be heavily scrutinized and regulated under GDPR policies.

You Are the Product because Data is Bartered, Not Sold

Wall Street analysts are speculating that Facebook stock can rebound and may be at its bottom. But let’s be clear. Facebook can rebound from the Cambridge Analytica scandal but these analysts fail to consider the impending GDPR. Today, Facebook is a half a trillion dollar profit machine because of a business model dependent on first-party data (or the data Facebook holds on its customers). Advertisers buy audiences from this data and pay an extraordinary amount of money to advertise to these audiences because Facebook’s data has logged behaviors and intents to influence users to make impulsive purchases. Just like a political campaign can influence voters to vote a certain way. Facebook’s advertising network can influence people to buy things they may not necessarily want or need due to psychological profiling.

An essential piece to this is that Facebook has an advertising network that uses this data to target advertisements outside of the social media platform. Thousands of mobile websites and applications benefit from better ad targeting based on Facebook’s data – and this exchange is done without user consent. This is why Facebook’s earnings are 88% from mobile – they make money on mobile outside of the social media platform.“Facebook holds an enormous amount of data on users collected without consent on user activity happening outside of the platform,” Bruce Schneier explained, a security expert and fellow at Harvard’s Berkman Center: “Everything people do, either on Facebook directly or on sites that have a Facebook ‘Like’ button, reveals information about them to Facebook … Facebook tracks you even when you’re not on Facebook, because of their extensive surveillance network on sites that link to them.” Additionally, Facebook tracks location without explicit consent through iOS and Android location services. For instance, they can even inform advertisers whether you’ve walked into a physical retail store following an ad display – actually, you can be within 150-1,500 feet of the store and the advertiser will know.

First-Party Data is How Facebook Makes Money – Without Consent

There are three sets of data that Facebook uses for ad targeting. First-party data owned by Facebook, first-party data owned by brands, and third-party data from various applications and mobile websites.

  1. First-party data owned by Facebook:The four principles of the new regulations under the GDPR are data control, consent, portability and erasure. Facebook’s business model is at great risk because users did not give consent for data collected outside of the platform such as location data and web browsing activity (among others). Facebook also is sharing data outside of the social media platform to advertisers without consent to boost profits through their ad network. The disclosureFacebook describes includes what you did on the social media site without taking into account data collected through the API, artificial intelligence used on photos and videos, lookalike modeling and psychological profiling. Currently, Facebook offers an eight-week snapshot of advertisers who hold your account information with one user finding over 2,000 advertisers had accessed his information on a rolling basis in this short time frame – none of which had consent.

Average revenue per user currently stands at $26.76 per user in the United States and Canada per year. Historically, Facebook made $4.08 per user in the United States and Canada when the company had its IPO in 2012. The last six years have reaped the benefits of unregulated data through mobile and the Audience Network which uses Facebook first-party data in questionable ways. When users get a clear picture of what’s being tracked and delete their data, as provided for by the GDPR, the average revenue per user (ARPU) will drop significantly. User sentiment already is shaky following Cambridge Analtyica with 9% of Facebook users in the United States deleting their account and 35% are reportedly using Facebook less.

  1. First-party data owned by brands:Facebook allows brands to upload their customer data and target audiences accordingly. For instance, the retailer Target (NYSE:TGT) may have first-party data on you from purchases you made in the store that can be uploaded and used to advertise to custom audiences on Facebook. Many brands also will undergo the same regulations as to how they obtained their data with fines up to 4% of an organization’s global turnover.
  2. Third-party data:Facebook already has announced plans to shut down the self-serve tool that advertisers use to import data from third-partiessuch as Oracle (NYSE: ORCL) and Acxiom (NASDAQ: ACXM). More announcements have followed to shut down managed Custom Audiences which will make the platform less desirable from a targeting standpoint. Most of these moves are to reduce Facebook’s liability now but will soon be mandatory under GDPR regulations.

What to Expect When Data Dries Up

Facebook’s entire model is based on being able to share data with advertisers, as confirmed by Sheryl Sandberg earlier this month. In fact, what she stated was “Our service depends on your data, (so) we don’t have an opt-out at the highest level. That would be a paid product.”

What Sandberg failed to mention is that an opt-out at the highest level is coming for EU citizens next month and there is immense pressure for all technology companies to extend these privacy protections to North American citizens. The alternative, which is to convert 2 billion users to a paid product, will cause massive attrition for the platform.

The bottom line is that Facebook’s 2014 revenue was $12.4 billion before it began to collect data and sell audiences through questionable practices including off the platform across apps and mobile sites. Over the last three years, the commodity of data has been more valuable than oil with 2017 revenue reaching $40 billion. What will come of Facebook when the data dries up? As Zuckerberg stated, “it will take years to sort this out.” Meanwhile, the bottom is nowhere in sight.

Disclosure: I/we have no positions in any stocks mentioned, and no plans to initiate any positions within the next 72 hours.

Next month, when General Data Privacy Regulations (GDPR) take effect, there will be a seismic shift across many technology stocks reflecting a private data drought.

Facebook is a half a trillion-dollar profit machine because of a business model dependent on first-party data which will come under scrutiny May 25 under the new GDPR policies.

Average revenue per user (ARPU) currently stands at $26.76 compared to $4.08 at IPO. With strict policies for data control, consent, erasure and portability, ARPU and earnings will drop significantly.


Editor’s note: This article was published on Seeking Alpha on April 17th, 2018

Investors should be aware of a data bust set to occur on May 25 due to policies called General Data Protection Regulation (GDPR). Since 2012, big data has been traded like a commodity, helping to raise stock prices and boost earnings. We saw a peak in Facebook’s (NASDAQ: FB) average revenue per user, especially on mobile which comprises 88% of earnings, when the company introduced Audience Network to target audiences across third-party mobile websites and applications. However, these current methods for collecting and leveraging data without consent are undergoing massive changes in the coming months.

Why the GDPR Matters in the United States:

General Data Protection Regulation (GDPR) is the biggest data privacy shake-up in history and it comes at a time when many tech companies already are under scrutiny. In brief, the GDPR has four principles covering data control, consent, portability and erasure. Companies must obtain explicit permission any time data is collected on an EU citizen. Users can request all of the data a company has collected and must be able to revoke consent. The provision which may be most profit busting is that users also will have the ability to erase their data or port and transfer their data to another company. Both erasure and portability will greatly weaken ad-targeting capabilities.

While the measures are directly binding and applicable to any company that services a citizen of the European Union, it will be challenging for US lawmakers to defend a lower level of privacy after the regulations are in effect. Most companies service at least one European customer and therefore must abide by the policies within these countries. You can expect an additional global ripple effect due to difficulties in partitioning data and siloing by country. In addition, immense pressure will continue to build over the coming months as all FAANG companies will be asked why there are separate standards for citizens outside European borders. Recently, Mark Zuckerberg was asked if he planned to give North American Facebook users a lower standard of data protection in an April 4 conference call to which he replied “we’ll make all controls and settings the same everywhere, not just in Europe.” One week later, on April 9, the Center for Digital Democracy along with other consumer and privacy organizations wrote an open letter to Facebook requesting the company to officially adopt GDPR measures in the United States. Not if, but when this happens, there will be a seismic shift across many technology stocks reflecting a private data drought.

Cambridge Analytica is Mild Compared to What’s Coming:

Facebook’s Cambridge Analytica scandal is a mild situation of third-party data being bartered (Congress called this “rented”). The scandal saw data from 87 million users accessed through Facebook’s Open Graph API (application programming interface), which allowed data to be accessed by third-party developers in exchange for Facebook becoming the authority in user identities across tens of thousands of applications and websites. Most of this data was traded without consent, such as when Cambridge Analytica obtained profiles from friends of friends to identify the personalities of American voters and to influence voting behavior.

While Facebook testified last week, very few Facebook users (and perhaps senators) understand the far-reaching implications of having 87 million identities in the hands of data scientists, who can model the training set and create a psychological prediction graph through a practice called look-alike modeling. The psychological prediction graph obtained from lookalike modeling can then be used beyond the Facebook platform to influence behavior through micro-targeted ads elsewhere. Essentially, your behaviors and intents logged on Facebook create a level of mind control that can be unsettling on an ordinary day – but most certainly on a hyped election day.

The ethics in this situation may take time to sort out. However, Cambridge Analytica will have a minor effect on Facebook’s business model. The Open Graph API was an equal and free exchange (although by scraping and trading application data, there’s most certainly value as the API enriched Facebook’s platform data by resulting in stronger predictions). In the industry, this is known as third-party data.

The cataclysm that Facebook and all tech companies next month must navigate relates to first-party data, which will be heavily scrutinized and regulated under GDPR policies.first-party data, which will be heavily scrutinized and regulated under GDPR policies.

You Are the Product because Data is Bartered, Not Sold

Wall Street analysts are speculating that Facebook stock can rebound and may be at its bottom. But let’s be clear. Facebook can rebound from the Cambridge Analytica scandal but these analysts fail to consider the impending GDPR. Today, Facebook is a half a trillion dollar profit machine because of a business model dependent on first-party data (or the data Facebook holds on its customers). Advertisers buy audiences from this data and pay an extraordinary amount of money to advertise to these audiences because Facebook’s data has logged behaviors and intents to influence users to make impulsive purchases. Just like a political campaign can influence voters to vote a certain way. Facebook’s advertising network can influence people to buy things they may not necessarily want or need due to psychological profiling.

An essential piece to this is that Facebook has an advertising network that uses this data to target advertisements outside of the social media platform. Thousands of mobile websites and applications benefit from better ad targeting based on Facebook’s data – and this exchange is done without user consent. This is why Facebook’s earnings are 88% from mobile – they make money on mobile outside of the social media platform. “Facebook holds an enormous amount of data on users collected without consent on user activity happening outside of the platform,” Bruce Schneier explained, a security expert and fellow at Harvard’s Berkman Center: “Everything people do, either on Facebook directly or on sites that have a Facebook ‘Like’ button, reveals information about them to Facebook … Facebook tracks you even when you’re not on Facebook, because of their extensive surveillance network on sites that link to them.” Additionally, Facebook tracks location without explicit consent through iOS and Android location services. For instance, they can even inform advertisers whether you’ve walked into a physical retail store following an ad display – actually, you can be within 150-1,500 feet of the store and the advertiser will know.

First-Party Data is How Facebook Makes Money – Without Consent

There are three sets of data that Facebook uses for ad targeting. First-party data owned by Facebook, first-party data owned by brands, and third-party data from various applications and mobile websites.

  1. First-party data owned by Facebook: The four principles of the new regulations under the GDPR are data control, consent, portability and erasure. Facebook’s business model is at great risk because users did not give consent for data collected outside of the platform such as location data and web browsing activity (among others). Facebook also is sharing data outside of the social media platform to advertisers without consent to boost profits through their ad network. The disclosure Facebook describes includes what you did on the social media site without taking into account data collected through the API, artificial intelligence used on photos and videos, lookalike modeling and psychological profiling. Currently, Facebook offers an eight-week snapshot of advertisers who hold your account information with one user finding over 2,000 advertisers had accessed his information on a rolling basis in this short time frame – none of which had consent.

Average revenue per user currently stands at $26.76 per user in the United States and Canada per year. Historically, Facebook made $4.08 per user in the United States and Canada when the company had its IPO in 2012. The last six years have reaped the benefits of unregulated data through mobile and the Audience Network which uses Facebook first-party data in questionable ways. When users get a clear picture of what’s being tracked and delete their data, as provided for by the GDPR, the average revenue per user (ARPU) will drop significantly. User sentiment already is shaky following Cambridge Analtyica with 9% of Facebook users in the United States deleting their account and 35% are reportedly using Facebook less.

  1. First-party data owned by brands: Facebook allows brands to upload their customer data and target audiences accordingly. For instance, the retailer Target (NYSE:TGT) may have first-party data on you from purchases you made in the store that can be uploaded and used to advertise to custom audiences on Facebook. Many brands also will undergo the same regulations as to how they obtained their data with fines up to 4% of an organization’s global turnover.
  2. Third-party data: Facebook already has announced plans to shut down the self-serve tool that advertisers use to import data from third-parties such as Oracle (NYSE: ORCL) and Acxiom (NASDAQ: ACXM). More announcements have followed to shut down managed Custom Audiences which will make the platform less desirable from a targeting standpoint. Most of these moves are to reduce Facebook’s liability now but will soon be mandatory under GDPR regulations.

What to Expect When Data Dries Up

Facebook’s entire model is based on being able to share data with advertisers, as confirmed by Sheryl Sandberg earlier this month. In fact, what she stated was “Our service depends on your data, (so) we don’t have an opt-out at the highest level. That would be a paid product.”

What Sandberg failed to mention is that an opt-out at the highest level is coming for EU citizens next month and there is immense pressure for all technology companies to extend these privacy protections to North American citizens. The alternative, which is to convert 2 billion users to a paid product, will cause massive attrition for the platform.

The bottom line is that Facebook’s 2014 revenue was $12.4 billion before it began to collect data and sell audiences through questionable practices including off the platform across apps and mobile sites. Over the last three years, the commodity of data has been more valuable than oil with 2017 revenue reaching $40 billion. What will come of Facebook when the data dries up? As Zuckerberg stated, “it will take years to sort this out.” Meanwhile, the bottom is nowhere in sight.

Disclosure: I/we have no positions in any stocks mentioned, and no plans to initiate any positions within the next 72 hours.
Posted in Social Media, Tech Stocks, Tech StocksLeave a Comment on Facebook’s Challenges Are Much Bigger Than Cambridge Analytica

Posts navigation

Newer posts

Recent Posts

  • The IPO Glut of 2020: Why Valuations Have Gone Too Far
  • Zoom Discusses Two Important Catalysts In Q1 Earnings
  • Three Risk Management Tools the I/O Fund Offers
  • Micron Is Up 900%. Here’s Why the AI Memory Trade May Still Have Room to Run
  • Credo: Reliability Leader Aggressively Moves into Optics

Recent Comments

No comments to show.

Archives

  • June 2026
  • May 2026
  • April 2026
  • March 2026
  • February 2026
  • January 2026
  • December 2025
  • November 2025
  • October 2025
  • September 2025
  • August 2025
  • July 2025
  • June 2025
  • May 2025
  • April 2025
  • March 2025
  • February 2025
  • January 2025
  • December 2024
  • November 2024
  • October 2024
  • September 2024
  • August 2024
  • July 2024
  • June 2024
  • May 2024
  • April 2024
  • March 2024
  • February 2024
  • January 2024
  • December 2023
  • November 2023
  • October 2023
  • September 2023
  • August 2023
  • July 2023
  • June 2023
  • May 2023
  • April 2023
  • March 2023
  • February 2023
  • January 2023
  • December 2022
  • November 2022
  • October 2022
  • September 2022
  • August 2022
  • July 2022
  • June 2022
  • May 2022
  • April 2022
  • March 2022
  • February 2022
  • January 2022
  • December 2021
  • November 2021
  • October 2021
  • September 2021
  • August 2021
  • July 2021
  • June 2021
  • May 2021
  • April 2021
  • March 2021
  • February 2021
  • January 2021
  • December 2020
  • November 2020
  • October 2020
  • September 2020
  • August 2020
  • July 2020
  • June 2020
  • May 2020
  • April 2020
  • March 2020
  • February 2020
  • January 2020
  • December 2019
  • November 2019
  • October 2019
  • September 2019
  • August 2019
  • July 2019
  • June 2019
  • May 2019
  • April 2019
  • March 2019
  • February 2019
  • January 2019
  • December 2018
  • November 2018
  • October 2018
  • September 2018
  • August 2018
  • July 2018
  • June 2018
  • May 2018
  • April 2018
  • February 2018
  • January 2018

Categories

  • 5G
  • About
  • Accounting Tips
  • AdTech
  • Ai Platforms
  • Ai Platforms
  • Ai Platforms
  • Ai Platforms
  • Ai Platforms
  • Ai Platforms
  • Ai Platforms
  • Ai Platforms
  • Ai Platforms
  • Ai Platforms
  • Ai Platforms
  • Ai Platforms
  • Ai Platforms
  • Ai Platforms
  • Ai Platforms
  • Ai Platforms
  • AI Stocks
  • AI Stocks
  • Analysts
  • Application Monitoring
  • Application Monitoring
  • Applications
  • Applications
  • Applications
  • Applications
  • Applications
  • Applications
  • Applications
  • AR
  • Audit Reports
  • Autonomous Vehicles
  • Autonomous Vehicles
  • Autonomous Vehicles
  • Autonomous Vehicles
  • Autonomous Vehicles
  • Autonomous Vehicles
  • Autonomous Vehicles
  • Avod
  • Avod
  • Battery Charging
  • Bear Market
  • Bitcoin
  • Bitcoin
  • Bitcoin
  • Bitcoin
  • Bitcoin
  • Bitcoin
  • Bitcoin
  • Blockchain
  • Blockchain
  • Blockchain
  • Blockchain
  • Blockchain
  • Blockchain
  • Blockchain
  • Broad Market Today
  • Bull Market
  • Bull Market
  • Chainlink
  • Chainlink
  • Chainlink
  • Chainlink
  • China Stocks
  • Cloud
  • Cloud Infrastructure
  • Cloud Infrastructure
  • Cloud Infrastructure
  • Cloud Infrastructure
  • Cloud Infrastructure
  • Cloud Infrastructure
  • Cloud Infrastructure
  • Cloud Platforms
  • Cloud Platforms
  • Cloud Software
  • Cloud Software
  • Cloud Software
  • Cloud Software
  • Cloud Software
  • Cloud Software
  • Cloud Technology
  • Company
  • Company
  • Console Gaming
  • Console Gaming
  • Console Gaming
  • Consumer
  • Consumer
  • Consumer
  • Consumer
  • Consumer
  • Consumer
  • Consumer
  • Consumer
  • Consumer
  • Consumer
  • Consumer
  • Consumer
  • Consumer
  • Consumer
  • Consumer Tech
  • Corrections
  • Crypto Investment
  • Ctv
  • Ctv
  • Ctv
  • Ctv
  • Ctv
  • Ctv
  • Ctv
  • Ctv
  • Ctv
  • Ctv
  • Cybersecurity
  • Cybersecurity
  • Cybersecurity
  • Cybersecurity
  • Cybersecurity
  • Cybersecurity
  • Cybersecurity
  • Cybersecurity
  • Cybersecurity
  • Cybersecurity
  • Cybersecurity
  • Cybersecurity
  • Data
  • Data Analytics
  • Data Analytics
  • Data Analytics
  • Data Center
  • Data Center
  • Data Center
  • Data Center
  • Data Center
  • Data Center
  • Data Center
  • Data Center
  • Data Center
  • Data Center
  • Data Center
  • Data Center
  • Data Center
  • Data Center
  • Data Center
  • Data Center and Processing
  • Data Warehousing
  • Data Warehousing
  • Data Warehousing
  • Data Warehousing
  • Databases
  • Databases
  • Databases
  • Databases
  • Dating
  • Defi
  • Digital Ads
  • Digital Ads
  • Digital Ads
  • Digital Ads
  • Digital Ads
  • Digital Ads
  • Digital Ads
  • Digital Ads
  • Digital Ads
  • Digital Ads
  • Digital Ads
  • Digital Ads
  • Digital Ads
  • Digital Ads
  • E-Commerce
  • Earning Updates
  • Earning Updates
  • Earning Updates
  • Earning Updates
  • Earning Updates
  • Earnings Report
  • Earnings Report
  • Earnings Report
  • Earnings Report
  • Earnings Report
  • Earnings Report
  • Earnings Report
  • Earnings Report
  • ECommerce
  • Electric Vehicles
  • Electric Vehicles
  • Electric Vehicles
  • Electric Vehicles
  • Electric Vehicles
  • Electric Vehicles
  • Electric Vehicles
  • Energy Stocks
  • Enterprise
  • Enterprise
  • Enterprise
  • Enterprise
  • Enterprise
  • Enterprise
  • Enterprise
  • Enterprise
  • Enterprise
  • Ethereum
  • Events1
  • Events1
  • Exchange
  • Faq
  • Finance
  • Financial Analysis
  • Financial Analysis
  • Financial Analysis
  • Financial Analysis
  • Financial Analysis
  • Financial Analysis
  • Financial Analysis
  • Financial Analysis
  • Financial Analysis
  • Financial Analysis
  • Financial Analysis
  • Financial Analysis
  • Financial Markets
  • FinTech
  • Fundamental Analysis
  • Gambling
  • Gaming
  • Genomics
  • Glossary
  • Green Energy
  • Growth Stocks
  • Growth Stocks
  • Growth Stocks
  • Headsets
  • Headsets
  • Health Tech
  • Hydrogen
  • Identity
  • Identity
  • Identity
  • Inflation
  • Inflation
  • Inflation
  • Internet of Things
  • Interviews
  • Interviews
  • Interviews
  • Interviews
  • Investing
  • Investing
  • Ltbh
  • Ltbh
  • Ltbh
  • Ltbh
  • Ltbh
  • Macro Trends
  • Macro Trends
  • Market Trends
  • Market Trends
  • Market Trends
  • Market Trends
  • Market Trends
  • Market Trends
  • Market Trends
  • Market Updates
  • Market Updates
  • Market Updates
  • Market Updates
  • Market Updates
  • Market Updates
  • Market Updates
  • Market Updates
  • Market Updates
  • Market Updates
  • Media
  • Membership
  • Mining
  • Mobile
  • Mobile
  • Mobile
  • Mobile
  • Mobile Gaming
  • Mobile Gaming
  • Mobile Gaming
  • Multimedia
  • Music Streaming
  • NVDA | NVIDIA Corporation
  • Performance Updates
  • Pin Content
  • Podcasts
  • Podcasts
  • Podcasts
  • Portfolio
  • Premium Research
  • Press Releases
  • Press Releases
  • Productivity
  • Productivity
  • Productivity
  • Productivity
  • Productivity
  • Productivity
  • Productivity
  • Reports and Whitepapers
  • Research Services Preview
  • Resources
  • Resources
  • Semiconductor Stocks
  • Semiconductors
  • Semiconductors
  • Semiconductors
  • Semiconductors
  • Semiconductors
  • Semiconductors
  • Semiconductors
  • Semiconductors
  • Semiconductors
  • Semiconductors
  • Semiconductors
  • Semiconductors
  • Semiconductors
  • Social Media
  • Social Media
  • Social Media
  • Social Media
  • Social Media
  • Social Media
  • Social Media
  • Software
  • Software
  • Software
  • Software
  • Software
  • Software
  • Software
  • Software
  • Software
  • Software
  • Software
  • Software
  • Software
  • Software
  • Software
  • Solar
  • Solar
  • Stock Analysis PDFs
  • Stock Updates
  • Stock Updates (Blogs)
  • Supplychain
  • Supplychain
  • Supplychain
  • Supplychain
  • Supplychain
  • Supplychain
  • Svod
  • Svod
  • Svod
  • Svod
  • Svod
  • Svod
  • Tech Podcast
  • Tech Stock News
  • Tech Stock News
  • Tech Stock News
  • Tech Stock News
  • Tech Stock News
  • Tech Stocks
  • Tech Stocks
  • Tech Stocks
  • Tech Stocks
  • Tech Stocks
  • Tech Stocks
  • Tech Stocks
  • Tech Stocks
  • Tech Stocks
  • Tech Stocks
  • Tech Stocks
  • Tech Stocks
  • Tech Stocks
  • Tech Stocks
  • Technical Analysis
  • Telehealth
  • Telehealth
  • Telehealth
  • Telehealth
  • Testing Equipment
  • Testing Equipment
  • Top Tech Stock News
  • Travel
  • Trends Report
  • Tutorials
  • Uncategorized
  • Updates
  • Updates
  • Updates
  • Video
  • Video
  • Video
  • Video
  • Video Footage
  • VR
  • Webinar Alerts
  • Webinar Alerts
  • Webinars
Proudly powered by WordPress | Theme: iofund by iofund.co.uk.