Skip to content
Logo-main-white.860316a8

I/O Fund

  • Home
  • Free Stock Analysis
  • AI Stocks
  • BEST OF 2025
  • Analysts
  • Nvidia Hub
  • About
    • Case Studies
    • About Us
    • Premium Services
    • Pricing
    • Notable Wins
    • I/O Fund Reviews
    • Media
  • Contact Us

Month: August 2023

August Positions Report

Posted on August 16, 2023June 30, 2026 by io-fund

For reference to terminology used, please look at technical analysis under our resources section here. Regarding the horizontal lines, black lines represent strong support/resistance, while dark red lines mark very strong support/resistance.here. Regarding the horizontal lines, black lines represent strong support/resistance, while dark red lines mark very strong support/resistance.

Elliott Wave count are meant to provide context. There is a pattern unfolding in real-time, one of which will play out. By monitoring price levels that are held/broken, it will help us figure out which one is in play

Big Picture

Below is a weekly chart for the S&P 500, so each bar represents one full week of price action. From this larger perspective, there are three general paths that we are tracking.

  • Blue – The bull market that began at the COVID low completed in early 2022. What has followed has been the start of a secular bear market with one more leg lower. This would make the current bull market a cyclical bull uptrend, within a secular bear downtrend.
  • Green – This is a variation of the Blue count above. This count has us making one more swing higher in a larger B wave.
  • Red – The 2022 bear market was a large correction in an on-going uptrend that started at the COVID low. This pattern would have us around the halfway point in the final 5th wave, which should take us to new highs into 2024.

Where we are now is determining whether this correction is the start of something much worse than most expect (blue), or an excellent buying opportunity (red, green). There are two determining criteria I am looking out for in order to position our portfolio correctly:

  • Is the structure of this drop a 5-wave pattern or a 3-wave pattern? A 5-wave pattern will be more vertical and direct in nature. If so, it will support our blue count. If it is a 3-wave pattern, it will have many overlaps and appear to be quite messy. If this manifests, it will support our red or green counts.
  • Will the drop hold our critical support at 4315-4275? If we break below this pivot, it will strongly support our blue count. On the other hand, if we are in a minor correction within a larger uptrend to new highs, this level needs to hold.

It is worth pointing out that the likely catalyst for the expected top is the start of a recession. The green count coincides with a Q4 recession, while the red count coincides with a Q1 recession. Based on current economic data, as well as inflation data, the odds of a Q3 recession are quite low. So, if the blue count is in play, it will have to be the result of broad market price action picking up on an unforeseen event.

Planning for an unknown event is not an investable strategy, as they are rare. However, the vast majority of events occur within a rising rate environment, which does increase the odds that one could happen. In almost all instances, if we go back in time, broad market price action gave advanced warnings of something brewing. For this reason, we put an outsized weighting on price patterns to help manage risk within the current macro environment.

5 or 3 Waves?

We are looking for early clues to help us get in front of either the start of a new leg in the secular bear market (blue count), or a buying opportunity on our way towards 4800 SPX (red, green counts). The blue count will unfold in a 5-wave pattern, while the red/green counts will unfold into a 3-wave pattern.

It’s important to understand that these patterns are fractal in nature. So, a small 5-wave pattern develops into a larger one and then a larger one. This happens until the pattern runs its course, and a counter rally unfolds. So, when at major inflection points, analyzing the micro pattern off of the high will give us an early warning on what to expect.

If we look at the micro structure off the recent high, we do have what can be counted as a 5-wave pattern from the high. This keeps our blue count alive, and is worth watching closely.

In order to confirm this scenario, there are three things that I look for that tilts the probabilities towards a near certainty: 1) do we have what can be counted as a 5-wave drop from a high? The answer to this question is, yes; 2) has the 5-wave pattern developed into a larger 5-wave pattern? This has not happened yet. This will take time; 3) After we get two degrees of 5-wave patterns pointing down, do we have a 3-wave retrace? The answer here is also, not yet.

So, patience is crucial right here. All counts that I am tracking suggest that after a bounce, we should see another low, at minimum. The nature of this bounce, as you’ll see below, will help determine the actions we will take in the coming weeks.

Supporting Markets

It’s important to see what other markets are telling us at this critical juncture. They often provide early warnings and clues on what is unfolding.

NASDAQ-100 (NDX)

NDX topped nearly two weeks before the S&P 500. This has been a consistent pattern for most of the year – NDX leading the market. Because of this reason, I expect it to lead either into a buyable low (green) or into a bigger breakdown (blue).

This chart has similar counts as the S&P 500 above. It’s worth noting that the structure of NDX does not suggest a push into Q1 of 2023 (SPX red count). For this reason, I’m only charting the blue and green counts within NDX. What the green count has going for it is that we only have a 3-wave drop from the high. This suggests, so far, that what is unfolding in the broader market is setting up for a buyable low.

Apple (AAPL)

We were warning our members about Apple going into earnings. From a technical perspective, Apple’s long-term chart was at a significant resistance level. If we place a Gann Fan at the 2003 low, which is just a sequence of important angles that stock prices tend to respect, the red 1×1 line is the most important angle to monitor. This angle is a true 45 degree angle, at which, big reactions tend to happen. Note the last time that Apple’s price touched this angle from the 2003 low. It marked the 2022 top. Interestingly, AAPL was testing this angle again going into earnings.

Further warning could be seen in AAPL’s forward valuations. Going into earnings, not only was AAPL’s price at a significant angle, as shown above, but its forward Price to Sales was trading above the 2022 high.

Apple is the largest stock in both the NASDAQ-100 and in the S&P 500. The direction it goes, so goes the market. For this reason, we put an outsized amount of analysis into this stock. We are not surprised by the market’s reaction to AAPL’s earnings. Now, we’ll address the most important question – is this the start of a significant top, or is it a pitstop on its way to fresh highs?

In the chart below, I have two general counts that we are tracking based on the current price information:

  • Blue – This count suggests that we are ending a large rally in an on-going bear market. Regardless, the structure of the next leg lower would have to be a 5-wave pattern, and ultimately break below the $154 critical support. If this happens, we will retest the January lows, at minimum.
  • Red – This count suggests that we are in a correction within a larger uptrend, which would ultimately take us to new highs. The key indicator of this scenario playing out would be a 3-wave drop that holds the $154 level. If this happens, Apple, and the market, would be providing an excellent buying opportunity.

Also worth pointing out, note the gap down on heavy volume. Gaps are important markers in a trend. More times than not, they tend to start counter moves, which is why this needs to be watched so closely. Reclaiming this gap will be challenging, and supports the blue count while it remains open. 

However, if we zoom in on the structure of the recent drop, as bearish as the current drop looks, we only have a 3-wave drop, so far.

For this pattern to morph into a 5-wave pattern, and therefore provide early warning of a bigger drop developing, we need the coming bounce to hold the $184-$186 resistance, then turn down to make one more low. This will provide us with a clean 5-wave drop from the high.

On the other hand, if the coming bounce breaks above $186, the odds will start favoring the red count, and setting up a great buying opportunity on the next drop. 

Anything can happen, but it’s worth pointing out the probabilities strongly favor any coming bounce will eventually get sold to make at least one more low. If this bounce does break above $186, then the drop that follows is a buyable event, from our analysis.

Small Caps (IWM)

We’ve been tracking IWM for a while. It has completed what looks to be a large degree triangle pattern. These are common patterns in B waves, which is what I believe is going on. If IWM can break below $179, then we have confirmation that a large degree C wave is unfolding to new lows. This will be a large tell for the rest of the market, so a close eye should be kept on this index, for now.

Like the stocks indexes above, the setup is there for a large decline, but we do not have the follow through, yet. IWM has only given us a messy drop, which can’t definitively be counted as a 5-wave move.  In short, we are not seeing the required follow through to make the above blue count a high probability.

In conclusion, the odds favor that this correction is not over. Even if we are in the red/green counts, I’d expect another leg lower after we see a sizable bounce. We should, at minimum, see another drop lower. Whether this is a buyable dip or start of a new leg lower is yet to be seen. If we are starting a fresh move lower, it will show up in the markets discussed above. The current 3-wave patterns will morph into 5-wave patterns, providing an advanced warning. Until then, we will need to see what develops before shifting into cash raising mode, or stock buying mode.

Macro

The economic data that continues to roll out supports a resilient US economy that is not moving into an immanent recession. This is happening while inflation data continues to decelerate and surprise to the downside. This has put us in the Big-Growth Quadrant over the last couple of months, which tends to support high beta/risk-on assets.

Though the recent top-down economic environment has been supportive of risk-on assets, we do not believe this trend will continue within the economy moving into 2024. Rate hikes take time to filter into economic activity. The speed at which rates were raised in 2022, we believe, can provide a false sense of security. For this reason, it is likely that growth continues to slow into a recession.

This is not happening now and the likely timing for a recession, based on the historic lag between a yield curve inversion and the start of a recession, puts us into mid Q4 – late Q1. Though the growth we are seeing is not characteristic of early stage bull markets, and continues to drift lower, it is simply not the type of data we see with an immanent recession on the horizon.

The chart below supports this, as the job market continues to accelerate, along with heavy truck sales, home prices and retail sales. According to the economic trends we are seeing, there is simply no evidence of a recession brewing in Q3 of this year.

However, what the market may not be pricing in, and could cause a roadblock in the near future, is the theme we continue to repeat – with stubborn growth will come stubborn inflation.

This is an important theme because equities are rallying under the assumption that the FED has dealt with inflation, and can therefore pause and even lower rates sooner than most think. So, if inflation starts surprising to the upside again, this will throw a wrench into this assumption, and force equities to reprice a new FED time line.

The inflation data in the same chart above breaks down the disinflation the market is celebrating in the headline CPI numbers. The question is – will this trend continue, and further support the bull market?  What becomes clear when you look at the pattern is: 1) Core inflation remains sticky, and still notably above the FED’s target 2% target; 2) the reason for the CPI data’s deceleration is because of energy prices. We just saw crude oil go through a +1.5 year bear market that appears to be stabilizing. I do not believe energy commodities will be able to support further CPI readings into the future.

Crude Oil

Crude is not only working on its first higher high in over a 1.5 year time frame, but it is also working on a developing 5-wave pattern off the low. If this bounce can hold the $76.30 support and then turn towards $89, then the next few months could put pressure on equities as oil continues higher.

Gasoline

Gas prices are one of the most significant elements within an inflationary environment. The reason is because it is so closely followed by all consumers. You can’t drive more than a few miles without seeing gas prices advertised on the road. Because of this, they have a strong psychological effect on the consumer’s behavior.

The below chart is not encouraging. We have an incomplete 5-wave pattern in play, which suggests one more push to new highs before completing. Furthermore, note the inverse head and shoulders pattern developing below the $2.8-$3 pivot. If price breaks above the $3 pivot, we should see a sharp rise that will only put pressure on future CPI readings, as well as equities. 

So, with energy not able to do the lion’s share of the deceleration within the CPI data, this leaves core inflation to pick up the slack. As stated, many times before, we’ve never seen an instance going back to the 1940s where core inflation got out of control and went down without the help of a recession. So, in order for this to be the case, it will literally be the first instance in modern market data.

Furthermore, with the consumer sentiment hitting a 20 month high, real disposable income staying positive for over a year, and employment compensation accelerating to a 9 month high, it is unlikely that the consumer will slow spending on discretionary items.

In conclusion, the economic data does not support an imminent recession, and suggests a continuation of the current rally. However, the primary risks are: 1) a cavalier attitude towards the on-going rate hike campaign and the damage it will eventually cause in the economy; 2) the increased odds that the ongoing rate hikes will trigger an unforeseen event; 3) the likely return of upward inflation surprises while growth trend slow down.

Sentiment

Regarding market sentiment, we are seeing some of the most bullish readings that we have seen since late 2021. Within recent AAII investor sentiment reports, we’re coming off of bullish readings that have been in the 90th percentile of all readings. The NAAIM survey, which measures fund managers’ exposure to equities had a reading in the 97th percentile in late July. The reading was 101.82, meaning that the fund managers surveyed were 101% exposed to equities. In other words, they are levered into equities, which is usually not a good sign for equities. 

I/O Fund Portfolio

We have been patiently waiting for the current pullback to get a better idea of how to deploy some of our cash, if at all. As of now, we are a highly concentrated portfolio for a few reasons: 1) the current list of stocks that we own are the only ones that we can find that fit our criteria; 2) we have stopped out of other positions, and have not found any alternative options. As a result, our cash positions continue to build, which we believe will offset our portfolio concentration.

Advanced Micro Devices (AMD)Advanced Micro Devices (AMD)

AMD is at the same important juncture as most stocks. Is this the start of a significant bearish leg, or a pitstop on its way to at least one more high? It’s worth noting that the 2nd largest trade in AMD’s history came around the $108 level a few weeks back. Considering that this occurred around a relative low, I’m inclined to think this is a buy. If this is true, this level will be defended and likely not break to the downside for any significant period. So, I’d be concerned if we see a sizable break below this level for an extended period.

This also lines up with the price analysis. So far, the drop appears to be a 3-wave, messy drop, which suggests a correction in a larger uptrend. If we do drop to the $100 level, it needs to get bought up quickly, and push us back above $108 to confirm this. If we stay around $100, and drift lower, it suggests the large trade was a sell, and will firmly support the blue count.

Nvidia (NVDA)Nvidia (NVDA)

As long as NVDA stays above $340 on any further weakness, the green count remains my primary. This supports the green count in the broader market, suggesting another push higher into the fall/early winter. Furthermore, the drop from the recent high looks to be corrective – 3 waves. We will want to see a 5-wave rally off of this low – or a future low above $340 – to support the next swing to new highs.

It's also worth noting that NVDA is trending down into a time factor, which tends to mark the end of a swing. It’s doing so with the downward momentum at a rare extreme. This, at minimum, leads to a notable bounce.

Aehr Test Systems (AEHR)Aehr Test Systems (AEHR)

AEHR appears to have another swing higher in it. The question is – do we see a notable correction back into the $30s before a bigger push higher? This is yet to be seen, and as long as we hold $41.60, I’m leaning into the blue count, which suggests a low and fresh high soon. Below $41.60 and the odds start favoring the green count, which has a buy target in the mid-$30s.

Bitcoin (BTCUSD)Bitcoin (BTCUSD)

Bitcoin continues to consolidate at its highs. It ignored the large run-up in equities and is now ignoring the drawdown. The setup in place is one of the more bullish setups I look for. We have two sets of 1st waves followed by 2nd waves. What should follow is a large 3rd wave breakout. This remains my primary count as long as $20,000 holds.

Microsoft (MSFT)Microsoft (MSFT)

The daily RSI is below the bull market support zone. This supports any bounce in MSFT should be sold, with at least one more low to come. The critical support is $280 for the green count and holding this is critical for any chance at one more high. 

Ethereum (ETHUSD)Ethereum (ETHUSD)

ETHUSD has the same setup present as Bitcoin. We must hold $1,450 for this setup to remain active. If it is confirmed, like Bitcoin, the next move higher should be sharp.

Marvell (MRVL)Marvell (MRVL)

MRVL very clearly looks like an incomplete 5-wave pattern up. This would put us in wave 4, which is still playing out.  Look at the current correction. It appears to be a very standard flat pattern and looking for the final swing in the c wave. If this happens, we’ll take that buy. MRVL needs to hold $53 for this next swing higher to manifest.

Netflix (NFLX)Netflix (NFLX)

Looks like NFLX has a high probability of moving down into the $380s. If that next drop breaks below $376, then the Blue count will be my primary, and we will start setting up downside buy zones. If it can hold $376, then I’d expect another high.

Super Micro (SMCI)Super Micro (SMCI)

We were sounding the alarm bells on SMCI weeks before their earnings call. It was trending higher on weaker momentum, into very strong resistance and into a cycle cluster.

If we zoom into SMCI’s pattern off the high, it is a clear 5-wave drop. I’m willing to bet this is a zig-zag corrective pattern (5 waves down, 3 up, 5 waves down). These types of corrections tend to be quick and intense. It’s as if the stock is trying to get the correction over with quickly so it can get back to the larger trend. If this is true, we should see a slight retrace followed by another swing higher into the $283-$295 region. If this bounce breaks above $314, something else is likely going on.

Google (GOOGL)Google (GOOGL)

GOOGL is interesting. It looks like it needs one more swing higher to complete the entire pattern off of the January low. If this is true, how we retrace from that high will be very important – 5-waves down is bad, 3-waves will setup a buying opportunity.

Taiwan Semiconductor (TSM)Taiwan Semiconductor (TSM)

TSM is another interesting chart that leans towards the blue count. I was looking for another swing, but we broke below the gap on the recent move higher. The only other bull count I see suggests two more large swings higher, while the rest of tech suggests only one more. This makes me think the high is in for TSM. If we get below $90.50, it will be strong evidence that the larger C wave to new lows is gaining ground. This is one to watch closely.

Tesla (TSLA)Tesla (TSLA)

Like most stocks, the next bounce will determine a lot. If it is a 5-wave bounce, we can easily make it to one more fresh high (green). Above $272.85 and this will be my primary count. Below this level, and we will be looking down.

Chainlink (LINKUSD)Chainlink (LINKUSD)

The only hope for the low being in is if this move off the low is a diagonal. So, we must get above $8.5 to complete the 5 waves up, then get a 3 wave retrace for confirmation. If we fail to get above $8.5, and instead break below $6, then $3.5 is our next target to accumulate.

Recommended Readings:

  • Broad Market Webinar Replay – August 10, 2023
  • Super Micro Q4 Earnings: Half of Revenue is from AI
  • SuperMicro Pre-ER Fiscal Q4: Momentum Continues
  • AMD Q2 Earnings: ETA for AI Ramp is Q4 & 2024
  • July Positions Report
  • Q3 Earnings Kickoff Webinar
Posted in Broad Market Today, Market UpdatesLeave a Comment on August Positions Report

Super Micro Q4 Earnings: Half of Revenue is from AI

Posted on August 9, 2023June 30, 2026 by io-fund

Here we are in 2023, spoiled by the best Nasdaq performance in the history of the index. 2022 seems like a distant memory. Well, Super Micro’s earnings are here to remind us that stocks do not go up forever, even on a nearly perfect earnings report.

I will take this opportunity to make a plug for technical analysis, as Super Micro due for a pullback from some time, per Knox’s Positions Report here. There is very little in the fundamentals that would directly cause a selloff, and so the information below is going to frustrate anyone who thinks only fundamentals drives stock prices.

Super Micro beat on all accounts, and also raised full year guidance. Cash flow was negative this quarter but likely to be temporary. I’ve included some notes on this below.

We had written going into the earnings report that Super Micro had pre-announced Q4, and it was a sizable beat:

Today, the company has taken this further and raised FY2024 guidance considerably from $8.61 billion expected to $10 billion at the midpoint. Rough math of a 17% gross margin and a 9% net margin gets us comfortably above the $14.73 EPS expected for FY2024, as well, in the $16.00 adjusted EPS to $17.00 GAAP EPS range.

Management did a good job on the call discussing what would cause them to raise the guidance even more for FY2024. The brief answer is they will raise again if they can obtain key components from the supply chain. I detail this for you below.

Scorecard:

The current fiscal Q4 results are bolded for easy reference. Percentages are YoY unless stated otherwise.

Revenue and EPS:

  • SMCI Management raised Q4FY23 revenue guidance to $2.15B-2.18B from previous guidance of $1.7B to $1.9B, vs consensus of $1.96B. Today, the company reported $2.18 billion for growth of 34% YoY and 70% QoQ.
  • Q4 GAAP eps guidance raised to $3.25 to $3.35 from $2.13-$2.65. The company reported $3.43 GAAP EPS.
  • Non-GAAP guidance raised to between $3.35 to $3.45 from $2.21 to $2.71 vs consensus of $2.88. The company reported adjusted EPS of $3.51 for growth of 34% YoY.
  • Q1FY24 consensus eps of $3.19. The company guided for $2.75 to $3.50 EPS, so this is technically a slight miss at the midpoint of $3.13 EPS but the guide is still within range.
  • FY24 consensus eps of $14.51 and revenue of $8.47B. The company raised full year guidance to $9.5 billion to $10.5 billion, or $10B at the midpoint. This implies a comfortable beat on the bottom line with the current margin profile.

Margins:

  • Current gross Margin of 17% versus Q323 gross margin of 17.6% and 18.7% in Q223
    undefined
  • Current operating margin of 10.60% versus Q323 opm of 7.7% and 11.9% in Q223.
  • Current net margin of 8.9% compared to 6.7% last quarter and 9.8% in Q2

Cash Flow:

This quarter, the operating cash flow was (-$9) million and free cash flow was (-$17) million for a 0% margin. This compares to $198m in op cash flow and $190m in free cash flow last quarter with margins of 15.5% and 14.8%, respectively. In Q2, the margins were 8.9% and 8.4%, respectively.

The cash flow was also negative in Q4 of last year. Management stated the following regarding the negative FCF: “Cash flow used in operations for Q4 was $9 million compared to cash flow generated by operations of $198 million in Q3 due to higher accounts receivable, offset by lower inventory and higher accounts payable from backend loaded shipments in the quarter due to supply constraints.” 

The company has $440 million in cash and $290 million in debt for a net cash position of $150 million, down from $176 million. Per management: “we utilized our bank lines of credit to support higher revenues and accounts receivable as we ramped up production of new AI/GPU design wins.”

Here was a question on the call, which seemed to relay that cash flow would be similar to previous levels: 

Jon Tanwanteng

Hi, thanks for the follow up. Dave, I was wondering if you could talk about your working capital needs in the sort of environment. Can you generate positive cash flow going forward? Are you going to be using cash as you as you try to fulfill this OpEx demand? 

David Weigand 

Yeah, John. We see the business generating good cash flows, as it has historically. And we think that the — especially in this constrained supply market, where we could deliver more if we had more supply. But we're so really, the constrained supply ends up moderating the working capital. And so we grew our business last quarter quite a bit and grew our ARR. So that utilized a lot of working capital, but we have no concerns about working capital.

Key Metrics:

52% of Super Micro’s revenue is driven by AI-related designs. Compare that to many AI bubble stocks that do not have any AI revenue yet.

To help illustrate what that has done for Super Micro, analysts raised FY 2025 expectations from 11% revenue growth to 71% revenue growth over the past three months. That is a considerable jump thanks to it’s here-and-now AI exposure.

The OEM appliance and large data center revenue of $1.17 billion grew 59% year-over-year and 94% QoQ. The boom in AI-related data center sales helped to push this segment to over 100% growth in FY2023.

The Enterprise and channel vertical, which also includes AI/ML revenue, was up 19% year-over-year and 51% QoQ to $976 million.

Earnings Call:

Supply is the Primary Headwind; Not Demand:

When management raised guidance, this is what the CEO stated: “However, given the record high backlog, we see fiscal year 2024 revenue between $9.5 billion to $10.5 billion with room to deliver more depending on availability of supply.”

Basically, Nvidia’s chips are so popular that Super Micro is competing with many others for a very limited supply of these chips. Super Micro has a strong relationship with Nvidia and the company is not bashful about making it known. Here is what was stated in the opening remarks: “Couple of months ago, I was honored to have my close friend, NVIDIA CEO Jensen Huang, join me on stage at Computex to highlight our optimized new generation GPU solutions for this AI era” along with a list of Nvidia-powered systems that Super Micro supports. 

In our pre-earnings write-up, we had stated: “The bulk of SMCI’s growth will depend on supply chain, which we outlined in our recent analysis. The demand is there, can the company meet the demand or are the key component supply shortages going to keep the company’s growth in line for now? Clearly, the pre-announcement is a good sign that the supply chain is not getting in the way too much, however, this remains the top concern for SMCI's near-term growth. Per our analysis, lead times are at 26 weeks compared to a 10-14 week target. This is an improvement from 40 weeks. Read more here.”

Here was the first question regarding the supply:

Ananda Baruah:

“[…] And so I guess the first question is, is what's the opportunity do you see to maybe even do teach stronger than the fiscal '24 guidance. I guess, what would be the puts and takes there? And, if you were to be able to exceed the 2024 guidance, what would be some of the things you think would need to occur?”

Charles Liang

“[..] And for sure, they need 10 times 20 time more system. And we just cannot ship at this moment, because of supply chain […] So I mean, we are on the right track, yes expecting supply chain can improve so that we can grow our revenue.”

Can the Company Keep Growing …

As if a beat in Q4 and a raise for FY2024 isn’t good enough, analysts on the call wanted to know what the possibility is that Super Micro continues to beat and raise. It was helpful that the CEO stated, “With LLM large language model and other AI applications booming, I now expect the $20 billion annual revenue target to be just a couple of years away.”

Here was a question from an analyst on that note:

Ananda Baruah

That's really helpful. And so, Charles, just to make sure that I understood that accurately, is that to say, if the supply chain — so if you can, if you can get more from the supply chain, actually use it to say this way you have order visibility, such that if you can procure more, you would have the ability to share gains, exceed the fiscal '24 range that you provide is a really supply chain issue, I guess, is what I'm asking. Did I hear that accurately?

Charles Liang

Yeah, absolutely […]

This was also stated at the very end by the CEO:

“Charles Liang

And even a supply condition, I believe we can surpass $10.5 million for sure easily.”

Conclusion

On the Microsoft post-earnings report, I had stated “Let’s be real, the Nasdaq has rallied more than it has in its 52-year history off fairly unimpressive top line growth in the tech industry and minimal to no earnings growth. Although fellow growth investors have greatly benefited, we shouldn’t be surprised if the buying is exhausted at the moment.”

Per a recent Zack’s report (behind a paywall): “For the Tech sector, we now have Q2 results for 41.2% of the sector’s total market capitalization in the index. Total earnings for these companies are down -0.4% on +2.1% higher revenues, with 94.7% beating EPS estimates and 73.7% beating revenue estimates.”

This is not enough growth to sustain the rally we have seen.

Of the tech earnings results this year, Super Micro is a rare gem that has materially grown both top line and bottom line in a big wayin a big way. But, to be fair, the stock has been rewarded and is up considerably this year. Tech investing is not linear, and so what we have is a solid earnings report that is being sold off as buyers are drying up and/or investors are taking gains.

From my perspective, this is a great report and stands out from the weakness we are seeing in many earnings reports. Our plan is to buy on any weakness using technical analysis, so you can look for those trade alerts when the stock hits our buy zone.

 Recommended Readings:

  • SuperMicro Pre-ER Fiscal Q4: Momentum Continues
  • AMD Q2 Earnings: ETA for AI Ramp is Q4 & 2024
  • Microsoft FYQ4: Cooling Off Before AI Heats Up
  • Super Micro: Sandwiched In The AI Trend
Posted in AI Stocks, SemiconductorsLeave a Comment on Super Micro Q4 Earnings: Half of Revenue is from AI

SuperMicro Pre-ER Fiscal Q4: Momentum Continues

Posted on August 8, 2023June 30, 2026 by io-fund

We recently did a SMCI deep dive here.  We expect SMCI to benefit from the AI trend due to its position between hyperscalers and major chip design companies. 

Our investment thesis is playing out as SMCI recently revised up its Q4FY23 guidance which was better than expectedQ4FY23 guidance which was better than expected. So we will listen to the drivers behind this upward revision and whether it will carry through to FY24 and its potential impact on FY2024 consensus earnings estimates. 

Revenue and EPS:

  • SMCI Management raised Q4FY23 revenue guidance to $2.15B-2.18B from previous guidance of $1.7B to $1.9B, vs consensus of $1.96B
  • Q4 GAAP eps guidance raised to $3.25 to $3.35 from $2.13-$2.65
  • Non-GAAP guidance raised to between $3.35 to $3.45 from $2.21 to $2.71 vs consensus of $2.88
  • Q1FY24 consensus eps of $3.19, FY24 consensus eps of $14.51 and revenue of $8.47B

Margins:

  • Q323 gross margin was 17.6%  vs  18.7% in Q223  
  • Adj Q323 gross margin was 17.7%  vs 18.8% in Q223
  • Q323 opm was 7.7% vs 52 % in 11.9% in Q223.
  • Adj Q323 gross margin was 8.7% vs 12.8% in Q223 

Cash Flow:

  • In Q323, SMCI posted $198m in op cash flow and $190m in free cash flow. Margins were 15.5% and 14.8%, respectively.
  • In Q223, SMCI posted $161m in op cash flow and $151m in free cash flow. Margins were 8.9% and 8.4%, respectively. 
  • $363m in cash and $187m in debt. 

What we are watching for:

  • The bulk of SMCI’s growth will depend on supply chain, which we outlined in our recent analysis. The demand is there, can the company meet the demand or are the key component supply shortages going to keep the company’s growth in line for now? Clearly, the pre-announcement is a good sign that the supply chain is not getting in the way too much, however, this remains the top concern for SMCI's near-term growth. Per our analysis, lead times are at 26 weeks compared to a 10-14 week target. This is an improvement from 40 weeks. Read more here.
  • Discussions around their 10%+ customer Meta and the other unnamed 10% customer increasing orders (ideally) and/or any other new customer wins that can be named or quantified
  • Comments on the partnership with Nvidia, per our write-up: “Supermicro is closely partnered with Nvidia on the H100 GPU rollout with air flow designs that reduce fan speeds, lower power consumption, lower noise levels and lower the total cost of ownership.”
  • Discussions on other partnerships, such as AMD and Intel.
  • FY2024 consensus eps estimate is $14.51. There was a miss last quarter on EPS, which management stated: “The shortfall was primarily due to key new component shortages for Supermicro’s new generation server platforms which have been mostly resolved to-date.” We will look for this EPS to stand and will evaluate if there can be a beat in the future.
  • We will assess if SMCI is taking more market share, and if so, how much market share?
  • We will listen for and note any discussions on the margins (this was also detailed in our most recent writeup in the conclusion).


What analysts are watching for:

Loop Capital analyst Ananda Baruah raised the firm's price target on Super Micro Computer to $400 from $325 and keeps a Buy rating on the shares ahead of its Q2 results tomorrow. Having positively pre-announced Q4 earnings last month, the company's commentary will provide the "latest rungs on the ladder" to achieving long-term EPS of $20.00 

Rosenblatt analyst Hans Mosesmann raised the firm's price target on Super Micro Computer (SMCI) to $375 from $300 and keeps a Buy rating on the shares after the company pre-announced "record" bookings. The market is "set to be on its heels for several quarters" and the firm sees Super Micro capturing incremental AI supply as a premier enterprise partner to Nvidia (NVDA) and its Hopper ramp, the analyst tells investors. 

Wedbush analyst Matt Bryson notes that Supermicro updated its Q4 outlook, with revenues now expected to come in at $2.15B-$2.18B, vs. the original guidance range of $1.7B-$1.9B and consensus at $1.8B. EPS is now expected to be about $3.35-$3.45, compared to the previously provided range of $2.21-$2.71. As part of the release, management signaled that order rates and design activity remain at record levels driving rapid backlog growth, the firm adds. While Wedbush doesn't see any near-term risk to Supermicro results, the firm is retaining its more cautious stance and Underperform rating on the name with a price target of $65.

The I/O Fund Analyst Team contributed to this analysis

Recommended Readings:

  • AMD Q2 Earnings: ETA for AI Ramp is Q4 & 2024
  • AMD is Ready to Rival on AI Acceleration
  • Microsoft FYQ4: Cooling Off Before AI Heats Up
  • Tesla Q2 2023 Earnings – It’s About Margins
  • Super Micro: Sandwiched In The AI Trend
Posted in AI Stocks, SemiconductorsLeave a Comment on SuperMicro Pre-ER Fiscal Q4: Momentum Continues

This Next AI Trend Could be Worth Trillions

Posted on August 4, 2023June 30, 2026 by io-fund
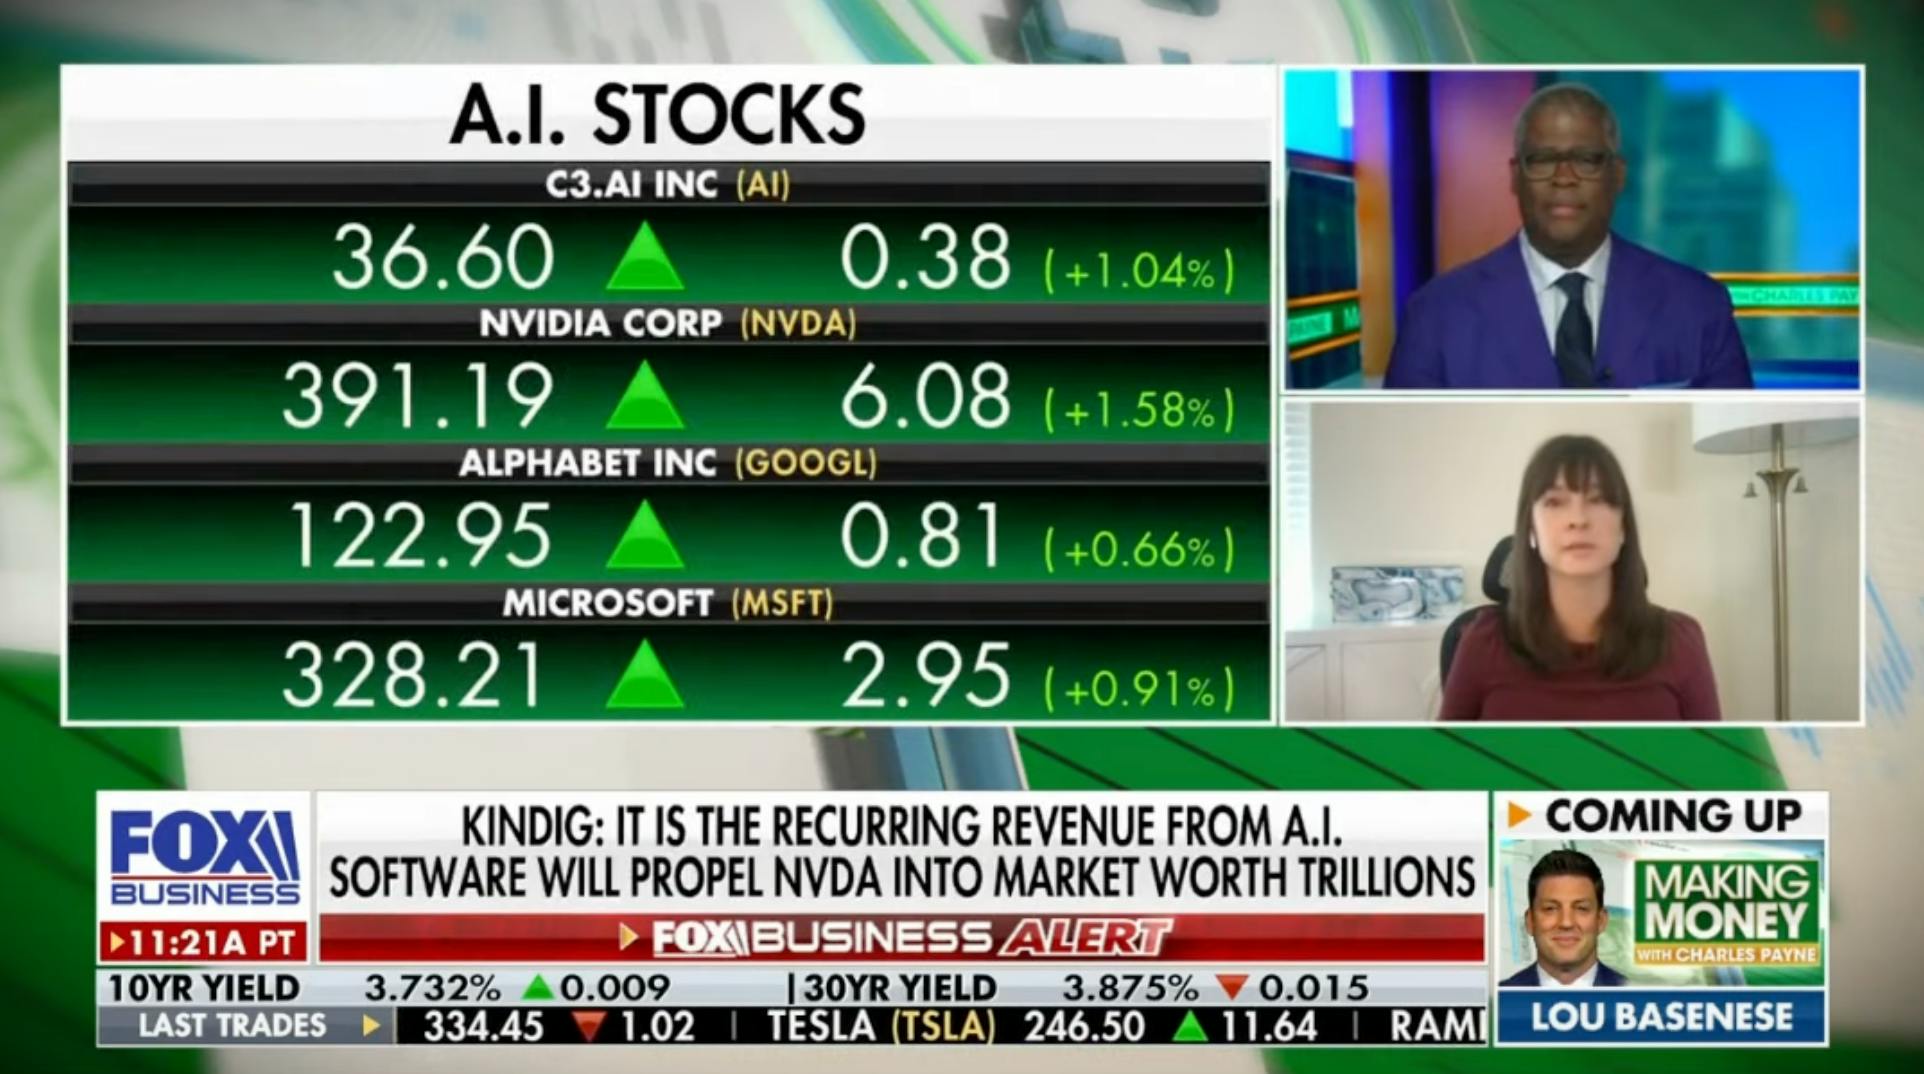
This Next AI Trend Could be Worth Trillions

In the clip below, Beth Kindig discusses how AI will drive stock market caps well into the trillions of dollars.

Disclaimer: This is not financial advice. Please consult with your financial advisor in regards to any stocks you buy.

Recommended Readings:

  • Semiconductor Stocks: Q2 Sector Overview
  • Tesla Q2 Earnings – It’s About Margins
  • Beth Kindig Discusses AI Stocks with Tier 1 Media
  • Where Nvidia’s Stock Price Will Go Next
Posted in Ai Platforms, AI StocksLeave a Comment on This Next AI Trend Could be Worth Trillions

AMD Q2 Earnings: ETA for AI Ramp is Q4 & 2024

Posted on August 2, 2023June 30, 2026 by io-fund

AMD has been referencing a ramp for the data center in H2. Given that Q3 revenue growth is below expectations, this would imply that Q4 will have to really deliver.

AMD’s management reiterated “we do have that confidence” that there will be an “aggressive ramp in Q4 and 2024.” This was not the only statement on the topic, rather the quote we provided to premium members where management confirmed “50% year-over-year growth in the second half” was by and far the main focus of the call.

Notably, a large portion of the sales in Q4 will come from the El Capitan supercomputer, a highly anticipated launch that we discussed recently in our AMD Deep Dive.

The analysts that dug into the “50% year-over-year growth in second half” comment were trying to ascertain the following:

  • Is the 50% still valid despite the Q3 miss? If so, this implies +$700 million sequential revenue for Q4
  • Of this roughly $700 million for Q4, what’s the product mix between EPYC processors and MI300 GPUs
  • If El Capitan contributes “several hundred million” for Q4 then when will Tier 1 hyperscalers begin to drive sales for MI300 GPUs

In addition to these questions, which we outline below, the pertinent Q&A was on how much of a slowdown AMD is seeing for general purpose CPUs (Gen 3) as hyperscalers and the enterprise go through an optimization period. Here is what was specifically stated: “In the datacenter market, we see a mixed environment as AI deployments are expanding. However, cloud customers continue optimizing their datacenter compute and enterprise customers remain cautious with new deployments. Against this backdrop, we expect strong growth driven by higher fourth gen EPYC and Ryzen 7000 processor sales and initial shipments of our Instinct MI300 accelerators in the fourth quarter.”

Regarding Bergamo and Genoa-X specifically, management stated that Microsoft Azure is seeing “5X higher performance in technical computing workloads compared to their prior generation” and that Bergamo is delivering “more than double the performance than competitive offerings for cloud-native applications, while offering full x86 software compatibility.” As a reminder, Gen 4 CPUs went into production this quarter.

The MI300s will ship in Q4 with the competitive edge of more memory bandwidth and memory storage. This is ideal for the inference phase, which is used heavily by large language models. We detailed the MI300s in our deep dive here.

On the Client side, AMD has officially bottomed (barring any new, unforeseen circumstances). Management stated that “client segment will grow in the seasonally stronger second half of the year” including a launch of a dedicated AI engine for the mobile 7040 Ryzen CPUs. When discussing AMD’s AI opportunity, it is vitally important that we not lose sight of the opportunity AMD will have to expand its AI portfolio to the Client Segment. Hybrid AI architectures are coming (which means AI is going to go beyond the data center and expand toward the edge), and AMD will be at the forefront. As long as dollar content per chip is higher (which it will be), then AMD will benefit nicely in the next replacement cycle (and beyond). That is a record for parentheses in a paragraph!

For gaming, AMD has yet to bottom. The embedded segment will be weaker than usual over the next two quarters. This segment has been unusually strong post-Xilinx acquisition but is coming up on sky-high comps, so will be cooling off in the medium-term. Due to the M&A with Xilinx, AMD was posting 1,000% to 2,000% growth in the 2022 quarters.

Scorecard

All numbers for current quarter and YoY unless otherwise stated

Overall, everything was in line except the forward guide for Q3 was a miss. This is important because it means the pressure is on Q4 to deliver the H2 growth management had referenced in the prior Q1 earnings call. 

In addition to this, we want to see margins rebound quickly after Client and Gaming stabilize. In the past, the CFO has stated that the margins will return to normal when these two segments return to normal. The gross margin of 51% is in good shape but the operating margin of 0% is below AMD’s GAAP operating margin of 20% to 25% in the boom years of 2020/2021. Net margin of 0% compares the net margin of 15% to 20% in the boom years.

Although a tad vague, the CFO stated the following when pressed about the margins: “The model we leverage to generate profitability, we should be able to get back to 20%.”

EPS & Revenue:

EPS: Consensus estimates $0.57 versus $0.58 reported (in line)
Revenue: Mgmt midpoint guidance of $5.3B (-19% YoY) versus $5.4 billion reported for (-17%) growth (in line)
Next quarter revenue consensus of $5.85B versus $5.7B reported (miss)

Group sales by division (a reference guide of what was reported the last two quarters)

Data centers – $1.3B Q1 vs $1.3B in the current quarter (flat QoQ, down 13% YoY)
Client segment – $739m Q1 vs. $998 million in the current quarter (up 35% QoQ, down 54% YoY)
Gaming – $1.8B Q1 vs $1.6B in the current quarter (down 10% QoQ, down 4% YoY)
Embedded – $1.6B in Q1 vs $1.5B in current quarter (up 16% YoY, down 7% QoQ)

Gross Margins based on midpoint 

Mgmt adj guidance of 51% versus 51% GM reported (in line)
Mgmt adj $ guidance of $2.65B versus $2.665B reported (in line) 

Operating Margins based on midpoint 

GAAP operating margin of (-3%) last quarter versus 0% GAAP OM this quarter for (-$20M) in losses
Adjusted operating margin guidance of 19.8% vs versus 20% reported (in line) for $1.068B in profit

Cash flow + Cash 

Last quarter operating and free cash flow was $486M and $328M for a margin of 9% and 6%, respectively. This quarter, operating cash flow was $379M and $254M for a margin of 7% and 4.7%.

Earnings Q&A

As stated in the intro, there were many questions about the 50% growth in the second half comment from Q1. Here were a few of the more important discussions.

Matt Ramsay 

“Last quarter, you had given us some metrics around potentially being able to grow your datacenter business by 50% in the second-half of the year versus the first-half. And maybe you could give us a little bit of an update on how you're thinking about that milestone and the drivers of growth across CPU and accelerator for the back-half? Thanks.”

Lisa Su

“And we are still looking at a zip code of, let's call it, 50% plus or minus second-half to first-half. So, it's a big ramp, but when we look at all the components, I think that the customer pull is certainly there. And it's exciting to be in this part of the industry.”

When asked again about Q4, and whether the company has the supply to meet the demand, the CFO stated: “We feel that we have ample supply for an aggressive ramp in the fourth quarter and into 2024. But this is certainly one of the areas that we spent quite a bit of time to ensure that we do have that confidence.”

As stated in our AMD deep dive, El Capitan launches in November. Per management, this will contribute “several hundred million” in revenue for Q4. Of the obstacles that AMD must overcome, our analysis made it quite clear it was the software part of the equation that AMD must solve.

Per management: “There is a sort of large, call it, lumpy supercomputer win, so our El Capitan win will be in the fourth quarter primarily, with a little bit in the first quarter” and later it was stated by management: “You can assume that the El Capitan is several hundred million” of the Q4 data center revenue. Ideally, AMD announces commercial customers soon. I’m sure Meta will be one of the first customers, considering the company has been ordering Bergamo from AMD, was on stage at AMD’s conference recently in June, and PyTorch is optimizing its framework for AMD’s software stack RocM. It’s just a guess at this point, but that’s a lot of collaboration.

Conclusion:

AMD has high institutional ownership of +70%, which exceeds many of the FAANGs. The reason is that it’s a tough company to cover and retail investors avoid AMD for this reason. There are many moving pieces with exposure to a handful of major markets, a wide variety of customers, deceivingly lumpy revenue, known to be in second place against 800-pound gorillas, plus trying to figure out where AMD fits requires understanding of both hardware and software.

While some are offput by AMD’s complexity compared to Nvidia’s simple, straightforward thesis, this company has all of the ingredients to be a major AI player. As you’ve probably heard already on the quarterly webinars, my stance is there will be fewer winners in AI compared to other microtrends, and so to find a company like AMD will be quite rare.

Also, as a gentle reminder, Nvidia’s H100 started shipping in Q4 of last year and it took until April for there to be a “wow” moment. I can’t guarantee a “wow” moment will happen (my personal speculation is that it will happen), but this provides investors a minimum time frame of what to expect for Tier 1 hyperscalers to ramp orders after qualifying the two new accelerators.

Rather than pinpoint an exact month or quarter, let’s just say that 2024 should be the year that AMD puts up notable AI revenue. Those are my words. Here is management’s way of saying it: “So, we would expect early deployments as we go into the first-half of 2024, and then we would expect more volume in the second-half of '24 as those things fully qualify.” 

 Recommended Readings:

  • AMD Pre-Earnings Q2: Management Confidence is High for H2
  • AEHR: Strong Top Line & Strong Bottom Line – Fiscal Q4 2023 Earnings
  • AMD is Ready to Rival on AI Acceleration
  • Cadence Design Systems – Generative AI For Chips and Systems
Posted in AI Stocks, SemiconductorsLeave a Comment on AMD Q2 Earnings: ETA for AI Ramp is Q4 & 2024

Hedging and Going Market Neutral

Posted on August 2, 2023June 30, 2026 by io-fund
Posted in Webinar Alerts, WebinarsLeave a Comment on Hedging and Going Market Neutral

AMD Pre-Earnings Q2: Management Confidence is High for H2

Posted on August 1, 2023June 30, 2026 by io-fund

We recently published a deep dive on the potential of AMD’s MI300s here. In the medium-term, starting later in 2023 and into 2024, we laid out reasons why we are very positive about the competitive and financial opportunity it presents for AMD.

In the short-term, AMD faces a delicate balancing act of confronting weakness in PCs while providing assurances of a 2nd half rebound and acceleration into 2024. In that regards, AMD Q2 earnings report will be closely watched for evidence of this. For the past 3 months, analysts have steadily reduced their quarterly earnings estimates to reflect weakness from the consumer-facing PC segment. However, the multiple has expanded in part due to the optimism surrounding AMD’s AI opportunity. It’s also helpful that AMD continues to take market share from Intel on CPUs, which we’ve covered extensively.

Here are the Q2 estimates going into earnings announcement on 8/1 (amc).

All numbers for current quarter and YoY unless otherwise stated

EPS & Revenue:

  • EPS: Consensus estimates $0.57 vs $0.60 last quarter
  • EPS: Next quarter consensus estimates $0.74
  • Revenue: Mgmt midpoint guidance of $5.3B (-19% y/y) vs Consensus of $5.32B
  • Next quarter revenue consensus of $5.32B
  • Full year revenue consensus of $23B (-2.5% y/y)

Group sales by division (a reference guide of what was reported the last two quarters)

  • Data centers – $1.3B Q123 vs $1.7B Q422  
  • Client segment – $739m Q123 vs. $903m Q422
  • Gaming – $1.8B Q123 vs $1.6B Q422

Gross Margins based on midpoint

  • Mgmt adj guidance of 51% vs last quarter of 50% actual
  • Mgmt adj $ guidance of $2.65B vs last quarter of $2.68B actual 

Operating Margins based on midpoint

  • Mgmt adj op margin guidance of 19.8% vs last quarter of 21% actual
  • Mgmt adj operating margin $ guidance of $1.6B vs last quarter of $1.1B actual

Cash flow + Cash

  • Last quarter operating and free cash flow was $486B and $328B for a margin of 9% and 6%, respectively
  • Last quarter cash stood at $2.8B and $333m in debt

Here are the things we’ll be looking for:

Will Q223 mark the bottom?

The market will be looking to see if this is the bottom in yearly revenue growth

And improvement on a sequential quarterly basis.

When an anticipated bottom is approaching, a beat can be aptly rewarded. Also, the opposite, a miss can be severely penalized. The reason the pressure is on when a bottom is expected is because a beat often translates to a quicker recovery where a miss at this junction translates to a slower or delayed recovery. Our goal is to see AMD come in as expected (at least) and offer strong commentary on H2.

In providing their Q223 guidance, this is how AMD described the factors driving y/y decline and improvement (less negative) sequentially.

“Now turning to our second quarter 2023 outlook. We expect revenue to be approximately $5.3 billion, plus or minus $300 million, a decrease of approximately 19% year-over-year and approximately flat sequentially. Year-over-year, we expect the Client, Gaming and the Data Center segment to decline, partially offset by Embedded segment growth. Sequentially, we expect Client and Data Center segment growth to be offset by modest Gaming and Embedded segment decline.”

Data Centers:

AMD has indicated the decline in Data Center revenue was primarily due to lower enterprise server processor sales plus some inventory correction: “Data Center segment revenue of $1.3 billion was flat year-over-year with higher cloud sales offset by lower enterprise sales. In cloud, the quarter played out largely as we expected. EPYC CPU sales grew by a strong double-digit percentage year-over-year but declined sequentially as elevated inventory levels with some MDC customers resulted in a lower sell-in TAM for the quarter.”

However, due to the visibility AMD has, H2 is expected to be quite strong – note, that doesn’t necessarily help us AMD investors with Q2 but it’s good to know management is expecting a shift on the horizon in terms of growth. You may recall that we pulled out the conversation below because we felt it was important to portray management’s confidence level for H2 growth rates. You can view more important quotes from the last call on our post-earnings write-up here.

Question

“So you said double-digit Data Center. Was that a full year statement? Or was that a second half year-over-year statement? Or was that a half-over-half statement for Data Center?”

Lisa Su

“Yes. Let me be clear. That was a year-over-year statement. So double-digit Data Center growth for the full year of 2023 versus 2022.”

Question

“Got it. Which just given what you did in Q1 and sort of are implying for Q2 needs something like 50% year-over-year growth in the second half to get there. So you're endorsing those — you're endorsing that now?”

Lisa Su

I am…

Jean Hu

Yes, your math is right.

Client and Gaming Segment

The decline in these 2 segments will be less compared to Data Centers. Per AMD’s CFO Jean Hu:

“Client and Gaming segments would be seasonal. So you would expect that the Data Center would be more than seasonal. So maybe to help you size that, think about the Data Center sequential drop as double digit, whereas the Client and the Gaming segments are more like single digit, if that helps.”

PCs will be an important factor for both the Client and Gaming segment. AMD’s plan to navigate PC weakness was to under ship for a quicker rebound, which was Nvidia’s strategy for gaming. This makes it more painful in the short term but sets up a better recovery in the long term. According to management, this is the bottom for PCs and they expect a rebound in H2.

In Intel's Q223 earnings call, they gave positive indications that the pc environment was improving.

“We have worked closely with our customers to manage client CPU inventory down to healthy levels. As we continue to execute against our strategic initiatives, we see a sustained recovery in the second half of the year as inventory has normalized.” 

Profitability

Despite the decline in sales, AMD has been able to maintain steady gross margins. For Q2FY23, AMD has guided for an adj gross margin guidance of 51% vs Q123 of 50% actual vs Q422 of 51% actual.

If Q2 is in fact the bottom, we will look for comment on what levels of profitability can be achieved when these segments return to growth.

MI300 release – We’ll listen for any updates on MI300 which is due to be released in Q4 and is expected to contribute to revenue by early 2024. You can read more about these highly anticipated GPUs in our most recent analysis here.

Here’s what analysts are saying

07/31 Susquehanna analyst Christopher Rolland lowered the firm's price target on AMD to $135 from $145 and keeps a Positive rating on the shares. The firm previewed AMD's Q2 results and said they face a number of near-term headwinds including softer Genoa, console, GPU, Xilinx and an elevated DC expectation, putting Street estimates at risk. However, longer term Susquehanna loves the server gain and MI300 opportunities.

07/26 Citi sees "bad news" for Intel (INTC) and AMD (AMD) in the earnings reports from three of the largest cloud service providers – Alphabet (GOOG, GOOGL), Meta (META), and Microsoft (MSFT). Meta lowered 2023 capex 10% and Alphabet's Q2 capex was lower than anticipated, the analyst tells investors in a research note. Microsoft's fiscal Q4 capex of $8.9B beat the consensus of $8.1B, but the company didn't provide a full year capex guide for fiscal 2024, adds the firm. It believes the Street was expecting a raise in capex given the strength at Nvidia was expected to broaden out to other artificial intelligence chip suppliers. Citi is below consensus on AMD as it expects the company to lower Q3 guidance given weakness in the data center market. It has a "negative catalyst watch" on AMD and remains Neutral rated on both AMD and Intel.

07/26 Jefferies analyst Mark Lipacis said that Microsoft's (MSFT) and Alphabet's (GOOGL) comments regarding capex and AI spending on their earnings calls lead the firm to believe that its "above-consensus" Nvidia (NVDA) estimates "may prove conservative." The firm, which notes that "AI" was mentioned 170 times on the calls, which is twice the rate in the companies' Q4 reports, views Microsoft's and Alphabet's commentary as positive for Nvidia as well as AMD, Intel, Marvell and Broadcom.

Note: Read our takeaway that is similar to Jefferies’ Mark Lipacis that capex comments were positive on Google’s call here and Microsoft’s call here. 

07/11 KeyBanc analyst John Vinh raised the firm's price target on AMD to $160 from $150 and keeps an Overweight rating on the shares. While near-term challenges associated with delays of its MI300 AI server and stability issues with its PC NB Ryzen Phoenix could result in near-term risk to estimates, AI server wins give KeyBanc high conviction that AMD could see well over $2B in AI revenues in 2024.

07/12 TD Cowen analyst Matthew Ramsay raised the firm's price target on AMD to $135 from $115 and keeps an Outperform rating on the shares. The firm believes investors are prepared for a mixed Q2/Q3 on revenue and margins as the macro remains challenging. The firm adjusted 2H estimates to be more 4Q-weighted. and they believe investor focus post earnings will again turn longer-term to AMD's strong Datacenter prospects, including a crystallizing AI strategy supported by stronger HW/SW roadmaps. 

(06/14) Goldman Sachs raised the firm's price target on AMD (AMD) to $137 from $97 and keeps a Buy rating on the shares after the company's Data Center & AI Technology Premiere event. The analyst states that the firm was encouraged by AMD customers' endorsements and continues to model share gains for AMD in server CPUs primarily at the expense of Intel (INTC), adding that AMD should grow into a credible second supplier over the medium- to long-run.

How we plan to handle our position will be posted in real-time on I/O Fund Advanced Market Signals

The I/O Fund Analyst Team contributed to this analysis

 Recommended Readings:

  • AMD is Ready to Rival on AI Acceleration
  • July Positions Report
  • AEHR: Strong Top Line & Strong Bottom Line – Fiscal Q4 2023 Earnings
  • ON Semiconductor: Powering the EV Highway
  • Super Micro: Sandwiched In The AI Trend
Posted in Data Center, Semiconductor StocksLeave a Comment on AMD Pre-Earnings Q2: Management Confidence is High for H2

NASDAQ REBALANCE: WHAT YOU NEED TO KNOW

Posted on August 1, 2023June 30, 2026 by io-fund
NASDAQ REBALANCE: WHAT YOU NEED TO KNOW

This article was originally published on Forbes on Forbes Forbes on Jul 28, 2023,12:07am EDT

On June 30th, the NASDAQ posted the strongest first six months in the index’s history, dating back to 1971. The 6-month returns of 30.5% in 2023 easily beats the prior record of 25.2% in 2019. The majority of the rally was driven by seven stocks: Apple, Microsoft, Nvidia, Amazon, Tesla, Meta, Google. These 7 stocks are up a collective 98% YTD, while the equal weight S&P 500, which provides an equal weighting to all 500 stocks in the index, is up only 9%.

Tech Stock 2023 YTD Returns

Source: I/O Fund

Sign up for I/O Fund's free newsletter with gains of up to 221% – Click hereClick hereClick here

This level of narrow leadership continues to pose a problem for active managers who are more diversified than the NASDAQ-100. In fact, by Q1 of 2023, only 1/3 of active managers were ahead of their benchmark in 2023.

As a result, the NASDAQ is being forced by the SEC to rebalance their tech-heavy index, the NASDAQ-100, which will shift the focus away from the top seven stocks in the market, and redistribute weightings to less popular names in the index, like Starbucks and Broadcom, to name a few.

The reason for the rebalance is due to the Magnificent Seven taking up 55% of the Index’s weighting prior to the rebalance. Here was the NASDAQ-100’s weighting prior to the rebalance (as of July 18)

MSFT – 12.7%

AAPL – 12.1%

NVDA – 7.4

GOOGL – 7.3%

AMZN – 6.8%

TSLA – 4.5%

META – 4.4%

On July 14th, the new weighting was announced: NVDA and MSFT would receive the biggest cuts of about 3% each, while AAPL only got shaved by 1% (making it the new top position). Google was cut by 2%, while META and TSLA by 1%. The new rebalance dropped the overall weighting from 55% to ~38%. The NASDAQ-100 topped about 4 days later, and has since been in a minor correction.

Being a static index, a rebalance is a rare occurrence, as it has only happened twice since 1998. The last time was in April of 2011 and was focused on Apple’s outsized weighting in the index. At the time it accounted for just over 20%, and was rebalanced back to 12%. Below shows when this was announced and how it affected the stock. Though the macro environment was much different in 2011, it’s worth noting that Apple had an immediate dip that was quickly bought.

Every Thursday at 4:30 pm Eastern, the I/O Fund team holds a webinar for premium members to discuss how to navigate the broad market, as well as various stock entries and exits. We offer trade alerts plus an automated hedging signal. The I/O Fund team is one of the only audited portfolios available to individual investors. Learn more here.Learn more hereLearn more here.

Apple Chart - NDX Rebalance

Source: I/O Fund

We believe this is worth monitoring as $209 Billion is currently in QQQ, an ETF that tracks the NASDAQ-100. This means that MSFT, for example, lost $18.8 Billion in demand from this single ETF having to rebalance in accordance with the new changes. Furthermore, many institutional funds are benchmarked to this index, and are in the process of rebalancing their portfolios to coincide with these changes, which should further affect demand.

Our current take on the market is that if SPX break below 4515, then the market has likely topped. Below 4275 and SPX has put in a big top and this would be bearish. On the other hand, if 4275 is defended, then our firm will layer into more stocks as this would be bullish. The level of 4275 is of critical importance and we will update our Premium Members with our buy plan if we get here.

S&P 500 Chart

Source: I/O Fund

I/O Fund Portfolio Manager, Knox Ridley, contributed to this article .

Recommended Reading:

  • Big Tech Earnings: Microsoft And Alphabet Signal Q2 Could Be A Bottom
  • Semiconductor Stocks: Q2 Sector Overview
  • Where the Market is Headed Next
  • FAAMG Stocks Trading At Precarious Valuations
Posted in Broad Market Today, Market Trends, Tech StocksLeave a Comment on NASDAQ REBALANCE: WHAT YOU NEED TO KNOW

Posts navigation

Newer posts

Recent Posts

  • The IPO Glut of 2020: Why Valuations Have Gone Too Far
  • Zoom Discusses Two Important Catalysts In Q1 Earnings
  • Three Risk Management Tools the I/O Fund Offers
  • Micron Is Up 900%. Here’s Why the AI Memory Trade May Still Have Room to Run
  • Credo: Reliability Leader Aggressively Moves into Optics

Recent Comments

No comments to show.

Archives

  • June 2026
  • May 2026
  • April 2026
  • March 2026
  • February 2026
  • January 2026
  • December 2025
  • November 2025
  • October 2025
  • September 2025
  • August 2025
  • July 2025
  • June 2025
  • May 2025
  • April 2025
  • March 2025
  • February 2025
  • January 2025
  • December 2024
  • November 2024
  • October 2024
  • September 2024
  • August 2024
  • July 2024
  • June 2024
  • May 2024
  • April 2024
  • March 2024
  • February 2024
  • January 2024
  • December 2023
  • November 2023
  • October 2023
  • September 2023
  • August 2023
  • July 2023
  • June 2023
  • May 2023
  • April 2023
  • March 2023
  • February 2023
  • January 2023
  • December 2022
  • November 2022
  • October 2022
  • September 2022
  • August 2022
  • July 2022
  • June 2022
  • May 2022
  • April 2022
  • March 2022
  • February 2022
  • January 2022
  • December 2021
  • November 2021
  • October 2021
  • September 2021
  • August 2021
  • July 2021
  • June 2021
  • May 2021
  • April 2021
  • March 2021
  • February 2021
  • January 2021
  • December 2020
  • November 2020
  • October 2020
  • September 2020
  • August 2020
  • July 2020
  • June 2020
  • May 2020
  • April 2020
  • March 2020
  • February 2020
  • January 2020
  • December 2019
  • November 2019
  • October 2019
  • September 2019
  • August 2019
  • July 2019
  • June 2019
  • May 2019
  • April 2019
  • March 2019
  • February 2019
  • January 2019
  • December 2018
  • November 2018
  • October 2018
  • September 2018
  • August 2018
  • July 2018
  • June 2018
  • May 2018
  • April 2018
  • February 2018
  • January 2018

Categories

  • 5G
  • About
  • Accounting Tips
  • AdTech
  • Ai Platforms
  • Ai Platforms
  • Ai Platforms
  • Ai Platforms
  • Ai Platforms
  • Ai Platforms
  • Ai Platforms
  • Ai Platforms
  • Ai Platforms
  • Ai Platforms
  • Ai Platforms
  • Ai Platforms
  • Ai Platforms
  • Ai Platforms
  • Ai Platforms
  • Ai Platforms
  • AI Stocks
  • AI Stocks
  • Analysts
  • Application Monitoring
  • Application Monitoring
  • Applications
  • Applications
  • Applications
  • Applications
  • Applications
  • Applications
  • Applications
  • AR
  • Audit Reports
  • Autonomous Vehicles
  • Autonomous Vehicles
  • Autonomous Vehicles
  • Autonomous Vehicles
  • Autonomous Vehicles
  • Autonomous Vehicles
  • Autonomous Vehicles
  • Avod
  • Avod
  • Battery Charging
  • Bear Market
  • Bitcoin
  • Bitcoin
  • Bitcoin
  • Bitcoin
  • Bitcoin
  • Bitcoin
  • Bitcoin
  • Blockchain
  • Blockchain
  • Blockchain
  • Blockchain
  • Blockchain
  • Blockchain
  • Blockchain
  • Broad Market Today
  • Bull Market
  • Bull Market
  • Chainlink
  • Chainlink
  • Chainlink
  • Chainlink
  • China Stocks
  • Cloud
  • Cloud Infrastructure
  • Cloud Infrastructure
  • Cloud Infrastructure
  • Cloud Infrastructure
  • Cloud Infrastructure
  • Cloud Infrastructure
  • Cloud Infrastructure
  • Cloud Platforms
  • Cloud Platforms
  • Cloud Software
  • Cloud Software
  • Cloud Software
  • Cloud Software
  • Cloud Software
  • Cloud Software
  • Cloud Technology
  • Company
  • Company
  • Console Gaming
  • Console Gaming
  • Console Gaming
  • Consumer
  • Consumer
  • Consumer
  • Consumer
  • Consumer
  • Consumer
  • Consumer
  • Consumer
  • Consumer
  • Consumer
  • Consumer
  • Consumer
  • Consumer
  • Consumer
  • Consumer Tech
  • Corrections
  • Crypto Investment
  • Ctv
  • Ctv
  • Ctv
  • Ctv
  • Ctv
  • Ctv
  • Ctv
  • Ctv
  • Ctv
  • Ctv
  • Cybersecurity
  • Cybersecurity
  • Cybersecurity
  • Cybersecurity
  • Cybersecurity
  • Cybersecurity
  • Cybersecurity
  • Cybersecurity
  • Cybersecurity
  • Cybersecurity
  • Cybersecurity
  • Cybersecurity
  • Data
  • Data Analytics
  • Data Analytics
  • Data Analytics
  • Data Center
  • Data Center
  • Data Center
  • Data Center
  • Data Center
  • Data Center
  • Data Center
  • Data Center
  • Data Center
  • Data Center
  • Data Center
  • Data Center
  • Data Center
  • Data Center
  • Data Center
  • Data Center and Processing
  • Data Warehousing
  • Data Warehousing
  • Data Warehousing
  • Data Warehousing
  • Databases
  • Databases
  • Databases
  • Databases
  • Dating
  • Defi
  • Digital Ads
  • Digital Ads
  • Digital Ads
  • Digital Ads
  • Digital Ads
  • Digital Ads
  • Digital Ads
  • Digital Ads
  • Digital Ads
  • Digital Ads
  • Digital Ads
  • Digital Ads
  • Digital Ads
  • Digital Ads
  • E-Commerce
  • Earning Updates
  • Earning Updates
  • Earning Updates
  • Earning Updates
  • Earning Updates
  • Earnings Report
  • Earnings Report
  • Earnings Report
  • Earnings Report
  • Earnings Report
  • Earnings Report
  • Earnings Report
  • Earnings Report
  • ECommerce
  • Electric Vehicles
  • Electric Vehicles
  • Electric Vehicles
  • Electric Vehicles
  • Electric Vehicles
  • Electric Vehicles
  • Electric Vehicles
  • Energy Stocks
  • Enterprise
  • Enterprise
  • Enterprise
  • Enterprise
  • Enterprise
  • Enterprise
  • Enterprise
  • Enterprise
  • Enterprise
  • Ethereum
  • Events1
  • Events1
  • Exchange
  • Faq
  • Finance
  • Financial Analysis
  • Financial Analysis
  • Financial Analysis
  • Financial Analysis
  • Financial Analysis
  • Financial Analysis
  • Financial Analysis
  • Financial Analysis
  • Financial Analysis
  • Financial Analysis
  • Financial Analysis
  • Financial Analysis
  • Financial Markets
  • FinTech
  • Fundamental Analysis
  • Gambling
  • Gaming
  • Genomics
  • Glossary
  • Green Energy
  • Growth Stocks
  • Growth Stocks
  • Growth Stocks
  • Headsets
  • Headsets
  • Health Tech
  • Hydrogen
  • Identity
  • Identity
  • Identity
  • Inflation
  • Inflation
  • Inflation
  • Internet of Things
  • Interviews
  • Interviews
  • Interviews
  • Interviews
  • Investing
  • Investing
  • Ltbh
  • Ltbh
  • Ltbh
  • Ltbh
  • Ltbh
  • Macro Trends
  • Macro Trends
  • Market Trends
  • Market Trends
  • Market Trends
  • Market Trends
  • Market Trends
  • Market Trends
  • Market Trends
  • Market Updates
  • Market Updates
  • Market Updates
  • Market Updates
  • Market Updates
  • Market Updates
  • Market Updates
  • Market Updates
  • Market Updates
  • Market Updates
  • Media
  • Membership
  • Mining
  • Mobile
  • Mobile
  • Mobile
  • Mobile
  • Mobile Gaming
  • Mobile Gaming
  • Mobile Gaming
  • Multimedia
  • Music Streaming
  • NVDA | NVIDIA Corporation
  • Performance Updates
  • Pin Content
  • Podcasts
  • Podcasts
  • Podcasts
  • Portfolio
  • Premium Research
  • Press Releases
  • Press Releases
  • Productivity
  • Productivity
  • Productivity
  • Productivity
  • Productivity
  • Productivity
  • Productivity
  • Reports and Whitepapers
  • Research Services Preview
  • Resources
  • Resources
  • Semiconductor Stocks
  • Semiconductors
  • Semiconductors
  • Semiconductors
  • Semiconductors
  • Semiconductors
  • Semiconductors
  • Semiconductors
  • Semiconductors
  • Semiconductors
  • Semiconductors
  • Semiconductors
  • Semiconductors
  • Semiconductors
  • Social Media
  • Social Media
  • Social Media
  • Social Media
  • Social Media
  • Social Media
  • Social Media
  • Software
  • Software
  • Software
  • Software
  • Software
  • Software
  • Software
  • Software
  • Software
  • Software
  • Software
  • Software
  • Software
  • Software
  • Software
  • Solar
  • Solar
  • Stock Analysis PDFs
  • Stock Updates
  • Stock Updates (Blogs)
  • Supplychain
  • Supplychain
  • Supplychain
  • Supplychain
  • Supplychain
  • Supplychain
  • Svod
  • Svod
  • Svod
  • Svod
  • Svod
  • Svod
  • Tech Podcast
  • Tech Stock News
  • Tech Stock News
  • Tech Stock News
  • Tech Stock News
  • Tech Stock News
  • Tech Stocks
  • Tech Stocks
  • Tech Stocks
  • Tech Stocks
  • Tech Stocks
  • Tech Stocks
  • Tech Stocks
  • Tech Stocks
  • Tech Stocks
  • Tech Stocks
  • Tech Stocks
  • Tech Stocks
  • Tech Stocks
  • Tech Stocks
  • Technical Analysis
  • Telehealth
  • Telehealth
  • Telehealth
  • Telehealth
  • Testing Equipment
  • Testing Equipment
  • Top Tech Stock News
  • Travel
  • Trends Report
  • Tutorials
  • Uncategorized
  • Updates
  • Updates
  • Updates
  • Video
  • Video
  • Video
  • Video
  • Video Footage
  • VR
  • Webinar Alerts
  • Webinar Alerts
  • Webinars
Proudly powered by WordPress | Theme: iofund by iofund.co.uk.