1. Comcast to Restructure NBCUniversal Hierarchy Ahead of Peacock Launch
Comcast is reshuffling its senior hierarchy ahead of Peacock’s launch date. The company recently announced that it is consolidating Universal Television and Universal Content Productions under a single business unit to be led by NBCUniversal cable’s chairman, Bonnie Hammer.
Hammer will assume the title of Chairman for NBCUniversal Content Studios and will report to NBCU CEO Steve Burk. The reorganization is being carried out in preparation for Peacock’s launch, Comcast new streaming service, which is to be headed by Comcast Cable’s Matt Strauss.
According to Burke, Hammer was chosen for her ‘strong track record of generating popular and award-winning programming,’ whereas Strauss was selected for his ‘great experience with video, digital technology, and streaming.’
The new appointments are nothing new however. Earlier in January, Hammer was given the position of streaming operations, while NBC Sports Group’s Mark Lazarus was given a bigger role in cable.
Lyft recently launched a new ‘driver rewards system’ for their drivers. The system is now live in certain US cities, and was designed to assist drivers manage their daily earnings and workflow.
It also offers many improvements over Lyft’s usual system which only tells drivers about ride-requests and offers them the option to either accept or decline them. In contrast, the new rewards system will allow certain drivers to know how far they will need to drive, how much fare they can expect to receive and how much time they will need to spend driving.
The only downside is that these features will only be available to drivers who have reached Lyft’s ‘gold tier.’ For those who could only reach the lower tiers of the program, however, there are other rewards, such as a 4% cash back on gas when using a Lyft debit card and a $5 cash back for every 500 points achieved in the reward system.
Apple’s new macOS, Catalina is now live and is available as a free software update. The new OS offers the latest Mac versions for Apple Music, Apple TV and Apple Podcasts as well as Sidecar, a special feature which extends a Mac desktop using an iPad as a secondary display or a tablet input device that has Apple Pencil with Mac apps.
For those who want to add iPad apps to Mac devices, Catalina also features the Mac Catalyst, which allows third party developers to transfer those apps to their Mac devices. Finally, Catalina also allows users to enjoy all of their iPad apps in the latest Mac versions, including Twitter, Post-It, Jira, Tripit and GoodNotes, and it also offers Apple Arcade, Apple’s new gaming subscription service.
4. Tesla Delivers 97,000 Vehicles in 3rd Quarter; Falls Short of Target
Elon Musk had said that Tesla will be able to deliver 360,000 to 400,000 vehicles to consumers in 2019. Unfortunately, reaching this goal remains a difficult challenge.
According to their third quarter report, Tesla only managed to deliver 97,000 cars during this period. The total deliveries include 79,600 Model 3 vehicles as well as 17,400 Model S and X cars. In order to reach their year-long goal, however, Tesla will need to complete over 105,000 vehicle deliveries during the fourth quarter.
Although Tesla’s third quarter reports are impressive, it still falls short of achieving investor expectations. Tesla’s deliveries are used as proxies for sales, and a guide for understanding Tesla’s performance across different periods. So although the company’s third quarter data is certainly impressive, investors are wondering if Musk has what it takes to meet their expectations by the end of the year.
Alphabet-owned Waymo is 3-D mapping Los Angeles, its infrastructure and its traffic congestion levels to see if it can operate there. The mapping team consists of a small fleet Chrysler minivans to gather data and analyse how Waymo may be integrated into LA’s transportation environment and offer new innovative solutions to traffic problems.
Although Waymo has no immediate plans to launch its services in Los Angeles, the mapping process represents the first major step in finding a location that could best serve its needs, and such expansions will not be out of the ordinary. Waymo is currently expanding into several states, including Florida, California and Michigan, mainly to test the capabilities of their autonomous driving technology.
Unfortunately, commercializing Waymo’s services is taking longer than expected, and the company can only sustain a full live fleet of vehicles in Phoenix, and even then, the vehicles are still maintained by human operators.
6. Wallstreet Analysts Slashing Netflix Forecasts Ahead of Possible Weak Earnings Report
Wallstreet analysts are slashing their forecasts for Netflix ahead of the company’s third quarter earnings report due to increasing competition and slow subscriber growth. Goldman Sach analysts, in particular, believe that subscriptions are falling ‘modestly below guidance’ whereas UBS is citing weak international growth as a cause for concern. Consequently, both firms have reduced their target price for Netflix stocks.
On the bright side, there’s news that Netflix may have a strong fourth quarter due to additional content line up, such as The Irishman and older favorites like The Crown. Some analysts believe that the new shows could potentially bolster Netflix’subscriber growth numbers as well as offer protection against increasing competition.
7. Activision Blizzard’s Complicated Political Balancing Act
Activision Blizzard is currently on hot water as it tries to navigate an increasingly complicated political situation. Ever since the company suspended one of its players from an e-sports competition over certain pro-Hong Kong comments, it has been on hot water.
The suspension was seen as an attempt to pander to Chinese authorities, and consequently, sparked a backlash from pro-Hong Kong protestors, including several groups in the US who are calling for a boycott. In fact, #BoycottBlizzard became one of the top trending hashtags on Wednesday.
The latest casualty in this political drama is the company’s ‘Call of Duty Mobile,’ which is still waiting for approval from the Chinese government. Expanding into the Chinese market would significantly boost sales for the new game, but the banning controversy is complicating Activision Blizzard’s plans.
Alibaba is situated between two of the major growth drivers in tech: cloud infrastructure and B2B eCommerce. China is the world’s leader in manufacturing, and this country has the widest gap between the current cloud IaaS and future cloud IaaS market.
Alibaba would be a breakaway stock if not for the trade war and China’s slowing economy. The second-largest economy in the world grew 6.2% in the second quarter of 2019, a drop from 6.4% in the first quarter. This is the slowest growth since 1992. Industrial output growth slowed to 4.8% in July, which is the weakest pace since February 2002.
This analysis will outline the major industry verticals that Alibaba is uniquely positioned to benefit from along with technical analysis to help guide entry in a choppy geo-political environment.
SECTION 1: Fundamentals
Alibaba trades at 25x forward earnings and 21x cash flow, while growing revenue at 40% with long-term earnings growth projected at 26% and a PEG of 1.1. Amazon trades at a forward PE of 45 and MercadoLibre at 111.
Alibaba’s projected earnings growth is higher than its mega-cap peers at 26%, including Facebook at 21.6%, Apple at 4.53%, Amazon at 18.9%, Microsoft at 11.1%, or Alphabet at 17.6%, placing its implied share price at a minimum of $231 when comparing P/S ratios to forward growth. Based on P/E ratios to forward growth, Alibaba is also undervalued relative to its peers.
According to MarketBeat, analysts have a consensus price target of $221.64, representing 33% price target upside. Analysts have had a BABA price target above $200 since early 2018. Since the last earnings report, HSBC, Morgan Stanley, Raymond James, Goldman Sachs, Bank of America and a few others have either set price targets above $200 or boosted their price target.
• Revenue last quarter rose 42% year-over-year to $16.8 billion compared to 51% growth YoY in the last quarter
• Operating income grew 27% year-over-year excluding stock-based compensation from Ant Financial. Adjusted EBITDA increased 35% year-over-year to $5.7 billion
• Net income was $2.79 billion with non-GAAP net income of $4.05 billion, with an increase of 54% yearover-year
• Diluted earnings were $1.17 and non-GAAP of $1.83, or an increase of 56% YoY.
Core commerce revenue was up 44% and “other revenue” was up 134%, consisting of new retail and direct sales businesses. The company reported strong growth in Southeast Asia, with orders growing over 100% for the third consecutive quarter. Cloud computing was up 66%.
The most recent earnings report called attention to the fast-growing Taobao, the world’s biggest eCommerce site, and Tmall, a spinoff of Taobao. These platforms grew 44% and 34%, respectively. Taobao has 730 million active buyers across its marketplaces, representing about 50% of the Chinese population.
The last earnings report also highlighted additional revenue drivers such as the grocery retail chain Freshippo, and the Cainiao Network, which offers cross-border fulfillment and last-mile solutions. As of June 30th, 2019, there were over 150 self-operated Freshippo stores.
Alibaba may hold a separate listing in Hong Kong for as much as $20 billion this year.
SECTION 2: B2B eCommerce
The B2B eCommerce opportunity is tremendous with estimates the market will reach $12.2 trillion in 2019 compared to $2 trillion for the B2C market. Of this, Asia Pacific contributes 80% to the market with North America and Europe’s share being 12% and 3%, respectively. The four largest markets are China, Japan, South Korea and the United States.
According to Gartner, spending on B2B eCommerce platforms is expected to grow at a CAGR of over 15% during 2015-2020. The Asia Pacific B2B eCommerce market will be worth an estimated $9.8 trillion in 2019, up from $4.7 trillion in 2013. Compare this to the North American market, valued at $1.4 trillion in 2019.
According to Accenture, 50% of B2B companies around the world began to implement a digital strategy in the last three years, rather than rely on a salesperson’s personal relationship with the client. B2B eCommerce follows either a direct model that allows companies to sell directly to buyers, or a marketplace model where products are sold alongside competitors. The marketplace model has gained the most traction due to the ability for wholesalers, distributors, and manufacturers to test new geographic markets.
Alibaba claims 30% of the Chinese B2B market and is expanding its operational base into India, Europe and the United States. Due to a vast network of low-cost suppliers, Alibaba is able to dominate the market. Alibaba’s main strategies include adopting an online to offline (O2O) approach and collaborating with local finance and logistics companies in international markets.
China is the largest B2B eCommerce market in the world and is expected to grow from $1.3 trillion in 2013 to an estimated $3.5 trillion in 2019, at a CAGR of 17%. China’s market is bigger than both North America and Europe combined.
In 2018, the top three B2B platforms in terms of revenue were: Alibaba, HC350 and Cogobuy. Together, these three companies make up 57% of the Chinese market. Alibaba is now focused on the Indian market, where the company competes with Amazon.
SECTION 3: Ant Financial
Ant Financial is the Alibaba affiliate that operates the Alipay payment service. Operating income tripled in the most recent earnings report. Alibaba’s share was $237 million, representing 7% of operating income, which was the highest in two years. In the past, Ant Financial has run at a loss or provided zero earnings.
Ant Financial is worth about $150 billion and serves about 1.2 billion users with 300 million users outside of China. The company is considered one of the most valuable private sector FinTech companies in the world. Due to a recent restructuring deal, Ant Financial is eligible for an IPO in the coming years.
SECTION 4: China’s Cloud IaaS Market
China has been more than fashionably late to cloud infrastructure with a total market size of $1.2 billion in 2018 compared to the United States’ $40 billion in 2018, which affords a window of opportunity. The majority of the 20x growth of this segment in China will funnel into Alibaba with the company already owning 90% of the market.
China’s enterprise IT market is five to seven years behind the United States and Western European markets. Once fully mature, China’s need for cloud infrastructure will rival the United States with 3x the population and a bottomless appetite for smart cities, artificial intelligence and machine learning plus manufacturing IoT automation.
The reversal of where China is today with cloud IaaS, and where China will be in five years, could be a bigger story than the B2B marketplace as the growth is closely tied to China’s position as a global leader.
In 2017, China published a roadmap on how it seeks to become a global powerhouse in AI. According to the report entitled “Next Generation Artificial Intelligence Development Plan,” the domestic AI market will be worth a total of $150 billion. Today, China’s AI market is worth $6.2 billion.
Artificial intelligence and machine learning require private cloud and public cloud infrastructure-as-a-service (or a hybrid mix with on-premise servers) as storing data in separate silos weakens AI and ML capabilities, reduces training performance and lowers accuracy. Artificial intelligence and machine learning require speed with most AI solutions split between 40/60 with private/public cloud or 60/40 if you’re a regulated industry. The United States CIA describes moving to the cloud in 2013 the “best decision we’ve ever made” as what used to take 180 days to provision a server improved to 60 days, and now takes minutes.
At roughly fifty percent year-over-year growth, China’s AI market will reach approximately $60 billion by 20232024, which is in line with China’s Development Plan. This is also in line with the global market forecast which puts the AI market at $190 billion by 2025. The overall Chinese AI industry is growing at a rate of 67 percent and the country is now producing more AI patents than the United States. On that note, Alibaba’s cloud growth is currently at 66% year-over-year with $1.13 billion in quarterly revenue.
4B. Alibaba Cloud
Amazon is the perfect example of how profits from a cloud economy can outpace eCommerce income. The parallels between Alibaba and Amazon are easy to see. Both are e-commerce companies that are pioneers in cloud infrastructure as a vast number of servers had to be built to handle traffic spikes and large work-loads on peak days, such as Black Friday and Singles Day.
In the most recent quarter, AWS accounted for 13% of Amazon’s overall revenue and 52% of Amazon’s $3.1 billion operating income and is growing at 37% year-over-year. Microsoft’s cloud IaaS is growing at 64% YoY.
As stated previously, China has been late to adopt IaaS cloud, and this likely contributed to Alibaba’s delay as the first serious investment by the company was made in 2015, six years after the launch in 2009. Since 2015, it has taken Alibaba only three years to reach a $1 billion run rate compared to Amazon’s six years (2006-2012).
In addition, tech developers are responding to Alibaba with over 120,000 people attending its cloud conference compared to the AWS conference, which attracts 50,000 attendees. This is important intel that financial statements don’t reveal.
Alibaba Cloud reported 66% year-over-year growth in Q2 2019, primarily driven by enterprise customers. During the June 2019 quarter, Alibaba Cloud announced the SaaS accelerator plus over 300 new products and features. This is what the current YoY cloud growth trajectory looks like when modeled.
The law of large numbers could slow the trajectory depicted on the chart, although China’s late entry to the cloud IaaS market is likely to do the opposite and accelerate (or at least sustain) the YoY growth in the nearterm.
Today, AWS reports about 40% growth YoY more than a decade after it launched. Microsoft’s Azure reported 300% growth between 2015-2016 and 90-100% growth for the following years.
Globally, Alibaba has quietly become the number four cloud services provider worldwide, behind Amazon, Microsoft and Google when Synergy Research Group placed Alibaba ahead of IBM. Note, Gartner places Alibaba as the number public cloud provider. Across Asia-Pacific, Alibaba is the number two cloud services provider.
Alibaba Cloud was launched in 2009, however, the company did not take the IaaS revenue segment seriously until 2015, when Alibaba made its first investment of $1 billion. As stated in previous analysis, China has been late to adopt IaaS cloud, and this likely contributed to Alibaba’s delay. When adjusting Alibaba Cloud to 2015, we see it took 3 years to reach $1 billion run-rate (2015-2018) while it took Amazon 6 years to reach a $1 billion run-rate on AWS (2006-2012).
4C. Capex for Cloud IaaS
For the most recent quarter, adjusted EBITDA margin for Alibaba Cloud was -5% compared to -10% and -4% in previous quarters. According to the company, infrastructure and capacity investments triggered the quarterly loss.
Alibaba’s quarterly free cash flow in Q2 2019 was $3.8 billion with net cash of $5 billion. Therefore, like Amazon, the e-commerce business is able to carry the capex requirements for the cloud business. With that said, investors should be aware that building modern cloud computing services requires billions every quarter. For historical. comparison, Google spent $5.6 billion in accrued capex in Q3 of 2018 and Microsoft spent $4.3 billion on capex during the same period for “ongoing investment to meet demand for our cloud services,” as pointed out by Amy Hood, Microsoft’s CFO.
Please keep in mind, there will be opportunities for an attractive entry as Alibaba Cloud will not command AWSlevel and Azure-level percentages of revenue until H1 2020/H2 2020 and onward.
However, once AWS and Azure reached $5 billion in revenue, stock prices were around $300 and $70, respectively so entering Alibaba before the Cloud revenue reaches $2-$4 billion in quarterly revenue is important. While IaaS did not account for all of the increase in revenue (obviously) from the $300 and $70 stock price mark for AMZN and MSFT, I want to emphasize that cloud IaaS is Amazon’s top growth driver still today and Microsoft’s fastest growth driver for many years is Cloud IaaS.
The capex costs will affect free cash flow at times, however, this is not a concern long-term as typical cloud profit margins are around 58 percent and typical operating margins are at 22 to 32 percent.
Time Machine: Time Machine:
I wanted to leave you with a fun, little blurb from Amazon’s earnings in 2011 on AWS when it was at $1 billion in revenue (it’s now at $25 billion in annual revenue in 2018). Alibaba Cloud is at the $1 billion barrier right now.
“The speculation that Amazon's cloud is breaking the $1 billion barrier in the very near future comes as the cloud giant prepares to announce its 2011 second quarter earnings Tuesday.
"While still very small for Amazon (likely about $750 million revenue run rate), given the size of the market opportunity and Amazon's strong competitive positioning, we believe that this could soon be a $1 billion revenue segment," Citigroup Internet analyst Mark Mahaney said in a note to investors last week.
And Mahaney isn't alone in his lofty Amazon cloud expectations. In fact, his estimate could be seen as conservative. JPMorgan Chase's Dough Anmuth told Reuters that he expects Amazon's AWS to generate a whopping $2.6 in revenue come 2015.”
SECTION 5: TECHNICAL ANALYSIS
By Knox Ridley
5A. Overview – Weekly Chart
Looking at the weekly price action, along with the weekly Relative Strength Index (RSI), provides us a with a view of the overall health of a trend. Providing this history helps to also filter out any short term moves that are based on emotions. The above chart is Alibaba’s (BABA) weekly chart going back to 2016.
Long-Term Trend Lines
The dark blue trend lines highlight the long-term trends in play. The uptrend line started with the 2016 bull market. The price has tested this trendline 4 times on the weekly chart, going back approximately three years. It’s worth noting, the more a stock tests a support/resistance region, the weaker it becomes.
There is also a downtrend line, highlighted in blue that has been pushing the price of BABA down since the June high in 2018. These 2 trend lines are converging into a triangle pattern. The price of BABA is being forced to a decision soon, and we will know rather soon if the bottom is in for BABA, and the uptrend will continue, or if we could get a retest of the December lows.
5B. Moving Averages
The 50-Day Moving Average is in orange. The price of BABA is trading just below the 50-day. This average is acting as resistance, and is sandwiched between the 50-day, above, and the blue long-term trend line below. The pressure is currently down, but what BABA does in the next few days will determine the next move in the trend.
The 200-Day Moving Average is in green. The 200-day is commonly looked at as the final stand for a bull pattern. It’s worth noting that the 200-day is currently just below the $130 region, which coincides with the December 2018 bottom and 39.2% retrace level. Any pull back from here, and the 200-day will be major support to follow.
5C. Intermediate Trend Lines and RSI Warnings
The two dotted lines are lower time frame trendlines. Note how the price trends coincide with the RSI trendlines below. This is always a sign of a healthy trend. When I see a trend like this – both down and up – I follow the RSI to get a clue as to when the trend may be over.
The red X indicates the point where the price and RSI both broke their trends. As usual, this happens in unison, and is a major warning for anyone long the position. Leading up to this trend break, the RSI started making lower highs, warning of a momentum slow down. These valuable tools that Technical Analysis can offer help to manage risk.
Conversely, we have the opposite scenario on the downside. The price and RSI followed a downtrend into the December low 2018, which is shown by the second dotted line. Just after this moment, both the RSI and the price broke their downtrends. The RSI made higher highs as the price made its final low. All of these signs indicate a reverse of trend to the upside.
I’m pointing this out because we have a similar pattern unfolding today. The RSI and the price are hovering just above their respective trendlines. If they both break, I would take that as a warning of further down side to prepare for.
In conclusion, because we are trading at the end of a triangle pattern, BABA is about to give us an indication as to the direction of the next move. Below, I outlined the bear and the bull cases.
5D. Elliot Wave – Bear Count
The bear count has us currently in a larger degree Wave 4, which are the numbers #1-#3 highlighted with the blue count. The extensions of this count are in blue on the far right. These extensions act as guides for moves higher and lower and they are important for determining the likely target of any additional pullback.
If we look one degree lower, you’ll see the red 5 count, which is the internal waves of the blue count.
Remember, the pattern of 5 waves in the primary direction and 3 waves in a corrective direction is occurring on
All levels – larger degree and smaller degree. So, the larger degree Blue count, has its own internal count, which can give us clues as to where the market may be leaning.
So, we have a clear 5 waves up in red, which completes wave 3 in the blue count. The retrace levels of this count, are shown in red on the right. We touched the 38.2% retrace level, which acted as final support for the previous pullback.
I put the 50% retrace level on the chart as well, which is the bottom of the bearish target box in green. I don’t see BABA going lower than this level, even in a worst-case scenario. Furthermore, I believe you have to have a “good enough” price tag for a solid long-term investment in a downtrend. Baba at or below $130 is a steal, even if it goes lower.
A pattern that keeps showing up within this pullback is a classic A,B,C correction, where the C wave extends with 5 waves to at least the 138.2% extension. This can be seen with the first drawdown move with the orange A,B,C count, and with the 5 wave count of the final C wave revealed in teal roman numerals. This pattern is a clue to
the likely path of the larger degree pattern, and I am expecting this pattern to unfold to the downside in my primary count. The extension to this final C wave down is shown in pink.
If we break the $146 support region, I will consider this count in play, and suggest preparing accordingly. I will consider this count to be invalidated if we break the triangle pattern to the upside and close above $185. At this point, we will likely be in the bull count, which is listed in the next section.
5E. Elliot Wave – Bull Count
The Bull Count has the larger degree wave 4 ending at the December low. We have all the waves and the proper structure in place to justify this; also, the time frame works to justify this count as well. If this count is where we are, then we are in the final 5th Wave push, and just about to begin the heart of this move, which I calculate will take us well beyond the all-time highs. This count will be invalidated if we move beyond the $146 support region. If this happens, we will likely revisit the $130 support region and possibly beyond.
Because of the fundamental story in BABA, we have a high conviction on the company, yet naturally, are unsure of the geo-political environment. For now, we favor the bull case absent any news around the trade war, the delisting of Chinese companies, etcetera. At minimum, I’d place a stop just below $146. If you want further confirmation, wait for $185.
Hope everyone is looking forward to a nice weekend. Some of my neighbors have been without power for a few days due to PG&E shutting down preemptively on the two-year anniversary of the Paradise fire. That company is looking very troubled these days.
We sent out the BABA report last night. Had a nice boost this morning. The valuation there is fairly cheap compared to its peers (for obvious geo-political reasons). I like the areas they’re moving into beyond B2C eCommerce which is B2B eCommerce and cloud. There’s a high probability that there could be some momentum here, in my opinion.
Chainlink is up about 60% in the last couple of weeks, and along with Knox’s technical analysis both in the PDF and the forum, I think that one played out nicely with many of our readers getting in around the $1.60 mark. About a month later, it’s at $2.75.
Slack got a big boost today due to coverage that 37 hedge funds have initiated positions. Stock is trading up 9%.
I have an Op-Ed coming out next week in MarketWatch on Netflix. I actually like this company for a very long buy-and-hold but it’s going to get beat up for awhile. Knox will give you some ideas on a dirt cheap price and I will not be initiating a Netflix position myself until I get it dirt cheap. Too much risk due to market perception.
The Op-Ed on Netflix covers the slow proliferation of OTT globally and how Netflix is set up to be the leader as we hit global saturation between 2030-2040. This is the decade when the world will have broadband (we are at roughly 50% access to broadband right now with most of that percentage being very slow speeds).
I believe Netflix could have 1-3 billion subscribers if you figure 50-70% penetration in developed countries and 20% penetration in developing countries with 10 billion population in the 2030 decade. I have a lot of statistics in the upcoming analysis that supports this. But, this stock is going to get really beat up, in my opinion, and I’m on the sidelines for now. It’ll be on my market crash and/or recession shopping list. I’m really curious to see what Knox says on the rock bottom price, as well. He’ll have that for you next week.
Shopify has made it clear they are in the product-market fit stage and will scale between 2021-2023, as referenced in a recent investor presentation. Product-market fit is an exploratory stage where profits are not prioritized. Once product-market fit is achieved, the growth trajectory can move very quickly.
Gross Merchandise Volumeis growing 51% year-over-year at $13.8 billion.
Shopify makes 2.63% of GMV, or $361M of the $13.8 billion. Compare this to Amazon.com who makes 26.7% of GMV ($42.7 billion on $160 billion GMV, in 2018) and eBay who makes 11.7% of GMV ($10.86 billion on $92.6 billion, in 2018).
In June, Shopify announced the Shopify Fulfillment Network to serve as a dedicated fulfillment center and to speed up deliveries to help merchants remain competitive. The goal of the fulfillment center is to put independent retailers with 10 to 10,000 orders per day on par with the fulfillment centers of larger retailers. To date, only early access to the fulfillment center is available.
Shopify is a stock that comes with a heated debate due to prospects for high growth and immense volatility. The stock has a high valuation (at times), and momentum traders are attracted to the stock, which hasn’t helped the volatility. To illustrate, 52-week low is $117.64 and the 52-week high is $409.61.
This analysis will look at where Shopify is today, and Shopify’s potential by 2023, with ideas for entry. From Shopify’s acquisition strategy and fulfillment plans, it is very unlikely the Shopify we see today will be the Shopify of the future. This is due to the acquisition strategy, and Shopify’s clear ambitions to be more than point-of-sale software.
The risk is Shopify’s high valuation compared to the timing of when Shopify will report the anticipated profits from the new fulfillment center and expansion potential (2021-2023). New investors risk over-paying now for the Amazon-like aspirations that may materialize in two years from now. In addition, investors who have early positions risk exiting due to broader market volatility that is driven by momentum reversals and rotation into value. The goal will be for new investors to enter at a price where there is upside potential and for existing investors to remain invested at an unshakable valuation.
The reason to stay long on Shopify, is that industries get disrupted and e-commerce is overdue for disruption. Amazon’s pay structure is not fair to merchants at 26%. eBay is stagnant in revenue growth for nearly 10 years (fluctuating between $8B to $10B). Shopify is already the third largest online retailer in the United States and is doing one thing very well that the others neglect: emphasizing the merchant (whereas Amazon’s focus is the customer). I believe this piece to the product-market fit will carry Shopify through the hurdles of taking market share from one of Wall Street’s favorite darlings (Amazon) – more on this below.
Product Overview
The question many investors ask about Shopify is whether it can compete with Amazon — or even Alibaba? Today, this is not a possibility as Amazon and Alibaba drive traffic to products and take a premium for helping secure the sale. They own the domain website, so customers are loyal not to the merchant, but to Amazon and Alibaba.
I believe this could be where Shopify will end up, eventually. If the fulfillment center is a success, which will take some time to test and gather traction, then the back-end will be set up for the front-end development of a website or some kind of product aggregator – whether that’s a website domain or another recommendation engine.
For Shopify, it makes sense to first build out the fulfillment center for their point-of-sale software in order for a successful pivot.
Amazon had a very successful pivot from selling books to selling all retail items. For an investor to see a pivot, it requires looking beyond where the company is today.
Shopify counts over 800,000 merchants as customers compared to Amazon’s 5 million marketplace sellers. Shopify charges the sellers 2-3% compared to 26.5%. Amazon is also predominantly a United States presence with about ¾ of sales occurring domestically. Shopify does not break out these numbers but it is widely understood to have a global strategy.
As mentioned previously, an important distinction between Shopify and Amazon is that Shopify places the importance on the merchant while Amazon places the importance on the retail customer. While Amazon builds out 1-day shipping, Shopify is building out tools for platforms and tools for merchants.
Perhaps unfamiliar to public markets, the phrase “chicken and the egg” is often talked about in private markets. This phrase refers to the question of which comes first for a product or service – the buyers or the sellers. Shopify’s strategy to attract merchants through increased services and decreased costs is a very valid approach, and in my opinion, this is what will cement Shopify’s success.
Shopify is very clear they are in the product-market fit stage and will scale between 2021-2023, as referenced in a recent investor presentation. Product-market fit is an exploratory stage where profits are not prioritized. Once product-market fit is achieved, the growth trajectory can move very quickly.
Source: Shopify 2019 Investor Day
Fundamentals
Shopify has grown at a pace of roughly 55%-60% year-over-year or more for quite a few consecutive years. The company is profitable on an adjusted basis, yet is not profitable by GAAP standards. The adjusted operating margins are at an estimated $20 to $30 million this year.
Adjusted earnings came in at 14 cents in the most recent quarter, up from 2 cents a year ago. Shopify reported revenue of $362 million, up from $245 million, and ahead of earnings estimates of $350 million. Net losses were at $28.7 million, or 26 cents per share, compared to $24 million, or 23 cents per share in the year-ago quarter.
Shopify’s full year revenue is expected to be in the range of $1.51 billion to $1.53 billion. GAAP operating loss is expected to be between $145 million and $155 million with an adjusted operating income of $20 to $30 million.
Next quarter, Shopify expects to report revenue between $377 million to $382 million, above consensus estimates of $374 million. GAAP operating loss is $44 million to $47 million with adjusted operating income between $0 to $3 million.
There is some criticism around the stock-based compensation that has been paid, as the spread between GAAP and non-GAAP is wider than many other companies in a similar revenue bracket.
Shopify has held frequent, secondary-offerings. In September, Shopify offered 1.9 million shares, raising $600 million. In December, Shopify sold 2.6 million shares, which followed a 4.8 million share offering earlier in the year.
GMV
Gross Merchandise Volume is growing 51% year-over-year at $13.8 billion.
Shopify makes 2.63% of GMV, or $361M of the $13.8 billion. Compare this to Amazon.com who makes 26.7% of GMV ($42.7 billion on $160 billion GMV, in 2018) and eBay who makes 11.7% of GMV ($10.86 billion on $92.6 billion, in 2018).
Percentage of GMV illustrates the power of owning the domain. Notably, from an investment standpoint, eBay is not a growth stock with stagnant revenue and Amazon is not a pureplay – therefore, these are not perfect comparables for valuation even if their business models are similar.
With that said, eBay makes 7x more in quarterly revenue than Shopify and roughly $500 million in net income per quarter, yet Shopify commands a higher market cap than eBay. Therefore, Shopify’s growth is being duly rewarded and the question remains if there is upside potential for new investors.
Product Launches & Acquisitions
In June, Shopify announced the Shopify Fulfillment Network to serve as a dedicated fulfillment center and to speed up deliveries to help merchants remain competitive. The goal of the fulfillment center is to put independent retailers with 10 to 10,000 orders per day on par with the fulfillment centers of larger retailers. To date, only early access to the fulfillment center is available.
In the most recent earnings call, COO Harley Finkelstein stated Shopify will spend $1 billion on the fulfillment center over the next five years, while CFO Amy Shapero said the company plans to bring seven warehouses online this year.
The announcement of the fulfillment center places Shopify closer to online retail rivals, such as Amazon and eBay, while distancing Shopify competitively from point of sale systems, such as Square or Stripe. Shopify will also offer custom shipping boxes and additional value adds, although the real value is in easing the inventory and fulfillment details that can become complicated with third-party logistics providers.
Notably, eBay announced a rival fulfillment center at their user conference in July.
This month, Shopify announced the acquisition of 6 River Systems, which will add collaborative robot fleets to Shopify’s Fulfillment Network. 6 River Systems builds robots that speed up production in warehouses. The company’s collaborative robot named “Chuck” guides employees through facilities and each step of the packaging process. The acquisition will bring on board robotics experts who worked on Amazon’s Kiva Systems.
The acquisition of 6 Rivers is strategic as the company will have annual revenue of $30 million in 2020 and will increase the company’s expenses by $25 million in the current year, adding no material value.
Last May, Shopify acquired the B2B wholesale purchasing platform, Handshake. Handshake’s platform offers the ability for merchants to handle sales directly rather than pass off the sale to a third-party marketplace. The team from the acquisition became part of Shopify Plus, the enterprise-level part of the business that can handle over 10,000 transactions per minute. B2B e-commerce sales in the United States reached $1 trillion in 2018, with Shopify Plus making up 24% of revenue in 2018.
Borderless Retail & B2B eCommerce
Shopify’s mission is to offer borderless retail. The company envisions a future where North American shoppers can easily and seamlessly purchase from Europe, Asia and other continents without the level of friction and delays experienced today. Expanding globally is an area where Shopify plans to offer expertise. The company offers many tools and marketing ideas for small to medium-sized retailers. Statistics provided by Shopify indicate that 57% of online shoppers make purchases from overseas retailers.
B2B eCommerce, which is the exchange of goods and services between companies, has overtaken B2C eCommerce. According to Statista Digital Market Outlook, the global B2B eCommerce market will be worth $12.2 trillion in 2019 compared to $2 trillion for the B2C market. Keep in mind, Asia Pacific contributes 80% to the market, with the majority off limits in China, with North America’s share being 12%. According to Gartner, spending on B2B eCommerce is expected to grow at over 15% during 2015-2020. According to Statista, the North American Market is estimated to be worth $1.4 trillion in 2019, up from $606 billion in 2013, growing at 15.3%. Europe is growing at 5.6% CAGR.
source: Statista
Shopify is not on the map as a competitor in the B2B eCommerce space. The major players are Amazon, Alibaba, Rakuten, Mercateo, Global Sources, Walmart and IndiaMART.
Amazon, especially, is doing well in this space and has made an effort to work with startups with Amazon’s newer B2B platform called Launchpad. The company partnered with crowdfunding platforms, venture capitalists and startup accelerators, like Kickstarter, IndieGogo and Y Combinator, to provide capital to help B2B startups launch and scale. The UK launch of the platform was also supported by the startup community and platforms such as Crowdcube. This is more of the level where Shopify competes, compared to Alibaba or Mercateo.
Conclusion:
Shopify has stated they are in the product-market fit stage. Investors should use this to their advantage as many doubting investors may lose patience by the time the company reaches its growth trajectory stage. The financials are not likely to provide the safety net most investors need to be comfortable as the company is 1-2 years from its major growth phase.
Shopify currently has a forward price-to-sales of 24, and thus, you should believe in a company’s strategy when there is a higher valuation. From a go-to-market strategy and unique value proposition perspective, Shopify has an excellent strategy, in my opinion – which is to focus on the merchants. You can expect Shopify to undercut Amazon on the merchant costs while iterating until their fulfillment is on par. This is attacking Amazon on the flank, so to speak, rather than head-on by focusing on the customer. Therefore, with proper execution, Shopify has a viable competitive advantage.
Technical Analysis
By Knox Ridley
Moving Averages
Shopify (SHOP) has broken both its 20-day and 50-day moving average, with the 20-day crossing over the 50 to the downside. This crossover is notable, but as you can see, this happens quite frequently when SHOP goes into a correction.
The 20-day is typically viewed as a normal pullback defense, while the 50-day is considered an uptrend defense.
The 20-day is clearly pointing down, which can be seen in the above chart by looking at the orange line, while the 50-day is just beginning a slower arch down, which can be seen in green. When the 50-day begins to shift its direction, it’s much more notable, and warrants caution.
The 200-day is highlighted in purple.As you can see, the price is approaching this average, but is still above it. We will want to watch how the price reacts to this level. Typically, the 200-day is strong support, so any break below should be noted.
Internal Strength
Relative Strength Index (RSI):
Regarding Shopify, there are a few points worth noting. First, notice the blue trend lines in the price of SHOP and in the RSI. These trendlines started at the December 2018 bottom. As the price moved along a specific upward trendline, highlighted in blue, so did the RSI, also highlighted in blue, which is indicating a healthy uptrend. Both of the trends broke in unison, which is highlighted by the black arrows, indicating that the current uptrend is over. The extent of the downtrend is the question to answer.
if you look at the horizontal red line at the 27 mark of the RSI, this line has acted as support for the uptrend since 2016. Until the RSI breaks above 60, the momentum is pushing down.
Moving Average Convergence/Divergence (MACD):
The MACD is an indicator used to gauge momentum as well as changes in trends. You’ll notice the intensity of the current downtrend in the MACD. The redline running along the -5.75 line has acted as strong support going back to 2016. The MACD’s momentum never broke this level. Today, the MACD broke through this support with force, making much lower lows. Therefore, the downtrend we are in may not be over.
Conclusion:
According to the MACD, the current downtrend has a level of momentum that we have not seen in Shopify, so far. The 50-day is beginning to point down, which is a further indication of weakness. We will want to watch the 27 line on the RSI as well as the below moving averages. If we break these levels, expect more downside to follow.
Head and Shoulder
A Head and Shoulder pattern is a widely regarded bearish pattern. The dotted black line indicates the “neckline,” or support at $281.75. If this level breaks, and is confirmed by price failing to break back above the price region, expect downside to follow. Anyone holding Shopify and is looking to protect gains, I would hold a stop just below this level at $281. As you’ll see in the next section, this support level also lines up with an important Fibonacci level as well, which adds to the importance of this support region.
Elliot Wave
Elliot Wave Theory is, in my opinion, one of my favorite tools for organizing a game plan for a position. According to Elliot Wave, the market moves in a 5-wave, move in the primary direction of the trend, and then 3 moves in a corrective direction, and then repeats. These moves line up with and are confirmed by Fibonacci ratios, which are viewed as accurate in many instances. Whether you believe in this theory or not does not matter, because the market believes it. In other words, time and time again we see the market react to these ratios, which is why I use it to gauge a general game plan.
Aerial View (primary count):
In the case of SHOP, from the 2016 uptrend, we can see a clear 5-wave up trend, highlighted in green. My primary count has us completing 5 waves up; however, it’s worth noting that SHOP has a history of extending its 5th wave. My primary count will be invalidated with new highs.
If you want to play this bullish scenario before confirmation, place a stop below the neckline of the head and shoulders pattern, which also coincides with the 138.2% extension within Wave 5’s count ($281). I see this support region as the determining factor – if it holds, expect an extended 5th wave and new highs, but if it breaks, I’m expecting a deeper than expected pullback.
If the head and shoulders pattern is confirmed, we will likely reach the box in green highlighted in the graph, which coincides with a cluster of extensions and retrace levels. It’s worth noting that there are not a lot of support levels below the current level we are hovering over. If this level breaks, I’m expecting a retrace to at least the 23.6% retrace level ($196 region).
Fibonacci ratios place a low point is around the 38.2% retrace – around the $125 region. This is unlikely even in a worst-case scenario, however, some Wave 2s hit these Fibonacci ratios. Due to Shopify’s fundamental strength, this is unlikely.
Once the wave-2 retrace is complete, we will start a powerful wave 3 on this larger degree in blue, which my calculations have us going well beyond to new highs. The primary goal is to catch the wave-3.
Close Up View:
The above chart offers a significant clue to where we are in the overall count, and further evidence I am using to justify caution. When we see 5-waves on any level, it indicates the direction of the main/primary trend. When we see 5-waves down on a smaller level, after a 5-wave uptrend, it’s an indication of a trend change.
We can clearly see a 5-wave pattern down from the highs, which is highlighted in magenta, and a retrace back to the exact 50% retrace level. This retrace level unfolded in a 3-wave corrective pattern. This information on the micro level tells me that more downside could follow. This is important because even if you want to play the upside, then please mind the $281 region as an appropriate stop.
Another day, another headline saying Alphabet’s Google and Facebook are being investigated for allegedly breaking privacy laws and engaging in anti-trust behavior.
Google GOOG, +0.95%GOOGL, +0.98% has been the subject of three antitrust investigations conducted by the European Union, resulting in more than $8 billion in fines.
Now the company, which controls 31% of global digital ad dollars, will face the U.S. on anti-trust matters. A big question is if governments will be effective, as they may not understand how social-media and internet businesses operate.
In April 2018, Congress tried to piece together how Facebook’s FB, +2.74% platform works. It ended up being a disaster. Anyone who works in the mobile-ad industry knows that the mobile device, notorious for its massive data leakage, could be used to collect thousands of data points daily to reveal personal thoughts, behaviors and political preferences.
When Facebook CEO Mark Zuckerberg answered a question on how Facebook makes money — “We sell ads, senator” — he wasn’t fooling the ad industry. It’s well aware that Facebook sells audiences and identities, as the company’s ads would be worthless without extracting data points from the mobile device and aggregating them for targeting.
This isn’t your typical targeting of pizza (or beer) ads during football games. This targeting knows you better than you know yourself, as it monitors your actions with data science and look-alike modeling.
The only force that can stand up to the complex tracking methods used by Google and Facebook will be an opposite, yet equal, force. It will not come from governments, which think that paying for search results is the problem. Rather, the problem is the pervasive code and software that continually tracks people, which no competitor can compete with.
Turns out, there is an opposite and equal force in magnitude that has chipped away at the anti-competitive tracking that occurs in the browser with Intelligent Tracking Prevention (ITP). Yet it has not done so on the leakiest device of all: mobile. And that would be Apple AAPL, +0.85%.
Pervasive tracking is anti-competitive
Facebook and Google aren’t the only companies that track users on mobile and browsers. They simply have software and code in more places. For instance, Facebook’s software is in 32% of the top 500 app market — and up to 800,000 applications. They track billions of non-Facebook users with software that can track you whether you have navigated one of their digital properties or not.
There is no way to opt out of Facebook or Google from tracking you, as their tracking is simply everywhere. In fact, security experts, including Bruce Schneier of the Berkman Center for Internet and Society at Harvard, call such tracking outright surveillance.
The incredible depth of information those giant companies have on mobile and internet users is the “moat” that generates unprecedented cash flow in advertising. Both ad-dollar machines have inertia from the data being collected, and it doesn’t appear that the EU’s General Data Protection Regulation (GDPR), anti-trust lawsuits in Europe and the U.S., or the Cambridge Analytica scandal is going to slow those companies.
The flow of data is provided by tracking code across websites. Those include the Facebook “like” button and sign-in. It’s also done through software development kits (SDKs), such as Facebook Audience Network, which is installed in 32% of the top 500 apps on the market. Google simply acquired Android to have tracking across the majority of mobile, and then went further, acquiring AdMob in 2009. That ad network was especially popular on the Apple iPhone.
The moat that Google and Facebook have enjoyed comes from having first-party relationships with nearly every user who has a smartphone. This is called first-party data and is a loophole used to collect data even after a user is on another property where there is no relationship. For instance, Facebook uses first-party data to power ads on streaming service Hulu, but at this point, the first-party relationship does not exist with Facebook’s social network once someone is on Hulu, and this is done without explicit consent (by both Facebook and Hulu). Easy-to-navigate opt-ins are not offered, as it’s unlikely Hulu viewers, who pay for the app, would want Facebook accessing their viewing data if they had to opt-in.
Privacy issues aside, there is no way for another ad company to compete when Google and Facebook collect that much data. Other companies are copying their approach by tracking users with universal ad IDs, including leveraging Apple’s Identification for Advertisers (IDFA).
Apple’s ITP prevents browser tracking
To understand how technology can neutralize tracking, it’s important to look at Apple’s Intelligent Tracking Prevention measures, which were launched in 2017. Apple’s ITP placed a limit on how long cookies are available for third-party contexts by removing third-party cookies after 24 hours.
At first, ITP did not have an effect on Google, as users of its search service and other properties visit those sites daily and, therefore, are not considered third-parties. Some critics say ITP strengthened Google as one of few remaining options to target niche audiences.
In 2018, Apple continued to battle data collection on the Safari browser by shutting down finger printing, a method of triangulating a user’s identity through fonts, screen dimensions and plug-ins.
In March 2019, Apple announced ITP 2.1, which limited first-party cookie storage to seven days. To put that in perspective, a Google Analytics cookie, in theory, would last for up to two years. Safari can now delete it within a week.
Finally, in May 2019, Apple limited tracking to 24 hours, including Google and Facebook.
We’ve seen statistics from publishers where they get half the CPM value — cost per thousand impressions — as a result of ITP’s impact. If they can’t have good targeting, some of their sites become less worthwhile for their advertisers.
Google and Facebook are the companies most affected by ITP 2.2, which was released in May 2019. Still, the companies reported record second-quarter ad revenue — $16 billion for Facebook and $38 billion for Google.
That may be due to Apple’s Safari and Mozilla having a small share of browser activity, or it could be because Facebook and Google have daily first-party relationships with users. A third possibility is that it’s too soon to understand the effects of ITP.
Keep in mind, the browser is not nearly as powerful as the mobile device.
At the Advertising Week conference in New York last week, there was a presentation by Gadi Eliashiv of Singular titled “A World Without IDFA: The Implications for Marketers.” I caught up with him after the presentation to get more background on Apple’s Identifier for Advertisers, or IDFA, and the possibility of Apple restricting the identifier. Unlike cookies on the web, where there is a tag on the browser, mobile identifiers have much stronger tracking capabilities. The identifier belongs to the device and works across applications and devices.
Eliashiv pointed out that attribution, or the tracking of advertising’s effectiveness, will always be a reality as it’s important for advertisers to track return on investment (ROI), and this ultimately supports the mobile ecosystem for the development of new apps and features. He also thought the recent iOS 13 upgrade, which offers users the option to sign into apps via an email address that Apple generates, is a way of logging into apps and getting personalized experiences without having to give up personally identifiable information.
As Eliashiv said, if it were an easy decision, then Apple would have already made it.
Apple’s chance to make a statement
As of now, Apple has no plans to remove the IDFA, although for a company that insists it is a protector of privacy, at the very least, there should be better opt-ins. The changes made with ITP on the browser may not have had a big effect. However, the implications of Apple restricting IDFAs on iOS becomes more serious with the iPhone having a global penetration of up to 20% of smartphone sales.
Even companies that have fancier IDs, such as Trade Desk TTD, +3.04%, with its Unified ID, relies on IDFA to some extent, and any changes to IDFA would limit the ability to collect and stitch together fragments about the user.
That said, perhaps Apple should have addressed those issues before hyping its privacy efforts. As of now, Apple is enabling a lot of tracking with the IDFA, and this may not be an appropriate compromise for attribution as users are completely unaware their activity can be tracked across the entire device.
Furthermore, users don’t have any method for approving the software development kits, from Facebook’s Audience Network or Google’s AdMob.
Even with anti-trust regulations, this level of tracking will continue. That is, unless Apple steps in.
1. Uber and Lyft Face Increasing Investor Skepticism
After weeks of controversy and poor earnings, it’s no surprise that Uber and Lyft are now facing scepticism from investors. Uber shares recently closed at $29.15, whereas Lyft shares recently closed at $39.57, slightly below from their previous lows of $30.29 and $40.84 respectively. The new all-time lows represent the pessimistic sentiments of many investors, despite assurances from both firms that they will be able to bounce back from their various problems.
However, both Uber and Lyft are not the only ones affected by the growing scepticism. Investors are also questioning the viability of billion dollar market caps of large companies that recently went public. Unlike traditional tech companies, which primarily produce software, newer tech IPOs, like Lyft and Uber, offer different types of services, many of which face growing scepticism among many investors.
2. Sony Reduces the Price of Playstation by Half; Starts Streaming Game Services
Sony is upping the ante. Starting next Tuesday, the cost of a PlayStation subscription will be cut in half to $9.99 per month. According to Sony, the new price policy was driven by the need to provide a service that is “comparable to other entertainment streaming services on the market.”
Sony’s decision to cut its streaming prices in half reflects a general trend among entertainment and gaming companies to cater to the streaming market. From music and movies to TV shows and video games, streaming services are the driving medium of sales on phones, tablets, laptops and consoles.
Moreover, the popularization and development of streaming services has led many consumer demographics to drop older cable and gaming services in favor of streaming solutions, leading to the growth of well-known streaming brands, such as Disney, Amazon and most notably Netflix.
Sony’s decision to cut the cost of its Playstation streaming service reflects the growth of other similar services in the games and entertainment industries.
3. AMD Announces New Ryzen Pro 3000 Series CPUs For 4th Quarter
AMD recently announced that their 3rd generation Pro processors will be available for purchase this 4th quarter. The new Pro CPUs were designed for both small business and commercial desktop computers, and they will feature up to 12 cores.
The new Ryzen Pro CPUs were supposedly based on the Zen 2 “Matisse” microarchitecture, introduced earlier this summer. They will also support all of AMD’s Pro-series features, such as the TrustZone security Processor, DASH manageability, Secure Boot, Content Protection and more.
Additionally, AMD also has a little something for streamlined PCs that prioritize integrated graphics over CPU cores. Their new Ryzen 3000 Pro APUs will feature the quad-core Ryzen 5 Pro and Ryzen 3 Pro as well as the dual-core Athlon Pro 3000-series CPUs, all of which include the integrated Radeon Vega graphics
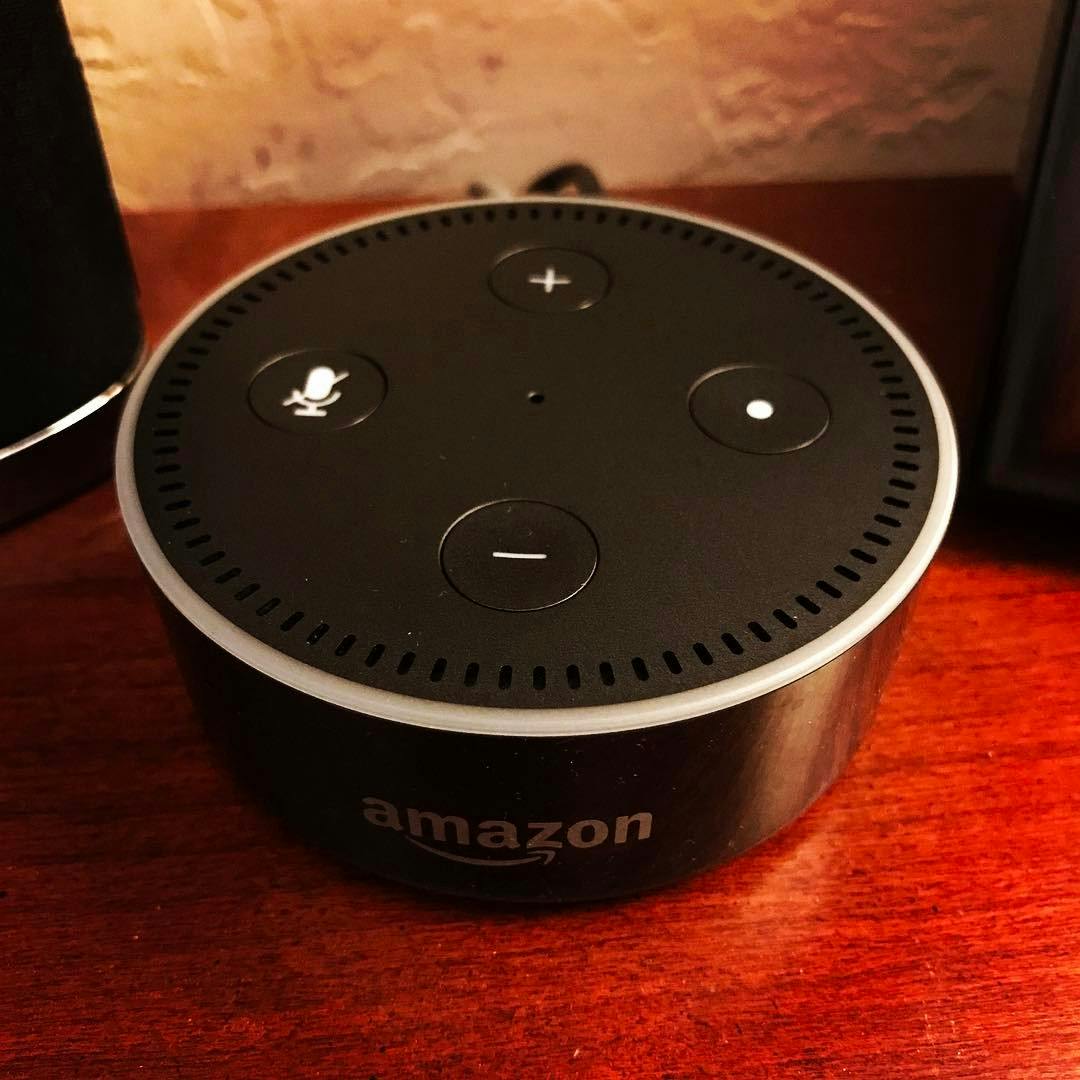
4. Amazon’s New Echo Devices Add Virtual Assistants in Glasses, Jewelry and Even in Your Ear
Amazon takes another step towards Sci-Fi with its Echo devices. The new products will allow Amazon to install Alexa into common accessories, such as glasses and rings, and even inside people’s ears.
One of the Echo devices, Echo Studio, is a music-focused speaker that is capable of playing high definition audio. Another device – the Echo Flex – puts Alexa inside a plug that can be attached into locations where large speakers don’t fit.
If you want to put Alexa in your ring, there’s the Echo Loop ring accessory, which is designed to do just that. And for those of you who need to wear glasses, there are now Amazon glasses which are voice controlled and operated.
According to Amazon representatives, the new devices were designed to “make your home smarter and safer, keep family and friends connected, and bring your favourite entertainment to you, wherever you are.”
Microsoft is creating a new smartphone. Introducing the Surface Duo, an Android device with two screens. Each screen measures 5.6 inches, both of which can be expanded into an 8.3 inch device when fully expanded. So far, that’s the only information Microsoft has released to the public, though there are expectations that the Surface Duo will be available during the holiday season next year.
Aside from its new phone, Microsoft also recently released several new products, including Windows 10 X for dual screen devices, the Surface Laptop 3, the Surface Pro X and Surface Pro 7, Surface Pro Earbuds as well as the SQ1 custom Arm chip.
6. IBM Develops AI That Can Create Realistic Voices Based On 5 Minutes of Vocal Audio
Creating realistic text to speech models requires powerful hardware. However, researchers at IBM were not deterred by this challenge. They recently developed a lightweight and efficient method for speech synthesis and suffice to say, the results are impressive.
According to the researchers, their AI can synthesize high quality speech in real time based on a speaker’s voice. Moreover, the AI can also adapt to different speaking styles and voice patterns by analyzing small amounts of audio data.
According to IBM researchers Zvi Kons, Slava Shechtman, and Alex Sorin, this new technology was developed using a ‘neural speech synthesis based on a modular architecture,’ and is quite different from older text to speech systems, most of which relied on large, complex neural network models in order to work.
Intel is reducing the price of its i9 processors as it attempts to refresh an old design. The new prices will take effect this November, which happens to be the same time when Intel’s new gaming chips will be released into the market.
The i9 chips are built on an old core called Skylake, an aging design that had seen numerous mediocre performance upgrades year after year. Intel would like to transition to the newer Ice Lake-based designs however, their newer chips are still limited to certain premium laptops, which explains why they are sticking to the older models.
Additionally, there’s also the issue of competition to consider. Intel is facing intense pressure from Apple, Samsung and Qualcomm, all of which are challenging the company’s dominance in the chip market. By slashing the cost of their chips, Intel hopes to address these challenges while keeping their existing chips fresh for most consumers.
It’s my prediction, that no matter what the broader market does, that tech will no longer be seen as a cyclical high-growth play – and rather, as more secular. The market is not ready to accept this yet but I believe they will be proven wrong as tech no longer needs a strong economy to push forward. Some tech companies will continue to report strong earnings, even when safe value stocks do not. I am not sure how the market will react exactly to positive tech earnings, as liquidity tends to trump earnings. But, in the last two major pullbacks, of the dot-com bust and the 2008 loan crisis, technology was not in a position of strength. Many of the internet companies were superfluous. They did not solve a pain, and global economies were not built on them. By 2008, the tech hype cycle had not begun, and in fact, mobile had its start six months prior with the iPhone launch.
You can basically say, at this point, that the most technologically advanced country is the most powerful country. That became more of a reality with cloud computing.
With tech, I’ve stated in previous market updates, that I follow trailing stops. This is a personal decision as the losses on tech growth (even great companies) can happen swiftly. I used Nvidia as an example of why a trailing stop is a great idea – you can always get back in once the stock stabilizes.
Today, nothing happened to the stocks we’ve covered in the PDFs that would be cause for alarm. If you’re new to Roku, then the pullback was alarming, but we had stated many times to not buy at its peak because this stock has a predictable pattern of dropping 50% off competitor announcements (these announcements are immaterial – Comcast -are you kidding me? And Apple is not a competitor as Roku is free ad-supported; not a subscription service. I’ll write some thoughts in the forum on this).
Of the industry verticals across tech, I want to emphasize that connected TV advertising will be a safe haven in the short-term. Brands are allocating budgets to CTV ads and that’s not going to change anytime soon. Roku, Trade Desk and a small cap Telaria was discussed on the forum. My goal is to dig up a few more options here for you to consider. As you know, Roku is my favorite and it’s due to product-market fit – but by all means, choose the CTV ad products/companies that you think fits your portfolio the best. I don’t think you can go wrong.
Cloud stocks will continue to report growth, as well. If I were to rank them, I continue to believe Zoom is the most insulated from a global slowdown. They solve a real problem and they do it cheaper and easier than the competitors. With that said, Workday, Slack and MongoDB should also remain insulated.
I do hedge and have short positions and puts. I do well with these and so do many of my readers. I hear from subscribers frequently on the Uber and Lyft analysis as I’ve always had high conviction here.
I have medium to high conviction on semis being in a similar place. I’m personally a fan of making money on the way down, and if this market is going to be volatile, I don’t see the semiconductors being an exception. We already saw that with Micron dropping 11% in one day. We had covered this via technical analysis, as well.
Snap should have had another announcement on Audience Network by now. I am confident institutions were expecting this announcement, as well. This one needs to be looked again, as it’s been six months and no further word on this.
Below, we have a technical update for you to help guide entries and exits. There was some good discussion on the forum about technical analysis being especially helpful on knowing when to exit to protect gains. We may not control the market, but we can at least use probabilities to manage risk and formulate a game plan.
Technical Analysis
by Knox Ridley
Aerial View
What we are looking at is the weekly chart in the S&P 500 going back to 2012. As some of you know, the RSI measures the internal momentum/strength of the price trend.
When the RSI oscillates above 50 and into oversold levels around 70, this is a healthy uptrend. An example of this is the RSI uptrend from 2014 to 2015, which is highlighted in green arrows.
On the flip side, when the momentum and strength is failing, it can warn us of a trend change. You can see this between 2015-2016. This is a similar pattern to what we are seeing today. The RSI is failing to break through the downtrend resistance. I’ve marked this with red arrows where it is making lower lows while the price is making higher highs and is now approaching the 50-day moving average, which is highlighted in orange.
Close Up View
The market has been trading in an expanding wedge for the last couple of years, which is outlined in the expanding black trend lines. The price has tested the upper trend channel multiple times, and each time has failed to break out.
The important levels that I am watching are the 2725 region. If we break that region, marking a lower low in the 2019 corrections, that will be a major warning. We have one last level to test, which will be 2600. If we break 2600, then we will likely test new December lows. By this level, my stops would have been hit and I’ll wait for things to stabilize.
Past Expanding Wedge Pattern (1990)
The last time we saw an expanding wedge pattern play out on a similar time frame was in late 1990. The yellow section highlighted indicates a 20% drawdown in less than 3 months. So, these moves can be swift once the pressure builds.
Conclusion
When you factor in that the Manufacturing Index reported its first contraction since 2009, coupled with weakening global production, it’s obvious why sentiment is at heightened fear levels. Pundits will claim that manufacturing doesn’t matter in America; that the consumer is all that matters. However, manufacturing mattered in 2008 as it did in 2011 and it matters today.
The reverse side of the argument is that bull markets don’t usually end in a whimper. There have been some theories that October will be painful with the year ending with new highs. For me, the 2725 level and 2600 level are the levels when we will be heading towards a bear market. As of now, I am leaning into caution while holding high conviction tech names with tight stops.
Tech Sector
Like the S&P 500, the tech sector has broken the uptrend started from the 2018 December lows. Tech led the charge up, so will likely lead any charge down. The next support level will be the 50-day moving average, which is highlighted in orange. This is not a good sign and an indication that more downside is likely ahead.
Rotation is underway
The Fifty index tracks and rebalances for the stocks with the most momentum in the market. Technology and Consumer Discretionary takes up over 50% of the total allocation. Notice the rotation out of momentum and into the safe, defensive staples names.
As many of you know, we’ve been discussing the shift in cloud stocks. According to SentimenTrader.com, September 9th marked the biggest one-day shift in momentum since 2009. On this day, value outperformed the best performing stocks YTD – mainly tech momentum stocks. You can read our blogs here and here on similar topics.
Workday – If we break $163.75, we will likely find support around the $141-140 region. This region coincides with the 38.2% retrace and the 168% extension. These are significant Fibonacci levels that will act as strong support. I will look to be a buyer around this region regardless of broad market sentiment. If we break this level, the 50% retrace around $123 will be the next support region.
Roku – We’ve updated you recently on Roku in a separate technical analysis.
Snap – Suggested stop at $14.
Work –A safe stop is at $20. If we close at or below $20, something else is playing out.
Zoom – ZM held support around $80-$78, which was the ideal target for a base. However, it has broken this support and currently broke through the 61.8% retrace level around $74.80. Below the 78.6% retrace and we are dealing with something other than a pause in a major uptrend. Stop at $67.75
Chainlink – So far, Link has followed our game plan perfectly. It broke down below the $2 line, and traded down to the $1.70 and $1.50 range, which was dead center in the middle of our target box. Hopefully you layered in some buys at this range. We are currently back above $2. Link below $2 is a buy.
Bitcoin – Bitcoin has been trading within my target range for the last week – between the low $8,000s and high $7,000s. So far, the price action hasn’t confirmed a bottom. Bitcoin below $8,500 is a buy.